Federal Title I-A funds provide assistance to schools and local educational agencies (in New York City, the Department of Education) that serve a large number or share of students from low-income families. Under federal rules, school systems that receive at least $500,000 in Title I-A funds must use at least 1 percent of their annual allocation for activities that promote parental involvement. Title 1-A requires parental input into determining the activities provided as well as their implementation. Although schools also use additional sources to fund parental involvement, only Title 1-A requires that parents be involved in planning for the use of these funds.
In school year 2013-2014, 1,292 schools (nearly 79 percent) of the city’s public schools received Title 1-A funds.
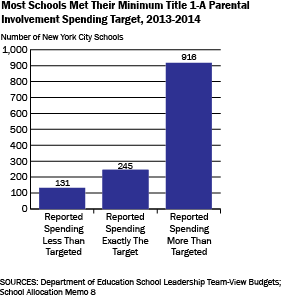
Schools receiving Title I-A funds collectively spent $11.2 million on parental involvement activities in 2013-2014—more than double the required minimum expenditure of $5.2 million for the Department of Education.
The education department gives schools a targeted amount of 1 percent of their Title 1-A funds to spend on parental involvement in the department’s school budget allocations.
In school year 2013-2014, 10 percent of Title 1-A schools with parental involvement spending targets self-reported spending below the amount targeted and nearly 71 percent reported spending more than their assigned target amount.
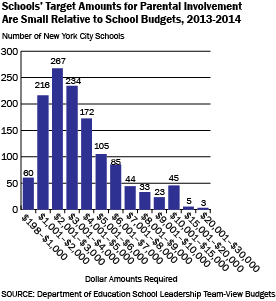
Nearly 70 percent of schools receiving Title I-A funds were targeted to spend between $1,000 and $5,000 for parental involvement.
For schools spending in this range, the expected expenditure equaled about 0.1-0.2 percent of an average school budget.
Lack of standardized reporting limits analysis by type of expenditure.
Prepared by Liza Pappas & Yolanda Smith New York City Independent Budget Office
In the 2013-2014 school year, approximately 36,000 students took the test to determine their eligibility for a seat in a New York City public school Gifted & Talented program for the 2014-2015 school year. The test is grade-specific and any student entering grades K through 3 can potentially take it.
The Department of Education defines the criteria for acceptance to a Gifted & Talented, or G&T, program. Students must take two tests measuring their verbal and nonverbal skills. The scores of these tests are combined to find a single rank for the student based on their age and national norms. Students can apply to a district-level G&T program if they rank above the 90th percentile, and they can apply to any of the five citywide G&T programs if they rank above the 97th percentile. Students receive offers based on their ranked scores and their school preferences.
Roughly 5,400 incoming kindergarteners who took the G&T test in school year 2013-2014 (about 40 percent of the test-takers) surpassed the 90th percentile, making them eligible to apply for a G&T program—1,500 of them achieved the highest score.
But the school system had G&T program seats for less than half of the qualifying kindergarteners, only a total of 2,200 seats were available across the city. This included 273 seats in the five most selective citywide programs.
This gap between the number of students meeting the official criteria and the spots available has meant that in recent years most of the G&T programs can only accommodate students ranking closest to the 99th percentile.
Prepared by Diana Zamora Bonnet New York City Independent Budget Office
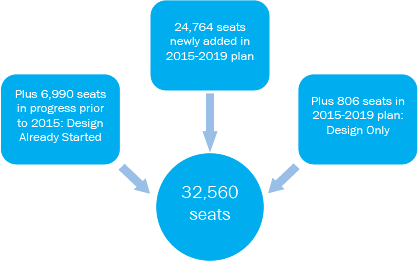
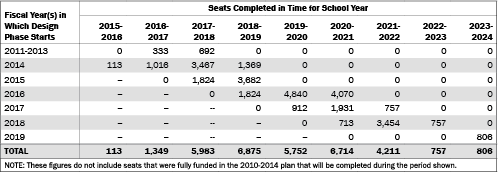
Under the recently adopted fiscal year 2015-2019 capital plan for schools, 62 percent of the 32,560 new seats will be completed within the five-year plan period, including projects that had been funded for design but not construction under the previous plan. Another 21 percent of the seats are expected to be completed in time for the 2020-2021 school year.
Including seats scheduled for completion after 2019-2020, design will begin for 79 percent of the new seats during the five-year plan period. Design for most of the other seats began during the preceding plan.
An average of 5,907 seats is expected to be completed each year from 2017-2018 through 2021-2022; over 95 percent of the new seats will be available by the start of the 2021-2022 school year.
The period from design to completion is typically expected to take from three to four years.
Prepared by Sarita Subramanian New York City Independent Budget Office
SOURCE: IBO analysis of Department of Education data
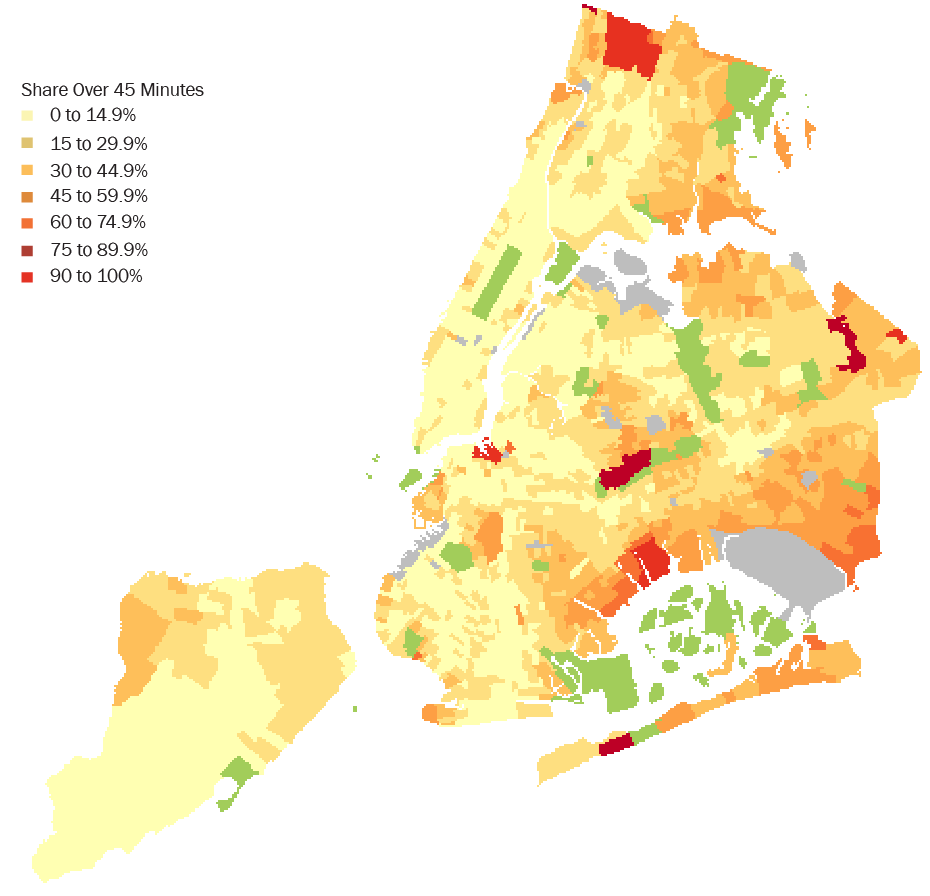
Citywide, the average high school student’s commute to school—by subway, bus, or foot—in school year 2011-2012 was estimated to take 32 minutes. In comparison, the commutes for city residents to jobs in the five boroughs averaged 39 minutes in 2012.
More than 1 in 5 high school students had commutes of 45 minutes or longer.
There was significant variation across census tracts in the share of students with longer commutes, reflecting both access to transit and school choice preferences.
The city’s Department of Education allows “hardship transfers” for high school students with commutes of more than 75 minutes. Less than 3 percent of high school students had commutes that long in school year 2011-2012.
The Geography of Student Commutes Longer Than 45 Minutes to School, School Year 2011-2012
Prepared by Asa Wilks New York City Independent Budget Office
SOURCES: IBO analysis of Department of Education Data, American Community Survey
NOTES: Calculations based on GoogleMaps estimate of trip times as of January and February 2014 between each student’s home and school address. Calculations reflect commuting time during business hours for students attending New York City high schools during the 2011-2012 school year. Trip duration includes walking time.