Category Archives: Municipal Labor
There Are More Municipal Workers Than Ever. But Is Headcount Up at All NYC Agencies?
Has the Number of Dues Paying City Union Members Changed Since the Janus Ruling?
Could City Employees Provide a Major Source of Enrollees for MetroPlus Gold?
Which Jobs Have Driven Staffing Increases at the City’s Department of Education Over the Last 10 Years?
How Does Pay at NYC Transit Compare With Other Metropolitan Transportation Authority Agencies?
How Does Sick Leave Usage Vary Across the City’s Workforce?
The use of sick leave by municipal employees varies widely among agencies. Uniformed employees in the fire, correction, and sanitation departments tend to use sick leave at higher rates than other city workers. Some of the difference is attributable to the type of work done by uniformed staff and the greater likelihood of on-the-job injury. Another factor may be the unlimited sick time provided to uniformed city employees. Sick leave usage by uniformed employees is a key driver of city overtime spending—a set number of workers are needed, for example, for patrol cars or fire and sanitation trucks whether or not the regularly scheduled employees make it to work.
- The recently released Mayor’s Management Report for Fiscal Year 2016 shows that uniformed police and fire personnel on average use sick leave unrelated to on-the-job injuries at a lower rate than their correction and sanitation department counterparts. Excluding days off for injuries on the job, police officers and firefighters also use sick leave less frequently than civilian employees. Still, firefighters are the most likely to be absent when factoring in leave that stems from work-related injuries.
- Sizable shares of police officers and firefighters (48 percent and 31 percent, respectively) used no sick leave of any sort in 2016. An additional 6 percent of police officers and 26 percent of firefighters only took sick leave due to on-the job-injuries. Conversely, 92 percent of correction officers and 90 percent of sanitation workers used at least some amount of sick leave for reasons other than being hurt on the job.
- In all four uniformed agencies, a small subset of personnel accounted for a disproportionate share of sick leave use not attributable to line-of-duty injury. The top 10 percent of uniformed personnel in terms of taking routine sick leave accounted for at least half of all sick leave use in their agencies. Each of the uniformed agencies monitors sick leave usage to minimize abuses. Uniformed personnel who are chronically absent may be subject to home visits to verify their condition and may also face the loss of certain discretionary benefits and privileges such as eligibility for assignment to special units or commands.
Prepared by Bernard O’Brien
New York City Independent Budget Office
Print version available here.
| New York City By The Numbers |
How Much Has the City Spent on Overtime Over the Past 10 Years?
Over the past 10 years, New York City’s overtime spending has increased from $928 million in 2006 to $1.659 billion in 2015, an increase of $731 million, or close to 80 percent (about 40 percent after accounting for inflation). While the increase in overtime spending over the 10 years appears sizable in dollar terms, as a share of total city spending the increase looks somewhat more modest: growing from 1.7 percent in 2006 to 2.2 percent in 2015.
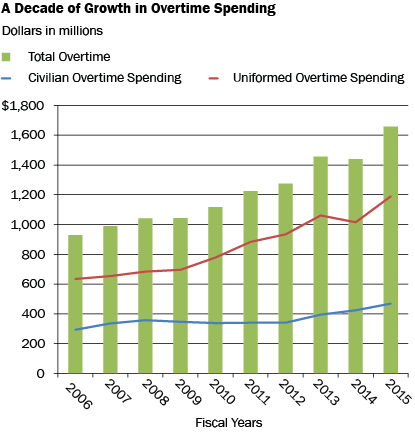
- Uniformed personnel including police, fire, correction, and sanitation accounted for roughly 70 percent of total citywide overtime spending, with the cost increasing from $635 million in 2006 to $1.190 billion in 2015, an increase of $555 million, or close to 90 percent (about 45 percent adjusted for inflation).
- The city’s civilian workers, roughly three-quarters of the municipal labor force, accounted for the remaining increase in overtime spending. For them, overtime spending grew from $293 million in 2006 to $469 million in 2015, an increase of $176 million. About half of that increase, $89 million, was for civilian workers in the police, fire, correction, and sanitation departments.
- The agency with the largest increase in overtime spending over the 10-year period was the police department. Overtime spending for uniformed and civilian staff in the police department grew from $412 million in 2006 to $716 million in 2015, an increase of $304 million, or 74 percent. Uniformed staff accounted for $252 million of the increase and civilian staff $52 million.
- Though the dollar amounts were less, the fire department also had a 74 percent increase in overtime spending during the 2006-2015 period. Overtime spending grew from $194 million in 2006 to $337 million in 2015, an increase of $143 million ($124 million for uniformed personnel and $19 million for civilians).
- At the Department of Correction overtime spending increased by 180 percent, rising from $70 million in 2006 to $196 million in 2015, an increase of $126 million ($116 million for uniformed staff and $10 million for civilians).
Prepared by Frank Posillico
New York City Independent Budget Office
SOURCE: New York City Financial Management System
Print version available here.
| New York City By The Numbers |
Did the Number of Municipal Employees Decrease Under the Bloomberg Administration?
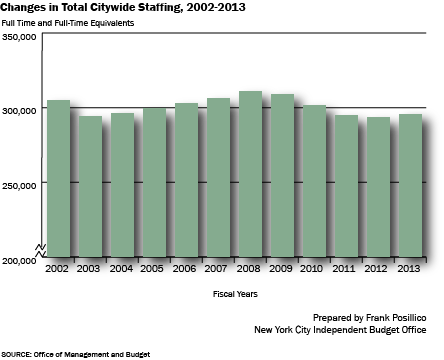
When Mayor Bloomberg presented his last budget plan in November, he noted that the city’s full-time and full-time equivalent headcount had fallen by 15,368 since December 31, 2001. But looking at staffing levels since the end of fiscal year 2002, which marks the beginning of Mayor Bloomberg’s first full-year budget, the numbers are somewhat different.
From June 30, 2002 through June 30, 2013, city staffing decreased by 9,028 positions and totaled 295,894 by the end of fiscal year 2013, a 3.0 percent decline.
- For many agencies, there was little change in staffing from June 30, 2002.
- Two areas of the budget accounted for the largest decrease in staffing, the education department and uniformed services.
- The largest decrease—4,607 positions—occurred in uniformed services, including 1,986 police officers (a decline of 5.4 percent), 1,141 fire fighters (10.1 percent) and 1,645 correction officers (15.5 percent).
- The education department saw a decrease of 4,496 positions (3.3 percent), of which 2,528 were teachers and professional staff.
Print version available here.
| New York City By The Numbers |
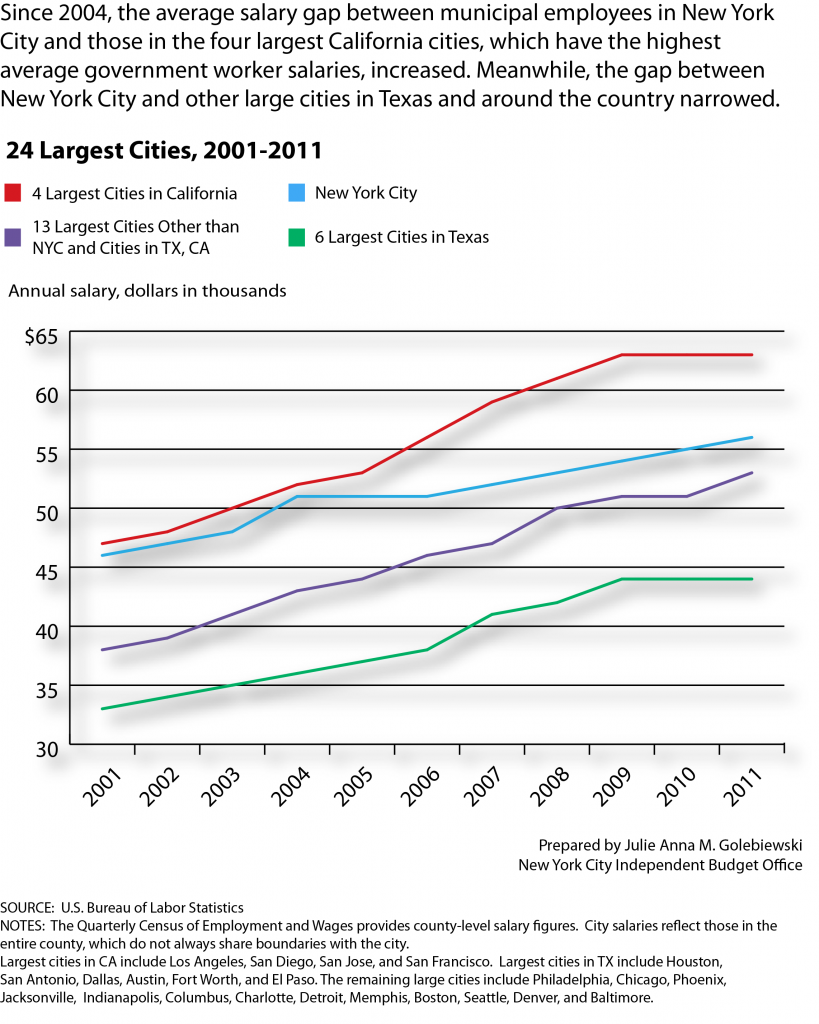
Salaries for Local Government Employees: How Does NYC Measure Up?
PDF version here.
New York City By The Numbers IBO Homepage