Has the Distribution of Cultural Development Funds Shifted Over Seven Years?

In 2009, the city’s Department of Cultural Affairs concluded a multiyear initiative to reform the Cultural Development Fund, the primary source of city funding for hundreds of arts and cultural organizations throughout the five boroughs. (The 33 cultural institutions located on city-owned property receive other support and are ineligible for these grants.) From fiscal years 2009 through 2015, the city has awarded a total of $210.5 million in Cultural Development Fund  grants. An average of 886 organizations per year received funding.

  • Total annual Cultural Development Fund grants (including City Council member items and Borough Arts Council grants) have increased from $29.0 million in fiscal year 2009 to $33.2 million in 2015. There is $33.5 million budgeted for the fund in 2016. Average funding per organization increased from $32,858 in 2009 to $37,340 in 2015.
  • Groups based in Manhattan receive by far the most funding, with awards totaling just under $20 million in 2015; organizations in Brooklyn, the borough with the second-highest share, received $6.5 million in funding that same year.
  • Manhattan’s share of total funding has decreased somewhat, from 63.7 percent in 2009 to 60.1 percent in 2015, while Brooklyn’s share has increased from 15.7 percent to 19.5 percent over the same time span. Shares for the other three boroughs changed very little.
  • Average funding per organization in 2015 ranged from $29,079 in Staten Island to $59,224 in the Bronx.

Organizations receiving grants can focus on single disciplines such as folk art, dance, or literature or be multidisciplinary. Multidiscipline organizations have received the highest percentage of total funding, over one-quarter of all funding each year. There has been little change in the distribution of funding across all disciplines since the revamping of the cultural fund in 2009.

NOTES: *Chart excludes funding for Borough Arts Councils because many of them do not categorize recipient groups’ disciplines. **Combines Botanical, Crafts, New Media, Photography, Science, and Other categories. ***Combines three different multidiscipline categories.

  • Music has seen the biggest decrease in its share of funding over the past seven years, a drop of 2.9 percentage points from 17.0 percent of total funding in 2009 to 14.1 percent in 2015.
  • Visual arts has seen the biggest increase in its share of funding over the same time period, from 4.5 percent in 2009 to 6.4 percent in 2015.

 Prepared by Katie Hanna

New York City Independent Budget Office

SOURCE: Department of Cultural Affairs

Print version available here.
New York City By The Numbers

IBO Homepage

Does City Spending on Antismoking Efforts Affect Smoking Rates?

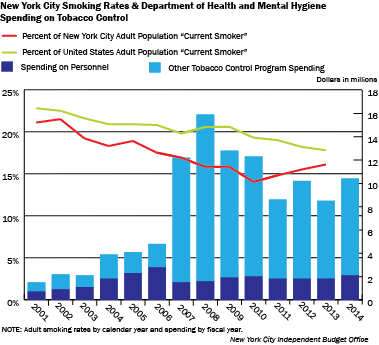
A recently released American Cancer Society annual report says that based on federal Centers for Disease Control and Prevention guidelines New York State failed to invest sufficient funds last fiscal year on antismoking efforts. IBO’s review of New York City’s own spending on antismoking programs finds that spending levels have varied widely in recent years—and that after trending downward the local adult smoking rate has been increasing.

In 2002, the city’s Department of Health and Mental Hygiene launched its tobacco control plan for reducing smoking among city residents. The plan included: hiking taxes on tobacco products; distributing cessation aids for current smokers; advocating for and enforcing antismoking legislation; and running public education campaigns on the consequences of tobacco use. Spending rose steeply in 2007, with the increase driven by advertising, media campaigns, and nicotine replacement therapies, rather than agency staffing. Tobacco control spending jumped again in 2008—reaching more than 10 times the 2001 level—even as spending on agency staff barely grew. A three-year decline in spending followed in 2009 through 2011, with all of the cuts coming from sources other than health department staff.

chartnycbtn45a

  • The impact of the tobacco control plan on smoking behaviors occurs with a lag because of the time it takes individuals to  cut back or quit—and particularly for spending programs, the time it takes to launch new initiatives.
  • In calendar year 2002, the city and state each hiked their excise taxes on cigarettes to $1.50, for a total of $3.00 per pack. With additional state increases in 2008 and 2010, the combined state and local tax is now $5.85 per pack, plus an additional $1.01 per pack federal tax.
  • The big increase in city spending on antismoking programs, along with the tax increases, have been credited with reducing the smoking rate in the city during a period when the U.S. smoking rate barely declined. In 2010, the city’s smoking rate fell to 14.0 percent, a 15-year low and 5.3 percentage points below the U.S. rate.
  • After 2010, smoking rates in the city began to rise, reaching 16.1 percent in 2013 (the latest data available), just 1.7 percentage points below the U.S. rate. The increase in the city’s smoking rate occurred in tandem with declines in spending on tobacco control programs. City spending on antismoking campaigns in 2011-2014 averaged about a third less than during the 2007-2010 peak spending period.
  • Health department officials have cited the decline in spending on tobacco control as a cause of the increase in the share of adults who smoke. With $5.0 million budgeted for tobacco control in the current fiscal year, less than half the amount spent in 2014, there is concern that the smoking rate could continue to rise.

Prepared by Erin Kelly
New York City Independent Budget Office

SOURCES: Department of Health and Mental Hygiene, Community Health Survey 2002-2013; Centers for Disease Control and Prevention, National Health Interview Survey, 2013

Print version available here.

New York City By The Numbers

IBO Homepage