It is commonly assumed that rent regulation limits the amount owners can charge tenants, keeping rents below what the market would otherwise command. Yet for thousands of apartments across the city, landlords charge their tenants rents that are lower than the maximum allowed under rent-regulation rules. This is known as a preferential rent. While landlords will sometimes forgo additional permissible rent to retain a reliable tenant, in neighborhoods where there are large shares of tenants paying preferential rents, it is an indication that local market rents are not constrained by rent regulations.
Using apartment registration data from the New York State Division of Housing and Community Renewal, IBO found that of the 765,354 state-registered units subject to the traditional rent-regulation rules in 2013 (the most recent data available), 23 percent—more than 175,000 apartments—were rented at a preferential rate.
Share of Regulated Units Rented at Preferential Rates
Click on a neighborhood to see number of rent-regulated apartments and share with preferential rents.
- Neighborhoods with some of the highest shares of tenants in regulated units paying preferential rates were Oakwood in Staten Island (62 percent), and Fresh Meadows and Bay Terrace in Queens (61 percent and 60 percent, respectively). The overall number of regulated units in these areas, however, was small.
- In neighborhoods with large numbers of regulated units, those with high shares of units receiving preferential rents include Flushing (38 percent), Astoria (35 percent), and Hunters Point-Sunnyside (34 percent).
- Some of the neighborhoods with substantial numbers of regulated units and the lowest shares of apartments with preferential rents include the West Village (10 percent) and the Upper West Side (10 percent). Outside of Manhattan, Borough Park (15 percent) and Prospect-Lefferts Gardens (17 percent) in Brooklyn had low shares of preferential rents.
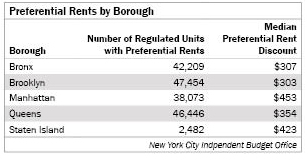
- The prevalence and extent of the rent preference varies among the boroughs. Brooklyn had the largest number of regulated units receiving preferential rents, followed by Queens.
- In terms of the median preferential rent discount—the difference between what the tenant pays and the maximum legal rent the landlord could charge under rent regulation—apartments in Manhattan had the largest median discount, while units in Brooklyn had the smallest.
The fact that in some parts of the city more than a quarter of units receive preferential rents indicates that rent regulation is not always the most important factor in determining a tenant’s rent. Barring substantial increases in market rents in the neighborhoods with large shares of regulated units with preferential rates, continued regulation might not make much difference in determining the cost of housing for tenants in those areas.
Prepared by Sarah Stefanski
New York City Independent Budget Office
SOURCE: IBO analysis of data from the New York State Division of Housing and Community Renewal
NOTES: A total of 862,254 regulated units were registered with the New York State Division of Housing and Community Renewal in 2013, approximately 84 percent of the total estimated number of rent-regulated units in the city. A total of 96,900 units added into rent regulation after 1974 in exchange for certain financing benefits, such as the 421-a and 421-g tax incentive programs, were excluded from this analysis.
Print version available here.
| New York City By The Numbers |