The Quarterly Census of Employment and Wages data produced by the New York State Department of Labor shows that there are 226,900 private firms in New York City with about 3.8 million workers on their payrolls. IBO has grouped these establishments into four categories based on the number of workers they employ to look at how sector and wage profiles differ among firms of different sizes.
| Employment and Wages by Business Size, 2013 | |||
| Establishments | Employment | Total Wages | |
| Very Small Businesses (<20 Employees) |
88.3% | 22.3% | 14.4% |
| Small Businesses (20-99 Employees) | 9.6% | 22.8% | 20.5% |
| Medium Businesses (100-499 Employees) | 1.8% | 21.0% | 23.9% |
| Large Businesses (≥500 Employees) | 0.3% | 33.9% | 41.2% |
| New York City Independent Budget Office | |||
- A vast majority (88 percent) of businesses in the city employ less than 20 workers, while businesses employing 100 or more workers account for only 2 percent of all establishments.
- Large businesses employ over one-third of all workers, with the remaining employees almost equally distributed across very small, small, and medium-size businesses.
IBO also classified businesses by their average hourly wages and industrial sector. By grouping businesses by average wages (low, medium, and high) and firm size (very small, small, medium, and large), we can see how closely their shares of employment and wages match.
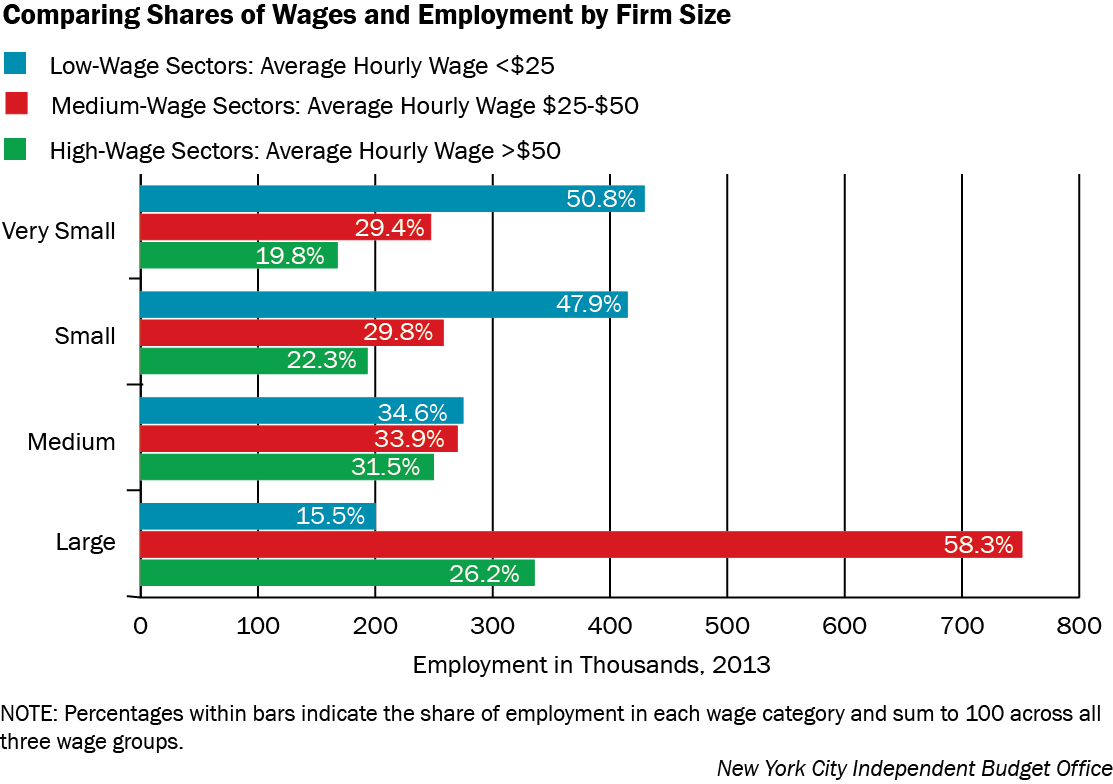
- Very Small businesses have a relatively small share of total wages (14 percent) compared with their share of employment (22 percent). Just over half of the 844,000 workers in these very small firms (51 percent) are employed in low-wage industries. This includes 182,000 who work in wholesale and retail trade. An additional 113,000 work in leisure and hospitality and 91,000 more are employed in other services.
- In contrast, the share of wages paid by the city’s small businesses (21 percent) is much closer to these firms’ share of total employment (23 percent). Almost half of the 866,000 employees of small businesses work in low-wage industries such as leisure and hospitality (165,000 workers) and trade (150,000).
- Medium-size businesses employ 795,000 workers and their wages are almost evenly divided among low-, medium-, and high-wage sectors. Employees in high-wage industries—including professional and business services, which employs 126,000 workers—receive about 60 percent of all wages paid by medium-size firms.
- Of the 1.3 million employees of the city’s large businesses, 264,000 work in the high-wage professional and business services and financial services industries. Two low-wage industries in the large establishment category—trade and leisure and hospitality—employ 200,000 workers. Roughly half of all workers in large firms are employed in education and health services, which are medium-wage industries.
Prepared by Debipriya Chatterjee
New York City Independent Budget Office
Print version available here.
SOURCES: IBO calculations of Quarterly Census of Employment and Wages data provided by New York State Department of Labor
| New York City By The Numbers |