Category Archives: Education

How Many Students Either Exit or Transfer Within the NYC School System in a Single Year?

Each school year there is considerable movement of students who transfer from one school to another or out of the city’s public school system altogether. To develop a clearer picture of the extent of this movement and some factors that may prompt these transfers and exits from the school system, we tracked the mobility of students enrolled in the city’s traditional public schools and charter schools over a one-year period from the start of school year 2014-2015 to the start of the next school year. There were 1.043 million students enrolled in grades K-12 at the start of this period. When you take into account the students who graduated from high school or moved on, for example, from elementary school to middle school, you are left with 872,863 students.

  • More than 730,000 students remained in the same school from the start of school year 2014-2015 to the start of the next school year—a stability rate of 84 percent. This rate was higher in grades K-8 (84 percent) than in high schools (82 percent). The 2014-2015 stability rate was 2 percentage points higher than the rate for 2011-2012.
  • More students transferred schools (77,800, or 9 percent) than exited the system either to go to a private school or a school outside the city (51,500, or 6 percent) or dropped out or otherwise left the school system without graduating (13,300, or less than 2 percent). Transfers occur for a variety of reasons ranging from transfers prompted by the Department of Education to improve a student’s opportunities for learning to temporary transfers to a school or program, to elective transfers by the family, including to and from charter schools.

  • Not all transfers or exits are permanent. Some of the 142,617 students who initially transferred or exited switched again during the 2014-2015 school year or in the following summer. Nearly 2,700 students who transferred or exited returned and earned a credential later that same year.
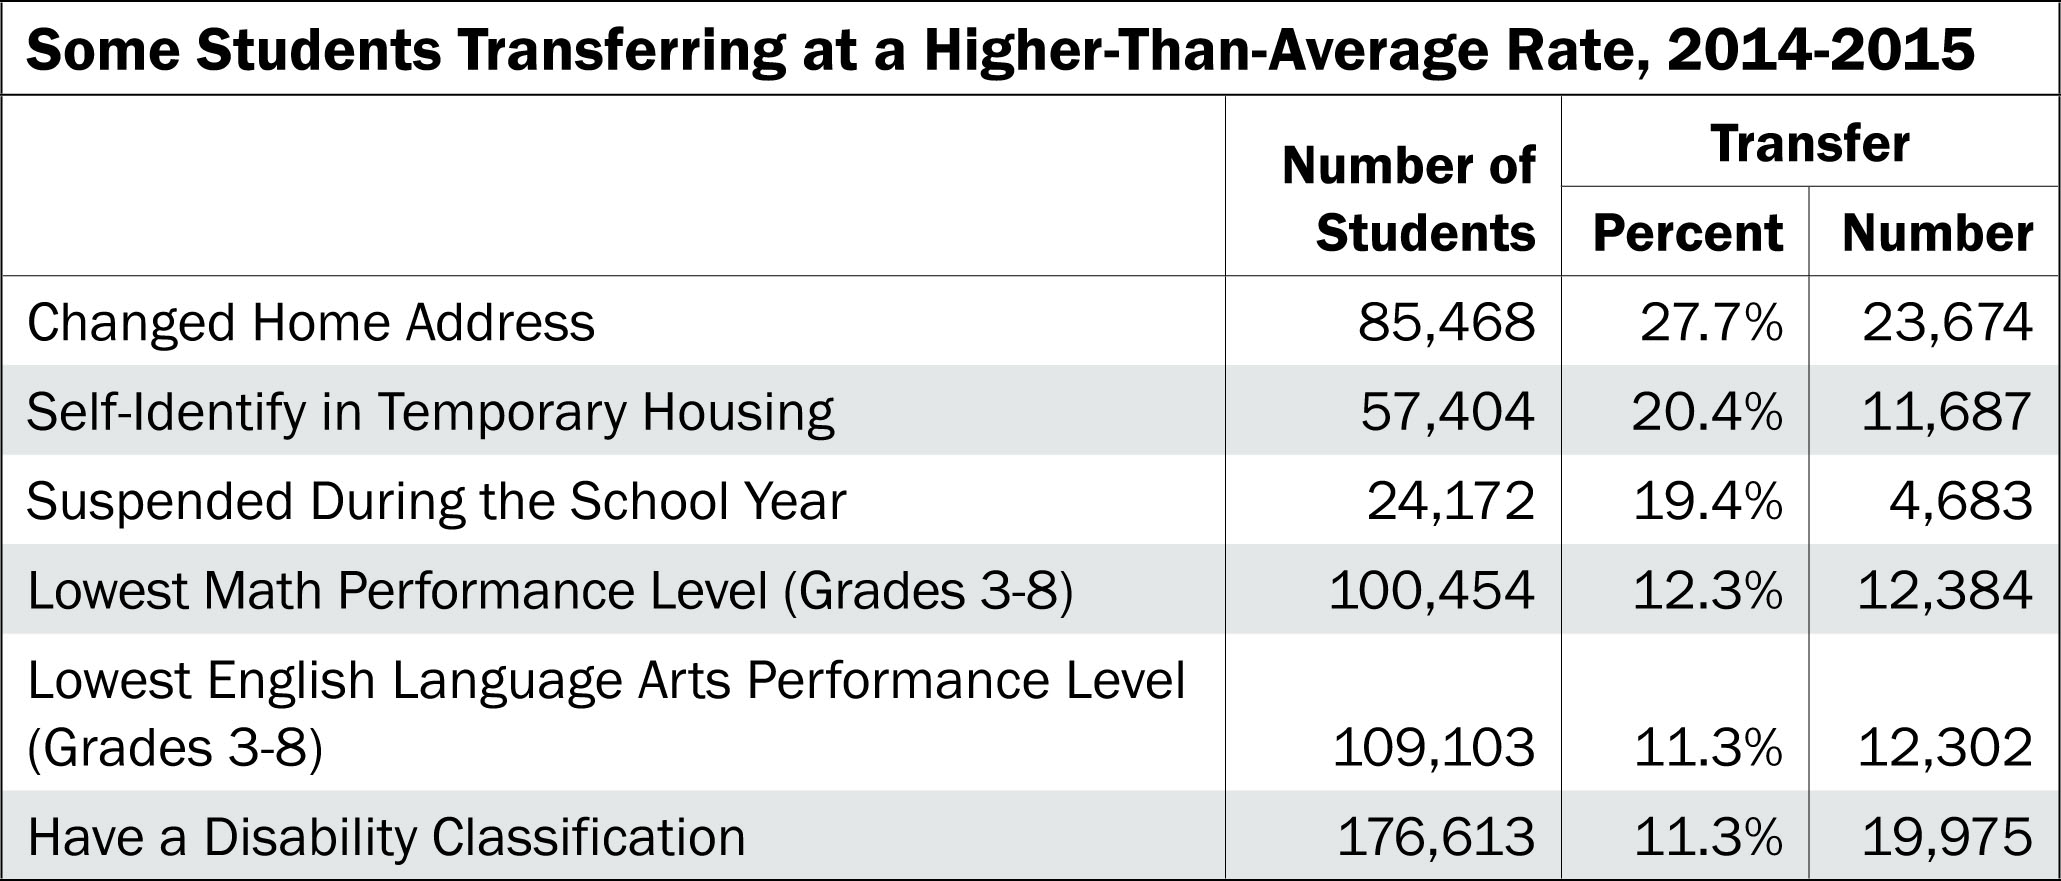
  • Not surprisingly, students who have changed home addresses from one year to the next transferred schools within the public school system at the highest rate. Nearly 28 percent of the almost 85,500 students who changed home addresses transferred schools during the period we examined.
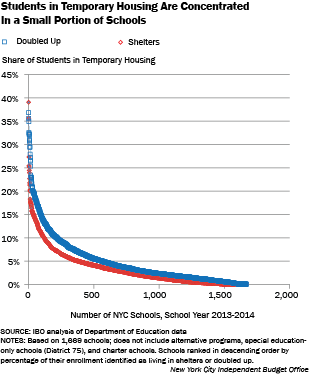
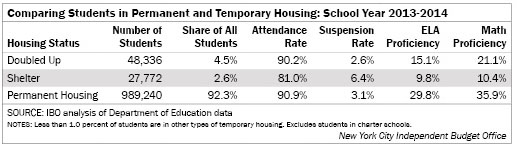
  • Students who self-identify as living in temporary housing at some point in the school year also transferred schools at a higher-than-average rate. Over 20 percent of these 57,400 students transferred schools.
  • Over 19 percent of the nearly 24,200 students who were suspended at some point in the school year transferred schools.
  • Students who scored at the lowest level on the grades 3-8 English language arts and math tests also transferred schools at above-average rates: 12 percent of the 100,500 students who scored at the lowest level on the math test and 11 percent of 109,000 students at the lowest level on the English test.
  • Over 11 percent of the 176,600 students classified as having a disability also transferred schools.

Prepared by the Education Research Team
 New York City Independent Budget Office

Print version available here.

SOURCE: IBO analysis of Department of Education data

New York City By The Numbers

IBO Homepage

Since the Expansion of Pre-K, Do More Students Move on to Traditional Public and Charter Schools for Kindergarten and First Grade?

How Much Does Residence Limit the Types of New York City Traditional Public Schools That People Choose?

As the Number of Students Living in Shelters Has Grown, Has The Increase Been Uniform Among Schools Across the City?

Are Fewer Child Care Vouchers for 4-Year-Olds Being Used Because of the Expansion of Full-Day Pre-K?

Under federal and state law, families with young children receiving cash assistance and participating in work or training programs are guaranteed vouchers to pay for their choice of child care providers. A limited number of vouchers are also available to low-income working families. As the de Blasio Administration moved to vastly expand the number of full-day pre-kindergarten slots available for the city’s children, many expected that there would be a corresponding decline in the use of child care vouchers for 4-year-olds.

  • From October 2013 through October 2015 the number of children enrolled in full-day pre-k more than tripled, rising from 19,490 to 69,090.
  • Over the same period, the use of of full-time vouchers for the care of 4-year-olds fell. For the children of cash assistance families the decrease was only 9.5 percent, from 6,128 to 5,549.
  • For children in low-income families the number fell by 23.3 percent, from 1,395 to 1,070.
  • Together, these changes mean that as of fall 2015, 6,619 children were still in voucher-funded full-time child care rather than Department of Education pre-k classes.
  • The relatively small number of 4-year-olds in part-time voucher child care increased over the two years by 36.9 percent, from 279 to 382. It is possible that many of them were attending pre-k classes and using the vouchers for after-school care.


Parents who use child care vouchers can choose among a wide variety of child care providers including informal care, family child care, and center-based care. Not all of these providers offer the educational elements available to children enrolled in the Department of Education’s pre-k programs.

Prepared by Paul Lopatto
 New York City Independent Budget Office

Print version available here.

SOURCES: Department of Education; Administration for Children’s Services
NOTES: Pre-k enrollment is as of October of each year. The voucher numbers for school years 2013-2014 and 2014-2015 are averages for September through June. The voucher numbers for 2015-2016 are averages for September through December.

New York City By The Numbers

IBO Homepage

Are Students With Disabilities Suspended at a Higher Rate Than Other Students?

Although students with disabilities comprised about 18 percent of the overall student body in school year 2012-2013, they made up about 30 percent of the suspended student population (defined as the population of students who have been suspended at least one time).

Approximately 95 percent of students with disabilities fall into one of six disability classifications: autistic, emotionally disturbed, learning disabled, intellectually disabled, speech impaired, and other health impaired. There are wide variations in suspension rates across these categories (suspension rates were calculated by dividing the number of suspended students in each category by the number of all students in that category: for example, the number of learning disabled students with at least one suspension by the total number of learning disabled students).

  • Students without disabilities had a 2.7 percent suspension rate in school year 2012-2013.
  • Overall, students with disabilities had an average suspension rate of 7.4 percent.
  • Students classified as emotionally disturbed had a suspension rate of 15.4 percent, which is more than five times higher than the suspension rate of students without disabilities and about twice as high as the overall suspension rate for students with disabilities.
  • Students classified as learning disabled and other health impaired were suspended at rates almost three times as high as students without disabilities (7.4 percent and 7.1 percent, respectively).
  • Students with autism and students with intellectual disabilities were suspended at lower rates than students without disabilities, and were suspended far less frequently than students with other types of disabilities.

Prepared by Katie Mosher
 New York City Independent Budget Office

Print version available here.

SOURCE: IBO analysis of Department of Education data
NOTE: 2012-2013 was the most recent year of data available at the time of analysis. Excludes schools in the citywide special education district (District 75). For more information on students with disabilities, see http://schools.nyc.gov/academics/specialeducation/default.htm

New York City By The Numbers

IBO Homepage

Do Some City Schools Have an Unusually Large Share of Students Who Live in Public Housing?

In two recent high-profile school rezoning controversies, overcrowded schools primarily serving higher-income students were located in close proximity to underutilized schools largely populated by students in public housing. To shed light on this issue, IBO examined the distribution of students from public housing across New York City’s public schools.1

The New York City Housing Authority provides housing to low- and moderate-income residents throughout the five boroughs. In 2013, public housing was home to 4.8 percent of the city’s residents, but the nearly 95,000 students who lived in public housing made up 8.6 percent of the public school population, including charter school students.

IBO calculated the share of elementary and middle school students in each school who lived in public housing in order to gauge how the students were distributed across schools during the 2013-2014 school year. We chose to look at grades K-8 because high schools tend to be less tied to specific geographic zones.


nycbtn52chartforwebfinal

  • In 123 schools serving grades kindergarten through 8, students in public housing comprised more than 35 percent of enrollment.
  • This 9 percent of schools accounted for more than one-third of all K-8 students living in public housing.
  • Conversely, most schools served few students living in public housing: In 702 schools, 5 percent or fewer of their K-8 students lived in public housing.
  • The average K-8 student attended a school where 8 percent of students lived in public housing.

Prepared by Stephanie Kranes
 New York City Independent Budget Office

SOURCE: IBO analysis of Department of Education and New York City Housing Authority data
NOTE: 1“Race and Class Collide in a Plan for Two Brooklyn Schools,”  “For Two Sharply Divided Manhattan Schools, an Uncertain Path to Integration

Print version available here.

New York City By The Numbers

IBO Homepage

Do Some Schools Have a Disproportionate Share of Students Living In Homeless Shelters or Doubled Up in Another Household?

About 75,000 students—or over 7 percent—of the city’s 1.1 million public school students lived in the city’s homeless shelter system or were doubled up in the home of a friend or family member at some point during school year 2013-2014.  A disproportionately large share of temporarily housed students were concentrated in a relatively small number of city schools.

nycbtn49c1final2

  • About four hundred schools (close to 25 percent of the total 1,669 schools examined) served a population where at least 5 percent of students enrolled were identified as living in shelters and at least 7 percent of students were identified as living in doubled-up housing during all or part of school year 2013-2014.
  • One hundred and twenty schools served a population where more than 10 percent of students were identified as living in shelters; there were 12 schools in which more than 20 percent of students were identified as living in shelters.
  • Two hundred and eighteen schools served a population where more than 10 percent of students were identified as living in doubled-up housing. There were 34 schools in which more than 20 percent of enrollment was identified as living doubled up.
  • More than 560 schools, or roughly 34 percent, have less than 1 percent of their student population living in a shelter. Nearly 280 schools have virtually no students identified as living in doubled-up housing.

printnycbtn49tablefinalc

  • Analysis of student data from 2013-2014 shows that students living at least part of the school year in homeless shelters were absent from school far more frequently—about 18 days more—than their permanently housed peers as well as those who were doubled up.
  • Students who resided in homeless shelters were suspended from school at more than twice the rate of students who lived in permanent housing.
  • State test scores for 3rd through 8th graders were also significantly lower for both students living in homeless shelters and those in doubled-up housing situations compared with their permanently housed peers.

 Prepared by Liza Pappas

New York City Independent Budget Office


Print version available here.

New York City By The Numbers

IBO Homepage

How Much Do Public School Budgets Vary Across the City’s School Districts and Boroughs?

There is a great deal of variation in average per pupil allocations across community school districts. In 2013-2014, the last school year in which budgets were set by the Bloomberg Administration, school district allocations averaged $8,255 per student in grades pre-k through 8. The difference in per pupil allocations between the district with the highest average allocation (district 16, Bedford-Stuyvesant) and the lowest (district 24, Corona/Elmhurst) was $3,800.

This variation is not unexpected. Schools recieve funding from a variety of state, city, and federal sources, many of these funding streams attempt to direct resources to students deemed to have greater needs. Moreover, per pupil spending is also a function of school size, with large schools generally receiving less funding per pupil than schools with fewer students.

  • Some part of the difference in allocations relates to the relative socio-economic status of the communities within each district.
  • The largest per pupil allocations are found in the South Bronx (district 7), Central Brooklyn (district 16), Upper Manhattan (districts 4 and 5), and the Lower East Side (district 1). The lowest per student allocations are found in Queens (districts 24, 25, and 26) and Manhattan (district 2).

The results displayed by borough and funding source shed more light on these differences.

  • The three largest funding streams for schools, Fair Student Funding, other city funds, and Federal Title 1, drive the major difference across boroughs. Schools in Queens receive, on average, $1,310 less per pupil from these combined sources than schools in the Bronx.

School size also contributes to the differences in per pupil allocations across districts and boroughs. Generally, large schools receive less funding in per pupil terms than small schools. This is likely because schoolwide costs are being shared over a greater number of students. Queens, with the largest average school size, had the lowest per pupil allocations, while Manhattan and the Bronx, with the two smallest average school sizes, had the two largest per pupil allocations.

tablebtn47

 Prepared by Ray Domanico

New York City Independent Budget Office

SOURCE: IBO analysis of Department of Education data
NOTES: Excludes high schools and schools in the citywide special education district (district 75) because they are not evenly distributed across community school districts. Spending allocated to school budgets exclude fringe benefits.

Print version available here.

New York City By The Numbers

IBO Homepage

Do a Larger Share of Students Attending the City’s Specialized High Schools Live in Neighborhoods With Higher Median Incomes than Those Attending the City’s Other High Schools?

The city’s Department of Education runs nine specialized high schools that are among the most selective of the city’s public high schools. Eight schools admit students based solely on the score attained on the Specialized High Schools Admissions Test and admission to LaGuardia High School is based on an audition. All 8th graders and first-time 9th graders who are New York City residents are eligible to take the test. The score required for acceptance depends on the school and varies each year.

IBO used the address of each student attending a New York City public high school in the 2012-2013 school year to identify the census tract in which each student lived and the median household income for households residing in the tract. We then compared the median incomes of the neighborhoods where students lived who were attending the specialized high schools with those of students attending all other public high schools.

  • Students in the specialized high schools came from census tracts where the median household income averaged $62,457 compared with $46,392 for students in other high schools. (All dollar amounts are reported in 2012 dollars).
  • If we rank the census tracts by their median income and then divide the tracts into equal fifths (quintiles), we observe large differences between the share of students in specialized high schools and other high schools from each quintile.


  • Only 11 percent of specialized high school students came from the lowest income census tracts (those where the median household income is less than or equal to $33,862) whereas 30 percent of students in other high schools came from these neighborhoods.
  • Twenty-six percent of specialized high school students reside in the top income quintile (the 22 percent of census tracts with median incomes over $81,650) compared with just 7 percent of those attending other high schools
  • Overall, the share of students attending specialized high schools increases steadily and then drops marginally in the two highest quintiles, as we move from the census tracts with lower median household incomes to the census tracts with higher median incomes. For students attending other Department of Education high schools, the pattern is the opposite: the share of students declines as median income increases.


Prepared by Stephanie Kranes
New York City Independent Budget Office

Print version available here.

New York City By The Numbers

IBO Homepage