To view in full screen, hover over the top right corner and click the screen icon
Category Archives: Transportation
As Ridership Plummets, How Far Might NYC Transit Revenue Fall?
Morning Malaise: How Much Extra Time Is Spent Waiting for the Subway on Your Line?
Good, Fair, or Poor: What’s the Condition of the City’s Streets?
The Department of Transportation repairs and maintains the city’s streets. To fulfill this task, the department performs an ongoing street quality assessment and rates sections of every street in the city on an 18-month rolling basis on a scale from 1 to 10. Ratings are categorized into “poor” (1-3), “fair” (4-7), and “good” (8-10), with the exception of local streets for which a rating of 7 is deemed “good.”
Neighborhood Street Ratings with Borough and Citywide Rankings
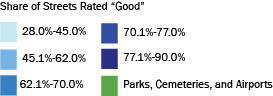
- Based on ratings from 2014 and 2015 and weighted by their square feet, 70.2 percent of the city’s streets are in good condition, 29.2 percent are in fair condition, and 0.6 percent are in poor condition. Street conditions citywide have trended downward somewhat since 2012, according to the Mayor’s Management Report.
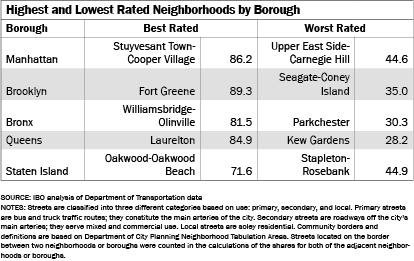
- Brooklyn streets are in the best shape with 75.1 percent of its streets rated as good, followed by Queens with 71.0 percent and the Bronx with 68.5 percent. Manhattan and Staten Island are the boroughs with the fewest streets in good shape—only 66.3 percent and 59.6 percent, respectively.
- Citywide, the neighborhoods with the best ratings are Fort Greene (89.3 percent good), Starrett City (86.5 percent), and Williamsburg (86.3 percent), all of which are located in Brooklyn. The neighborhoods with the worst street quality are Kew Gardens in Queens (28.2 percent good), Parkchester in the Bronx (30.3 percent), and Seagate-Coney Island in Brooklyn (35.0 percent).
Prepared by Giovanella Quintanilla Re
New York City Independent Budget Office
Print version available here.
| New York City By The Numbers |
How Does Pay at NYC Transit Compare With Other Metropolitan Transportation Authority Agencies?
How Much Would the City’s Annual Contribution Be Today If Aid for the Metropolitan Transportation Authority’s Capital Projects Had Kept Pace with Inflation?
The city makes an annual payment to the Metropolitan Transportation Authority (MTA) to support the authority’s capital program. NYPIRG’s Straphangers Campaign asked IBO to review the annual contributions to see if they have kept pace with inflation.
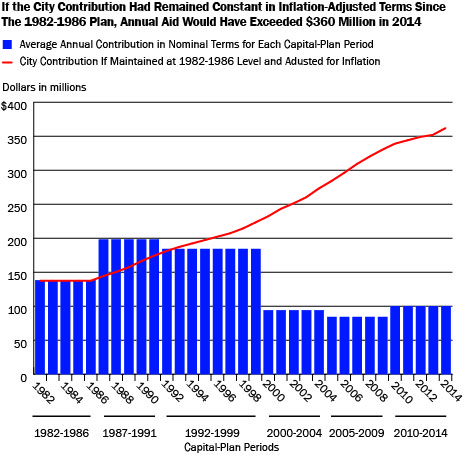
• The city’s contribution to the MTA’s first five-year capital plan (1982-1986) averaged $136 million a year. In nominal terms, the city’s contribution was highest during the 1987-1991 and 1992-1999 plans and has remained fairly constant at around $100 million per year since 2000.
• If the city had instead decided to keep its contribution at the 1982-1986 level in real (inflation-adjusted) terms, the contribution would have reached $363 million in 2014, and provide more than $1.8 billion for the proposed 2015-2019 capital plan.
• The city’s contribution to the MTA’s 1982-1986 capital plan averaged 1.2 percent of total city-funded expenses over the five-year period. Over time the city’s contribution as a share of total city-funded expenses has declined dramatically. The city’s contribution to the MTA capital plan in 2010-2014 averaged just 0.2 percent of total city-funded expenses a year.
New York City and state also provide indirect support to the capital program through dedicated tax revenue—in most cases, revenues predominately collected in the 12-county MTA region—that flow into the MTA’s operating budget. These revenues, which have grown substantially over the past three decades, are used to pay debt service on MTA bonds that finance capital projects as well as the operating expenses of the transit system. IBO estimates that New York City residents alone generated around $3.1 billion in city and state tax revenue for the MTA in 2014, compared with just $235 million in 1983.
Prepared by Alan Treffeisen
New York City Independent Budget Office
SOURCES: IBO analysis of data from the Metropolitan Transportation Authority, Moody’s Analytics, and the New York City Comptroller’s Office
NOTES: Inflation measured by the local government GDP deflator for the New York City metropolitan region. IBO compares the city’s contribution to the MTA on a calendar year basis to the city’s fiscal year expenditures.
Print version available here.
| New York City By The Numbers |
Did the City’s Subsidy for the Former Private Bus Lines Rise or Fall After Their Takeover by the Metropolitan Transportation Authority?
- In 2002, Mayor Bloomberg urged that the Metropolitan Transportation Authority (MTA) take over the 82 express and local bus routes (most based in Queens) operated by seven private companies under franchise agreements that included city subsidies. He initially suggested that a takeover by the MTA could mean an end to city operating subsidies, which at that point totaled roughly $150 million to $175 million per year.
- After reaching an agreement in 2004, the MTA took over the last of the routes in 2006. Under the new arrangement, the city reimburses the MTA for any operating expenses not covered by fares or a small amount of taxes dedicated to the bus lines.
- Thanks in part to an influx of new buses, service has improved, but savings have not materialized. The city subsidy to MTA Bus—the subsidiary set up to run the lines—grew from $237 million in fiscal year 2008 to $393 million in 2013. The city’s payments to MTA Bus since 2008 have outpaced the growth in the operating budgets of both the city and the MTA’s other transit divisions.
- The city also pays rent to some of the companies that had run the buses for use of their depots at a cost of about $17 million in fiscal year 2013, up from $14 million in 2008.
Prepared by Alan Treffeisen
New York City Independent Budget Office
SOURCES: Metropolitan Transportation Authority Financial Plans; Mayor’s Office of Management and Budget; IBO Fiscal History, Revenue and Expenditure Summary
Print version available here.
| New York City By The Numbers |