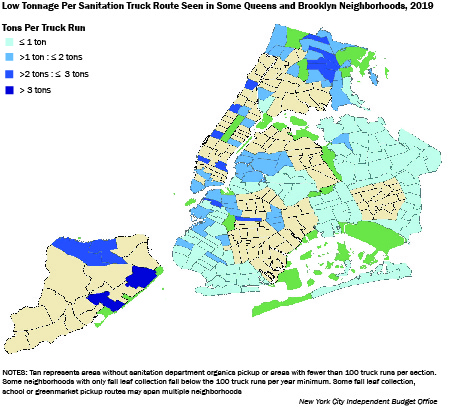
Last May, faced with $25 million in pandemic-related budget cuts, the Department of Sanitation stopped collecting recyclable organic material from residences, schools, and greenmarkets. The sanitation department also canceled last year’s autumn leaf collections. While the 2021 Adopted Budget restored $3 million for some organics drop-offs at greenmarket sites, the bulk of the program remains suspended.
Starting back in 2013, the city had been slowly expanding organics recycling across the five boroughs, although further expansion of the residential curbside program was halted in 2018 as the sanitation department searched for ways to make the collection routes and processing more cost efficient. Low public participation had resulted in partially filled trucks and higher costs in certain areas of the city, a factor that ultimately made the program vulnerable when the Covid-19 crisis triggered the need for budget cuts. IBO examined a few of the factors that led organics collections to be more efficient in some neighborhoods than others.
Prior to the program’s suspension, the majority of organics tonnage came from curbside residential collections, with smaller amounts from schools, fall yard waste collections, and greenmarket drop-off sites. But participation in the different types of collections varied throughout the city.
Staten Island—the city’s least densely populated borough—saw the largest share of collections from yard waste, which made up around 35 percent of the borough’s annual organics tonnage. In Manhattan, collections from schools made up the largest share while, curbside residential collections made up the majority of collections in Brooklyn, Queens, and the Bronx.
In general, yard waste and schools collection are more efficient because the sanitation department gets more material per route from these pickups than from residential and greenmarket collections. The highest average tonnage per route, and therefore the routes with the greatest efficiency, occured mostly in areas with more yard waste and school collections: Staten Island, Manhattan, and parts of the Bronx. The lowest tonnage routes were clustered in eastern Queens and southern Brooklyn.
Neighborhoods such as Greenpoint in Brooklyn, Riverdale in the Bronx, and Mariners Harbor in northwest Staten Island were some of the first communities to have curbside organics collection, and the sanitation department tended to collect more tons per route in these neighborhoods. In neighborhoods in Queens and southern Brooklyn, where the program had been expanded more recently, participation had not gained traction.
If the program is reinstated, an ongoing commitment to mandatory citywide curbside organics collection and providing more ways for the public to participate could lead to fuller trucks and a more efficient program.
Prepared by Daniel Huber New York City Independent Budget Office
The use of sick leave by municipal employees varies widely among agencies. Uniformed employees in the fire, correction, and sanitation departments tend to use sick leave at higher rates than other city workers. Some of the difference is attributable to the type of work done by uniformed staff and the greater likelihood of on-the-job injury. Another factor may be the unlimited sick time provided to uniformed city employees. Sick leave usage by uniformed employees is a key driver of city overtime spending—a set number of workers are needed, for example, for patrol cars or fire and sanitation trucks whether or not the regularly scheduled employees make it to work.
The recently released Mayor’s Management Report for Fiscal Year 2016 shows that uniformed police and fire personnel on average use sick leave unrelated to on-the-job injuries at a lower rate than their correction and sanitation department counterparts. Excluding days off for injuries on the job, police officers and firefighters also use sick leave less frequently than civilian employees. Still, firefighters are the most likely to be absent when factoring in leave that stems from work-related injuries.
Sizable shares of police officers and firefighters (48 percent and 31 percent, respectively) used no sick leave of any sort in 2016. An additional 6 percent of police officers and 26 percent of firefighters only took sick leave due to on-the job-injuries. Conversely, 92 percent of correction officers and 90 percent of sanitation workers used at least some amount of sick leave for reasons other than being hurt on the job.
In all four uniformed agencies, a small subset of personnel accounted for a disproportionate share of sick leave use not attributable to line-of-duty injury. The top 10 percent of uniformed personnel in terms of taking routine sick leave accounted for at least half of all sick leave use in their agencies. Each of the uniformed agencies monitors sick leave usage to minimize abuses. Uniformed personnel who are chronically absent may be subject to home visits to verify their condition and may also face the loss of certain discretionary benefits and privileges such as eligibility for assignment to special units or commands.
Prepared by Bernard O’Brien New York City Independent Budget Office
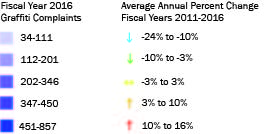
Graffiti-Free NYC is a city program that removes graffiti at no cost to the owners of residential, commercial, or industrial buildings. Anyone can report graffiti on any property by calling 311. The program is run jointly by the city’s Economic Development Corporation, Department of Sanitation, and the Community Affairs Unit of the Mayor’s office.
Since fiscal year 2011, Graffiti-Free NYC has received an average of 14,916 complaints a year. But the numbers of complaints citywide are declining, from 15,393 in 2011 to 13,415 in 2016.
In 2016, the heaviest concentrations of complaints were in Central and Southwest Brooklyn and in Lower Manhattan. Complaints have been largely down in the rest of the city since 2011, particularly in the South Bronx and Queens.
In 2011 through 2013 it took an average of 67 days from receipt of a graffiti complaint for Graffiti-Free NYC to send a team to clean the site. In 2014 and 2015 it took an average of 114 days for a response (data is not complete for 2016).
The increased response time may mean owners or neighbors are taking matters into their own hands. The percentage of complaints that resulted in graffiti removal has declined from 84 percent in 2011 to 62 percent in 2015 as cleaning crews responding to complaints increasingly find no graffiti at the reported location.
The budget for Graffiti-Free NYC from fiscal year 2011 through fiscal year 2016 has averaged $1.9 million annually, with the majority of the funding in recent years coming from a federal grant program. While the federal funding is no longer available, the Mayor has increased the city funding for the program to $2.5 million in 2017.
Prepared by Daniel Huber New York City Independent Budget Office
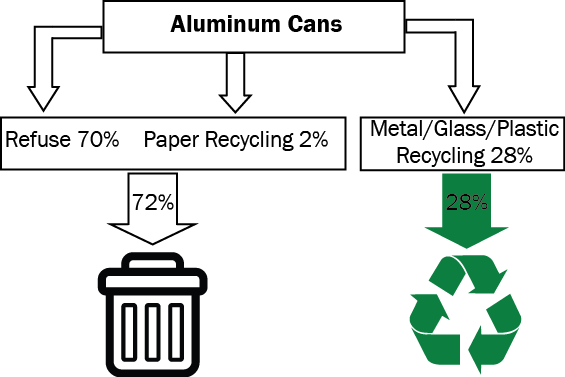
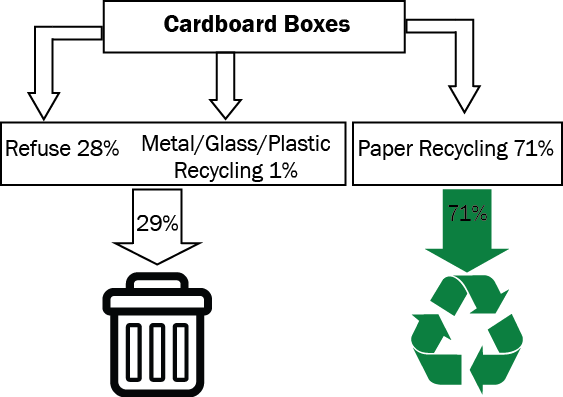
New York City recycles a wide variety of waste, but some materials are more likely to be recycled than others. The city has three solid waste streams: refuse, paper recycling, and metal/glass/plastic recycling. Overall, about 44 percent of recyclable material is “captured” by city recycling programs with the remainder sent to landfills, according to data from the Department of Sanitation’s 2013 Residential Waste Characterization Study. But a lot of recyclables are thrown in the wrong bins—aluminum cans, for example, tossed in with regular trash. As a result, the capture rate for each of the recyclable materials varies widely, from as low as 5 percent to as high as 75 percent. Material that ends up in the refuse stream or the wrong recycling stream is not recycled. In fact, such “contamination” makes recycling more expensive.
Only about 28 percent of aluminum cans collected by the Department of Sanitation are captured in the metal/glass/plastic stream.
This below-average rate may in part reflect the more frequent scavenging of cans from the city’s recycling bins than trash cans. This takes aluminum cans out of the recycling stream, but leaves them in the refuse stream and headed to landfills. Aluminum is one of the most valuable recycled metals providing greater incentives for scavenging.
Plastic dishware, which includes single use plastic cups, plates, and cutlery, has the lowest capture rate—only 5 percent of the material collected enters the recycling stream.
Plastic dishware is part of rigid plastics, which was added as a voluntary category for recycling in 2013—during the Waste Characterization Study period. It did not become a required recycling category until after the study ended. It can take years for recycling rates to rise as New Yorkers learn about items added to the list of recyclables.
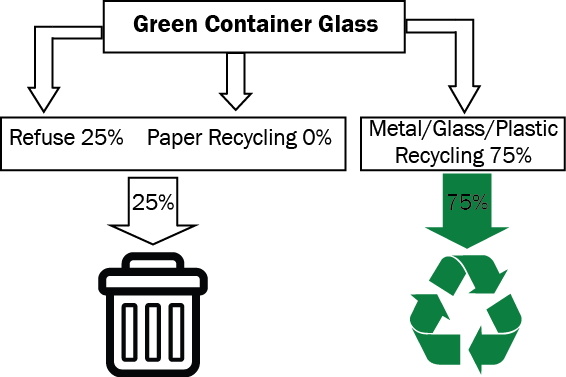
Green container glass has the highest capture rate of any material category, with 75 percent of this glass in the waste stream being recycled.
Glass has a long history of being recycled and public awareness is high, boosting the capture rate. Additionally, glass is not a valuable recycling commodity; only bottles that require a deposit have value outside the city waste stream.
Cardboard boxes and related paper products have one of the highest capture rates of any material, with 71 percent entering the paper recycling stream.
The city has a long and uninterrupted history of paper recycling. The high capture rate may also reflect the ease of recycling large foldable items like boxes.
Paper is the only material for which commodity prices exceed the cost of processing—meaning that New York City is paid to recycle paper.
Prepared by Daniel Huber New York City Independent Budget Office
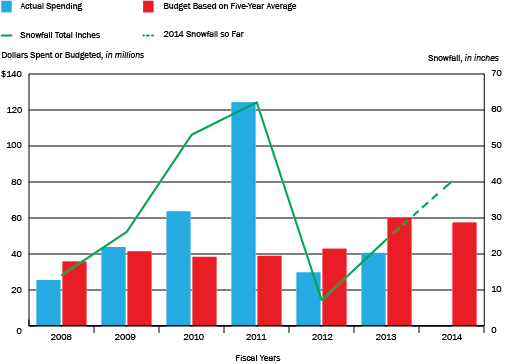
The amount the city budgets each year for snow removal is set by a formula in the City Charter. The formula is the average of spending on snow removal in the five prior years—so the budget for 2014 is based on the actual amounts spent in fiscal years 2008–2012.
In some years the formula provides more funding than is needed while in other years, such as 2011 when the city had an extraordinary amount of snow, the formula-driven budget fell $87 million short of need. The formula budgeted $13 million more in 2012 than the city needed for snow removal and $19 million more in 2013.
If there is unused funding in the snow budget, that money is reallocated or becomes part of the city’s end of year budget surplus. Conversely, if the budgeted amount is short of what is needed, funds are drawn from other parts of the city budget to cover the expense.