Category Archives: Health
Are the Number of Health Department Initial Inspections for Rats on the Rise?
Are NYC Health + Hospitals Facilities Located in Community Districts With the Highest Shares of Uninsured New Yorkers?
In January, Mayor de Blasio announced NYC Care, a city-funded NYC Health + Hospitals initiative expected to cost $100 million per year when fully implemented in fiscal year 2022. While the city’s public hospital system already provides care to anyone, regardless of ability to pay and immigration status, a key goal of the new initiative is to link the uninsured with a primary care provider—diverting patients from unnecessary emergency room visits for routine care. The program will also support efforts to boost enrollment of those who are eligible for the public health system’s MetroPlus insurance plan. There were about 615,000 uninsured New Yorkers in 2017, roughly 7 percent of the city’s population, according to the latest figures from the U.S. Census Bureau. Among city residents who were not U.S. citizens about 300,000, or nearly 22 percent, were uninsured—and the rate was likely even higher among noncitizens who were undocumented.
Because NYC Care relies on using NYC Health + Hospitals facilities, the success of the initiative is dependent in part on accessibility. Are the city’s more than 70 public hospitals and clinics located in neighborhoods with heavy concentrations of the uninsured? IBO has mapped the location of public hospital facilities and the share of uninsured in the city’s 59 community districts.
Where the Uninsured Reside and Location of Public Hospital System Facilities
- Some of the city’s community districts had particularly high shares of uninsured but little access to nearby public hospital facilities. Queens Community District 7, which includes the neighborhoods of Flushing, Murray Hill, and Whitestone, had an uninsured rate of 15.5 percent in 2017, the highest in the city. Yet there are no public hospital facilities in the district. Likewise, Brooklyn Community District 7 (Sunset Park and Windsor Terrace) had an uninsured rate of 12.4 percent and no public hospital facilities in proximity.
- Conversely, there were neighborhoods, such as Queens Community Districts 3 (Jackson Heights and North Corona) and 4 (Elmhurst and South Corona), with comparatively high shares of uninsured residents as well as nearby public hospital facilities. More than 14 percent of residents in Queens Community Districts 3 and 4 were without insurance.
- There also were neighborhoods with comparatively low rates of uninsured residents such as Manhattan’s Community District 3 (Chinatown and Lower East Side, 6.0 percent uninsured) and Community Districts 1 and 2 in the Bronx (Hunts Point, Longwood, and Melrose; 9.3 percent) served by a number of NYC Health + Hospitals facilities.
Prepared by Melinda Elias
New York City Independent Budget Office
Print version available here.
SOURCES: U.S. Census Bureau, American Community Survey 1-year estimates, 2017 for Public Use Microdata Areas (PUMA); NYC Health + Hospitals Facilities. NYC Open Data. Updated September 10, 2018.
NOTES: Certain community districts are combined under PUMA. These include Bronx Community Districts 1 & 2 and 3 & 6, as well as Manhattan Community Districts 1 & 2 and 4 & 5. Additionally, some NYC Health + Hospitals health centers may be located within the system’s hospital facilities.
Mayor’s Proposed Budget Seeks to Provide the Bronx with More Rapid EMS Response. Is Queens Even More in Need?
Is the Shift of Medicaid Enrollment into Managed Care Almost Complete?
Could City Employees Provide a Major Source of Enrollees for MetroPlus Gold?
Are New York City’s Public Hospitals Becoming the Main Provider of Inpatient Services for the Mentally Ill?
With Sexually Transmitted Disease Cases Rising in New York City, What Happened to Spending on Treatment and Prevention?
How Much Has the Affordable Care Act Reduced the Share of Uninsured Patients Treated by the City’s Public Hospitals?
With the full implementation of the Affordable Care Act, the share of adults in New York City without health insurance dropped from 20.9 percent in 2013 to 13.8 percent in 2014, a 7.1 percentage point decline. To gauge the effect on New York City Health + Hospitals, we focus on adult outpatient visits to H + H hospitals and diagnostic and treatment centers because some conditions that require inpatient stays, such as medical emergencies, allow for temporary Medicaid eligibility.
- Although the city’s public hospital system saw a reduction in the share of outpatient visits by uninsured adults, the decline was less steep—4.0 percentage points—than the city as a whole.
- In 2015, the share of H + H’s outpatient visits by uninsured adults (25.2 percent) was 11.4 percentage points greater than the share of uninsured adults in the general population.
- For both the city’s population and H + H’s patients, those adults who gained health insurance did so through Medicaid or commercial insurance in approximately equal proportions.
- Both the share of adult outpatient visits by uninsured patients and the impact of the Affordable Care Act on this share vary widely across H + H facilities.
- The hospital centers serving the largest shares of adult outpatients who are uninsured include Elmhurst, Queens, Bellevue, and Woodhull.
- Although each of these four hospital centers saw declines in the share of adults without insurance from 2013 through 2015, all of the decreases fell short of the reduction in the share of uninsured for the city as a whole. Woodhull saw by far the smallest decline, 1.8 percentage points.
Prepared by Erin Kelly
New York City Independent Budget Office
Print version available here.
SOURCES Department of Health & Mental Hygiene, New York City Community Health Survey, 2014. Health & Hospital Corporation Payor Mix Reports, September 2015 and September 2014, as reported to the Finance Committee.
NOTES: For the share of outpatient visits by uninsured adults at H + H facilities, pre-Affordable Care Act reflects fiscal year 2013 and post-Affordable Care Act reflects fiscal year 2015. For the share of New York City adults who are uninsured, pre-Affordable Care Act reflects calendar year 2013 and post Affordable Care Act reflect calendar year 2014, as reported by the Department of Health and Mental Hygiene Community Health Survey for those years. Coney Island Hospital is not included in the chart breaking out visits by facility because Hurricane Sandy had a lasting impact on the number of visits the hospital was able to provide in 2013 and 2014.
Does City Spending on Antismoking Efforts Affect Smoking Rates?
A recently released American Cancer Society annual report says that based on federal Centers for Disease Control and Prevention guidelines New York State failed to invest sufficient funds last fiscal year on antismoking efforts. IBO’s review of New York City’s own spending on antismoking programs finds that spending levels have varied widely in recent years—and that after trending downward the local adult smoking rate has been increasing.
In 2002, the city’s Department of Health and Mental Hygiene launched its tobacco control plan for reducing smoking among city residents. The plan included: hiking taxes on tobacco products; distributing cessation aids for current smokers; advocating for and enforcing antismoking legislation; and running public education campaigns on the consequences of tobacco use. Spending rose steeply in 2007, with the increase driven by advertising, media campaigns, and nicotine replacement therapies, rather than agency staffing. Tobacco control spending jumped again in 2008—reaching more than 10 times the 2001 level—even as spending on agency staff barely grew. A three-year decline in spending followed in 2009 through 2011, with all of the cuts coming from sources other than health department staff.
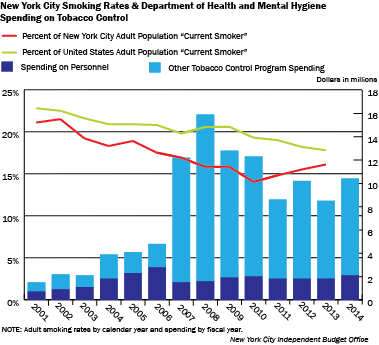
- The impact of the tobacco control plan on smoking behaviors occurs with a lag because of the time it takes individuals to cut back or quit—and particularly for spending programs, the time it takes to launch new initiatives.
- In calendar year 2002, the city and state each hiked their excise taxes on cigarettes to $1.50, for a total of $3.00 per pack. With additional state increases in 2008 and 2010, the combined state and local tax is now $5.85 per pack, plus an additional $1.01 per pack federal tax.
- The big increase in city spending on antismoking programs, along with the tax increases, have been credited with reducing the smoking rate in the city during a period when the U.S. smoking rate barely declined. In 2010, the city’s smoking rate fell to 14.0 percent, a 15-year low and 5.3 percentage points below the U.S. rate.
- After 2010, smoking rates in the city began to rise, reaching 16.1 percent in 2013 (the latest data available), just 1.7 percentage points below the U.S. rate. The increase in the city’s smoking rate occurred in tandem with declines in spending on tobacco control programs. City spending on antismoking campaigns in 2011-2014 averaged about a third less than during the 2007-2010 peak spending period.
- Health department officials have cited the decline in spending on tobacco control as a cause of the increase in the share of adults who smoke. With $5.0 million budgeted for tobacco control in the current fiscal year, less than half the amount spent in 2014, there is concern that the smoking rate could continue to rise.
Prepared by Erin Kelly
New York City Independent Budget Office
SOURCES: Department of Health and Mental Hygiene, Community Health Survey 2002-2013; Centers for Disease Control and Prevention, National Health Interview Survey, 2013
Print version available here.
| New York City By The Numbers |