To view in full screen, hover over the top right corner and click the screen icon.
Category Archives: Census Data
When New Yorkers Move Out of New York City Where Do They Go?
Destinations of Households Moving from New York City in 2012

Click on a state to see number and percent of households moving to that state.
Alaska 0.1% and Hawaii 0.2% of moving households
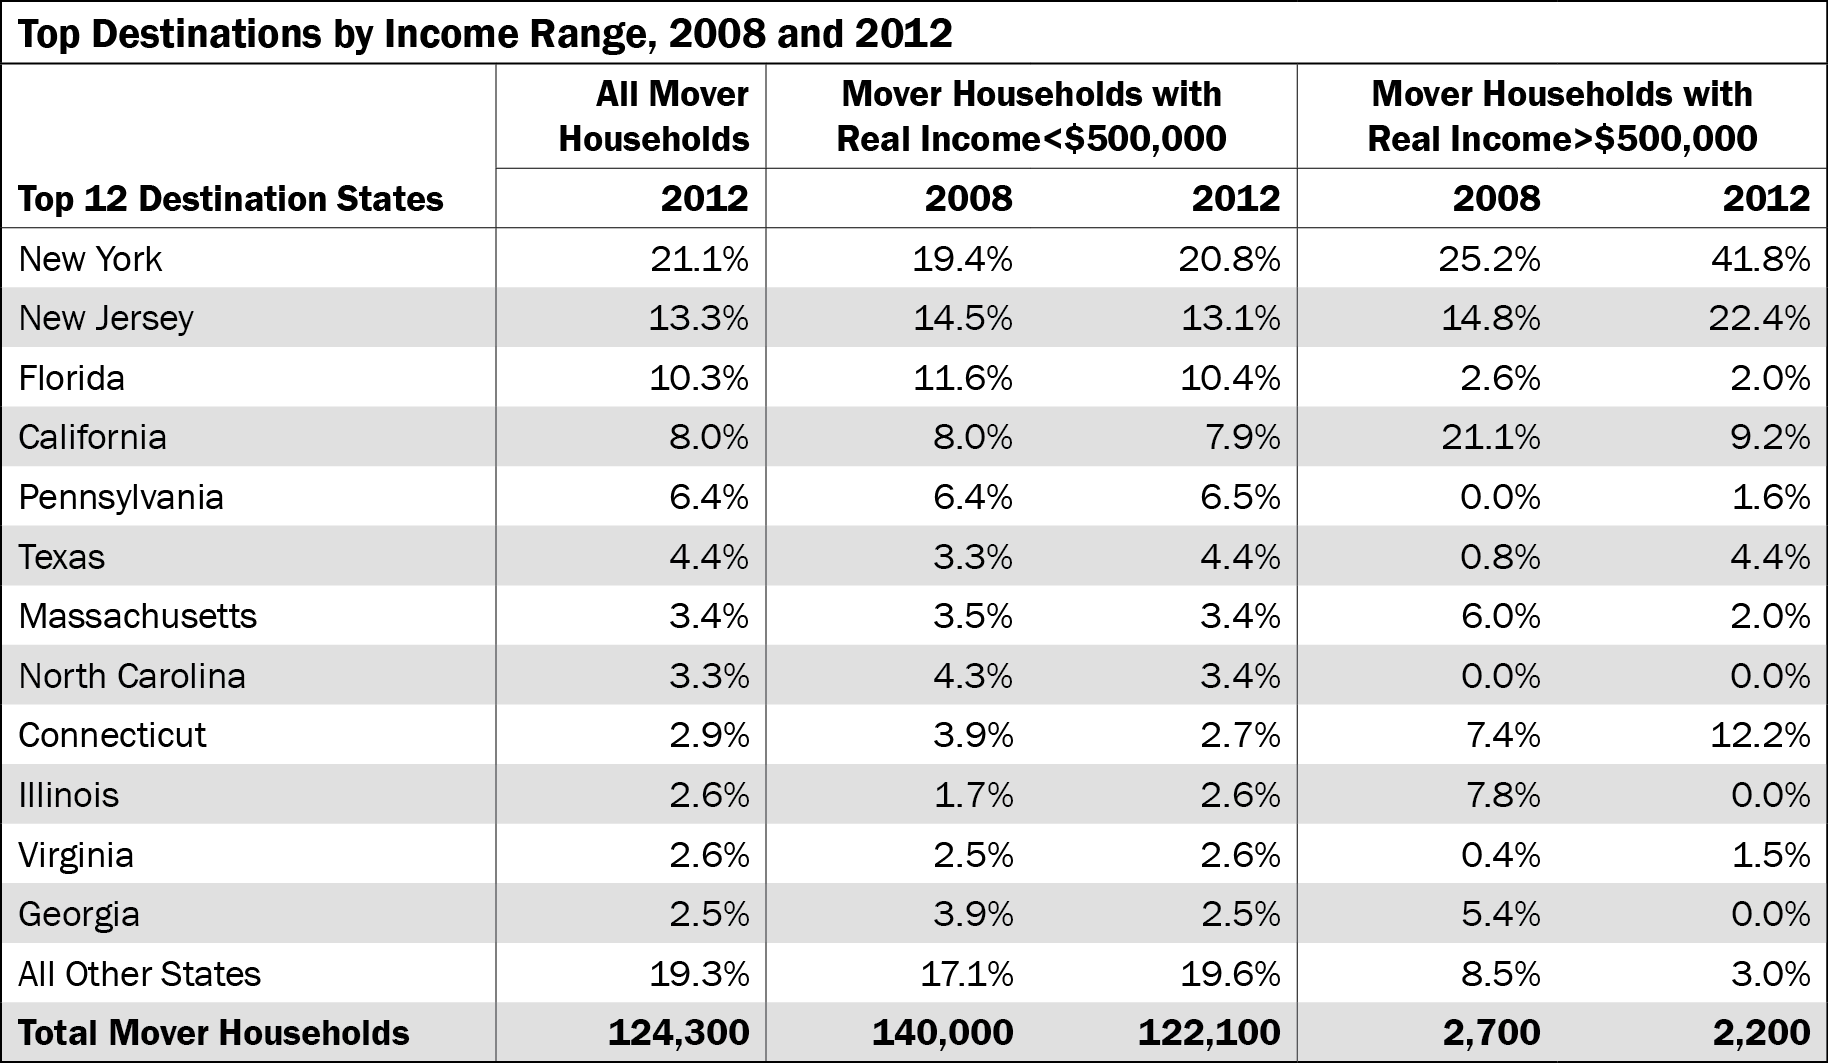
- Twenty-one percent of the households that moved out of New York City in 2012 moved within New York State—either to the city’s suburbs or further upstate. And almost 42 percent of high-income households moving out of New York City moved within the state in 2012.
- In second place was New Jersey—the destination of just over 13 percent of households moving out of New York City with incomes less than $500,000 and 22 percent of households with incomes over $500,000 in 2012.
- Florida was the destination of more than 10 percent of the households moving out of New York City in 2012, making it the third most popular destination. Given the state’s popularity among retirees, it is perhaps unsurprising that the share of high-income households relocating to Florida was relatively small—just 2 percent of those who moved in 2012.
- High-income New Yorkers were no more or less likely to move than other households in 2012. The share of high-income households that moved, 1.8 percent, was just equal to the share of city households with high incomes.
- The destinations of households moving out of New York City with incomes under $500,000 looked very similar when comparing 2008 and 2012. But the destination of high-income households looked quite different. In 2012, a higher proportion of moving households stayed relatively close to the city—New York, New Jersey and Connecticut—compared with 2008.
Prepared by Julie Anna M. Golebiewski
New York City Independent Budget Office
SOURCES: 2008 and 2012 three-year Public Use Microdata Sample data from the U.S. Census Bureau
NOTE: 2008 is a weighted sample of data from 2006 through 2008. Similalry, 2012 covers 2010 through 2012. Only households moving within the U.S. are shown.
Print version available here.
| New York City By The Numbers |