Destinations of Households Moving from New York City in 2012

Click on a state to see number and percent of households moving to that state.
Alaska 0.1% and Hawaii 0.2% of moving households
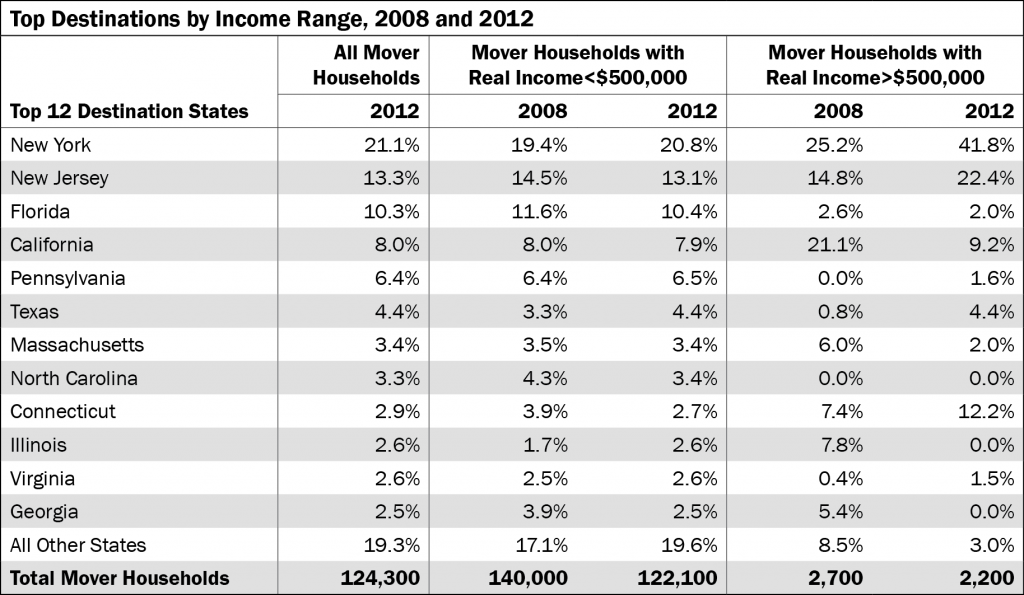
- Twenty-one percent of the households that moved out of New York City in 2012 moved within New York State—either to the city’s suburbs or further upstate. And almost 42 percent of high-income households moving out of New York City moved within the state in 2012.
- In second place was New Jersey—the destination of just over 13 percent of households moving out of New York City with incomes less than $500,000 and 22 percent of households with incomes over $500,000 in 2012.
- Florida was the destination of more than 10 percent of the households moving out of New York City in 2012, making it the third most popular destination. Given the state’s popularity among retirees, it is perhaps unsurprising that the share of high-income households relocating to Florida was relatively small—just 2 percent of those who moved in 2012.
- High-income New Yorkers were no more or less likely to move than other households in 2012. The share of high-income households that moved, 1.8 percent, was just equal to the share of city households with high incomes.
- The destinations of households moving out of New York City with incomes under $500,000 looked very similar when comparing 2008 and 2012. But the destination of high-income households looked quite different. In 2012, a higher proportion of moving households stayed relatively close to the city—New York, New Jersey and Connecticut—compared with 2008.
Prepared by Julie Anna M. Golebiewski
New York City Independent Budget Office
SOURCES: 2008 and 2012 three-year Public Use Microdata Sample data from the U.S. Census Bureau
NOTE: 2008 is a weighted sample of data from 2006 through 2008. Similalry, 2012 covers 2010 through 2012. Only households moving within the U.S. are shown.
Print version available here.
Preliminary data for fiscal year 2014 indicate the city received about $41 million in revenue from camera-generated red-light, bus-lane, and now speeding summonses, as well as $14 million in ticket revenue from traffic violations written up by police officers. The proportion of revenue generated by cameras rose from 38 percent in 1999 to 75 percent in 2014.
The budget for this fiscal year, 2015, assumes that revenues from these sources will total about $62 million. The jump (from about $2 million to $8 million) in anticipated revenue from camera-generated speeding summonses is attributable to Albany’s recent approval of an increase of 120 in the number of speed cameras to be installed in school zones across the city. Twenty speed cameras have been in use in the city since January 2014 as part of a pilot program approved last year by the state.
The jump from $24 million in 2007 to $45 milion in 2008 in revenue from red light camera summones followed a state-authorized increase in the number of cameras installed throughout the city. Revenue from red-light camera summonses also spiked in 2011 to $71 million as a result of a ruling that unpaid red light summonses (in addition to unpaid parking tickets) would count towards the $350 threshold for having your car towed for unpaid tickets. Many motorists were required to pay delinquent red light camera fines that year in order to reclaim their vehicles from the tow pound.
Prepared by Bernard O’Brien
New York City Independent Budget Office
SOURCES: Mayors’s Office of Management and Budget; Financial Management System
Print version available here.
- In 2002, Mayor Bloomberg urged that the Metropolitan Transportation Authority (MTA) take over the 82 express and local bus routes (most based in Queens) operated by seven private companies under franchise agreements that included city subsidies. He initially suggested that a takeover by the MTA could mean an end to city operating subsidies, which at that point totaled roughly $150 million to $175 million per year.
- After reaching an agreement in 2004, the MTA took over the last of the routes in 2006. Under the new arrangement, the city reimburses the MTA for any operating expenses not covered by fares or a small amount of taxes dedicated to the bus lines.
- Thanks in part to an influx of new buses, service has improved, but savings have not materialized. The city subsidy to MTA Bus—the subsidiary set up to run the lines—grew from $237 million in fiscal year 2008 to $393 million in 2013. The city’s payments to MTA Bus since 2008 have outpaced the growth in the operating budgets of both the city and the MTA’s other transit divisions.
- The city also pays rent to some of the companies that had run the buses for use of their depots at a cost of about $17 million in fiscal year 2013, up from $14 million in 2008.
Prepared by Alan Treffeisen
New York City Independent Budget Office
SOURCES: Metropolitan Transportation Authority Financial Plans; Mayor’s Office of Management and Budget; IBO Fiscal History, Revenue and Expenditure Summary
Print version available here.
New York City Independent Budget Office

