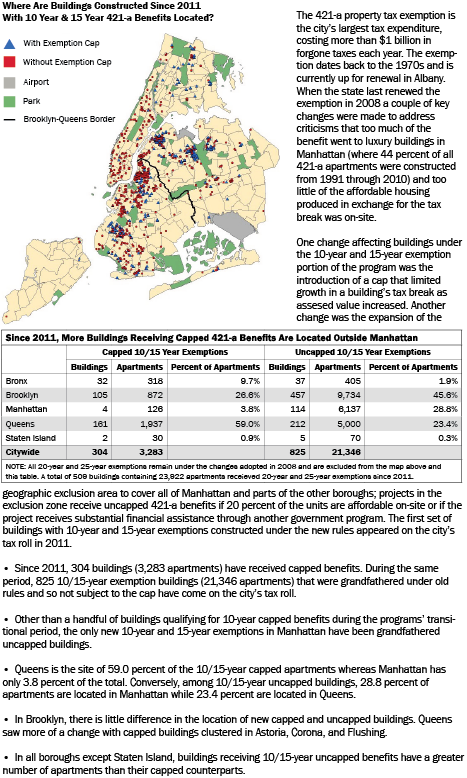
SOURCES: Analysis of Depart of Finance’s Real Property Assessment Database since 2011; Department of City Planning
Prepared by Geoffrey Propheter
New York City Independent Budget Office
Print version available here.
| New York City By The Numbers |
SOURCES: Analysis of Depart of Finance’s Real Property Assessment Database since 2011; Department of City Planning
Prepared by Geoffrey Propheter
New York City Independent Budget Office
Print version available here.
| New York City By The Numbers |
The city’s Department of Education runs nine specialized high schools that are among the most selective of the city’s public high schools. Eight schools admit students based solely on the score attained on the Specialized High Schools Admissions Test and admission to LaGuardia High School is based on an audition. All 8th graders and first-time 9th graders who are New York City residents are eligible to take the test. The score required for acceptance depends on the school and varies each year.
IBO used the address of each student attending a New York City public high school in the 2012-2013 school year to identify the census tract in which each student lived and the median household income for households residing in the tract. We then compared the median incomes of the neighborhoods where students lived who were attending the specialized high schools with those of students attending all other public high schools.
Prepared by Stephanie Kranes
New York City Independent Budget Office
Print version available here.
| New York City By The Numbers |
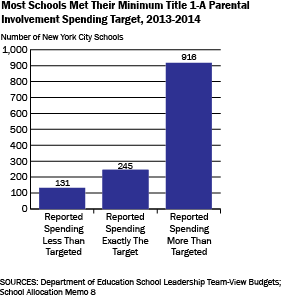
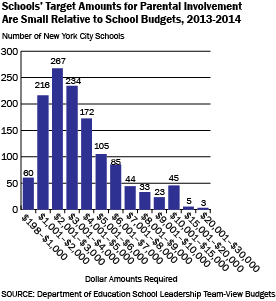
Federal Title I-A funds provide assistance to schools and local educational agencies (in New York City, the Department of Education) that serve a large number or share of students from low-income families. Under federal rules, school systems that receive at least $500,000 in Title I-A funds must use at least 1 percent of their annual allocation for activities that promote parental involvement. Title 1-A requires parental input into determining the activities provided as well as their implementation. Although schools also use additional sources to fund parental involvement, only Title 1-A requires that parents be involved in planning for the use of these funds.
Prepared by Liza Pappas & Yolanda Smith
New York City Independent Budget Office
Print version available here.
| New York City By The Numbers |
In October 2014, the city’s Human Resources Administration announced a new employment plan for public assistance recipients. The plan, which was already being phased in before the formal announcement, makes the agency’s employment programs less punitive and puts more emphasis on education and training. Some of the changes can already be seen by comparing participation data from December 2013 with December 2014.
Prepared by Paul Lopatto
New York City Independent Budget Office
SOURCE: Human Resources Administration, Weekly Caseload Engagement Status Reports for January 5, 2014 and January 4, 2015
NOTES: The numbers exclude cases categorized as indefinitely unengageable including child only cases, and those in which the household head is receiving Supplemental Security Income, is age 60 or over, or is receiving services from the HIV/AIDS Services Administration. They also exclude a small number of cases categorized as unengaged. Cases are classified by their primary activity.
Print version available here.
| New York City By The Numbers |
The city makes an annual payment to the Metropolitan Transportation Authority (MTA) to support the authority’s capital program. NYPIRG’s Straphangers Campaign asked IBO to review the annual contributions to see if they have kept pace with inflation.
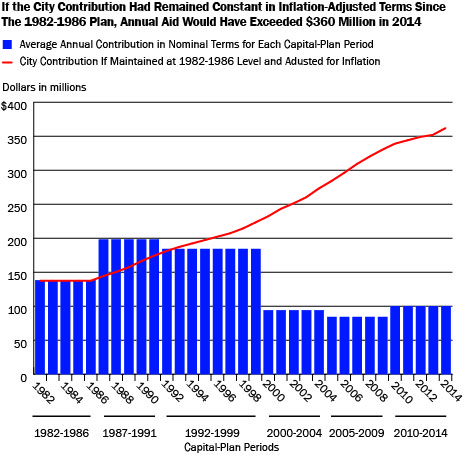
• The city’s contribution to the MTA’s first five-year capital plan (1982-1986) averaged $136 million a year. In nominal terms, the city’s contribution was highest during the 1987-1991 and 1992-1999 plans and has remained fairly constant at around $100 million per year since 2000.
• If the city had instead decided to keep its contribution at the 1982-1986 level in real (inflation-adjusted) terms, the contribution would have reached $363 million in 2014, and provide more than $1.8 billion for the proposed 2015-2019 capital plan.
• The city’s contribution to the MTA’s 1982-1986 capital plan averaged 1.2 percent of total city-funded expenses over the five-year period. Over time the city’s contribution as a share of total city-funded expenses has declined dramatically. The city’s contribution to the MTA capital plan in 2010-2014 averaged just 0.2 percent of total city-funded expenses a year.
New York City and state also provide indirect support to the capital program through dedicated tax revenue—in most cases, revenues predominately collected in the 12-county MTA region—that flow into the MTA’s operating budget. These revenues, which have grown substantially over the past three decades, are used to pay debt service on MTA bonds that finance capital projects as well as the operating expenses of the transit system. IBO estimates that New York City residents alone generated around $3.1 billion in city and state tax revenue for the MTA in 2014, compared with just $235 million in 1983.
Prepared by Alan Treffeisen
New York City Independent Budget Office
SOURCES: IBO analysis of data from the Metropolitan Transportation Authority, Moody’s Analytics, and the New York City Comptroller’s Office
NOTES: Inflation measured by the local government GDP deflator for the New York City metropolitan region. IBO compares the city’s contribution to the MTA on a calendar year basis to the city’s fiscal year expenditures.
Print version available here.
| New York City By The Numbers |
Print version available here.
Print version available here.
Print version available here.
Prepared by Paul Lopatto
New York City Independent Budget Office
Print version available here.
| New York City By The Numbers |