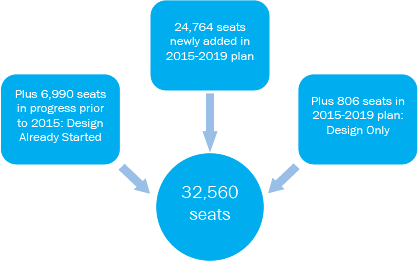
Under the recently adopted fiscal year 2015-2019 capital plan for schools, 62 percent of the 32,560 new seats will be completed within the five-year plan period, including projects that had been funded for design but not construction under the previous plan. Another 21 percent of the seats are expected to be completed in time for the 2020-2021 school year.
Including seats scheduled for completion after 2019-2020, design will begin for 79 percent of the new seats during the five-year plan period. Design for most of the other seats began during the preceding plan.
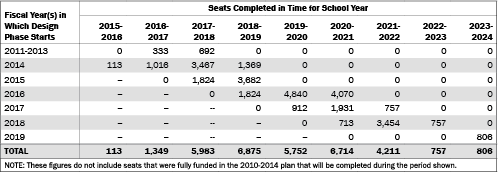
An average of 5,907 seats is expected to be completed each year from 2017-2018 through 2021-2022; over 95 percent of the new seats will be available by the start of the 2021-2022 school year.
The period from design to completion is typically expected to take from three to four years.
Prepared by Sarita Subramanian New York City Independent Budget Office
SOURCE: IBO analysis of Department of Education data
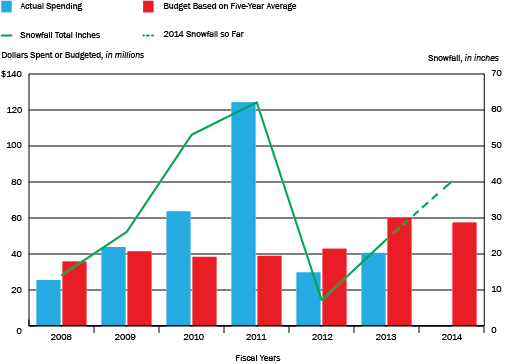
The amount the city budgets each year for snow removal is set by a formula in the City Charter. The formula is the average of spending on snow removal in the five prior years—so the budget for 2014 is based on the actual amounts spent in fiscal years 2008–2012.
In some years the formula provides more funding than is needed while in other years, such as 2011 when the city had an extraordinary amount of snow, the formula-driven budget fell $87 million short of need. The formula budgeted $13 million more in 2012 than the city needed for snow removal and $19 million more in 2013.
If there is unused funding in the snow budget, that money is reallocated or becomes part of the city’s end of year budget surplus. Conversely, if the budgeted amount is short of what is needed, funds are drawn from other parts of the city budget to cover the expense.