Over the past five years, total federal aid to New York City has declined from $7.9 billion in 2011 to just under $7.0 billion in 2015, a decrease of roughly $933 million, or nearly 12 percent. The change was mainly due to the drop in American Recovery and Reinvestment Act federal stimulus dollars.
But the picture changes when stimulus dollars and disaster recovery funding related to Hurricane Sandy and other events are excluded: Federal aid to the city has been relatively flat over the five-year period, although with some spikes in individual sources of aid. Excluding stimulus and disaster-related assistance, federal aid increased from $6.3 billion in 2011 to $6.7 billion in 2012, and then slowly declined to $6.3 billion in 2015. When adjusted for inflation, the $6.3 billion received in 2015 is 6.4 percent, or $403 million, below the aid received in 2011. Federal aid comprised less than 10 percent of the city budget last year.
- Federal aid, excluding stimulus and recovery funding, totaled $32.3 billion, or just over 85 percent of total federal aid received over the years 2011 through 2015.
- Three city agencies received a combined $22.5 billion, or roughly 70 percent, of federal aid during the five-year period: the Department of Education ($8.4 billion), Human Resources Administration ($7.7 billion), and Administration for Children’s Services ($6.4 billion).
- Three other departments, Housing Preservation and Development, Homeless Services, and Health and Mental Hygiene, also received a significant share of federal aid ($2.4 billion, $1.6 billion, and $1.6 billion, respectively) during the period.
Just five federal grant programs, excluding stimulus and disaster recovery funds, accounted for $16.8 billion, or over half, of the city’s aid from Washington.
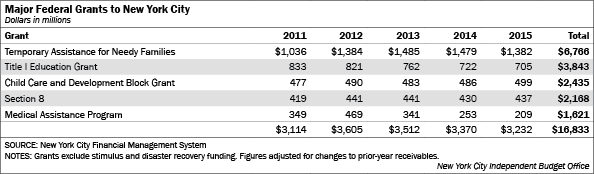
- The largest source of federal aid to the city is Temporary Assistance for Needy Families, which provides cash and other assistance to very low-income families. Funding to the city grew from $1.0 billion in 2011 to $1.5 billion in 2013 as the state, which receives the funds from Washington, changed the formula for allocating the funds to localities. Funding then declined to $1.4 billion in 2015.
- Title I funding, which supports special programs in schools with large concentrations of students from low-income families, decreased steadily over the five-year period and fell from $833 million in 2011 to $705 million in 2015, a decline of about 15 percent.
- Federal aid to the city through the Child Care and Development Block Grant, which subsidizes preschool and school-age child care programs for lower-income families, remained relatively flat over the five-year-period, rising $22 million, or roughtly 5 percent from 2011 through 2015.
- Section 8 funding, which provides rental assistance to low-income households, grew from $419 million in 2011 to $437 million in 2015, an increase of about 4 percent. (A separate Section 8 grant of about $1 billion annually goes to the New York City Housing Authority but does not flow through the city budget.)
- While most federal Medicaid spending in the city flows directly from the state to reimburse health care providers, some federal Medicaid dollars—such as support for school-based health centers—become part of the city budget. Medicaid funding in the city budget went from $349 million in 2011 to $209 million in 2015, a decline of 40 percent. The amount of federal Medicaid funds received by the city each year is partially determined by the number of claims the city files for reimbursement.
Prepared by Frank Posillico and Ana Maria Ventura
New York City Independent Budget Office
Print version available here.