Category Archives: Uncategorized

Is the City Spending at Least 1 Percent of Its Federal Title 1-A Funds on Parental Involvement?

Federal Title I-A funds provide assistance to schools and local educational agencies (in New York City, the Department of Education) that serve a large number or share of students from low-income families. Under federal rules, school systems that receive at least $500,000 in Title I-A funds must use at least 1 percent of their annual allocation for activities that promote parental involvement. Title 1-A requires parental input into determining the activities provided as well as their implementation. Although schools also use additional sources to fund parental involvement, only Title 1-A requires that parents be involved in planning for the use of these funds.

  • In school year 2013-2014, 1,292 schools (nearly 79 percent) of the city’s public schools received Title 1-A funds.
  • Schools receiving Title I-A funds collectively spent $11.2 million on parental involvement activities in 2013-2014—more than double the required minimum expenditure of $5.2 million for the Department of Education.

nycbtn421

  • The education department gives schools a targeted amount of 1 percent of their Title 1-A funds to spend on parental involvement in the department’s school budget allocations.
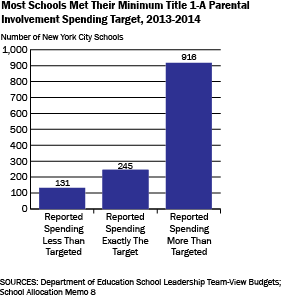
  • In school year 2013-2014, 10 percent of Title 1-A schools with parental involvement spending targets self-reported spending below the amount targeted and nearly 71 percent reported spending more than their assigned target amount.

nycbtn422

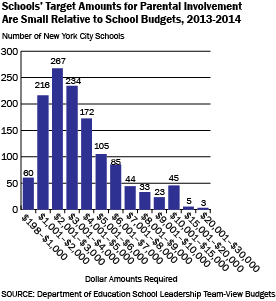
  • Nearly 70 percent of schools receiving Title I-A funds were targeted to spend between $1,000 and $5,000 for parental involvement.
  • For schools spending in this range, the expected expenditure equaled about 0.1-0.2 percent of an average school budget.
  • Lack of standardized reporting limits analysis by type of expenditure.

Prepared by Liza Pappas & Yolanda Smith
New York City Independent Budget Office

Print version available here.

New York City By The Numbers

IBO Homepage

The Public Assistance Caseload: More Job Training, Fewer Punitive Actions Under the de Blasio Administration?

In October 2014, the city’s Human Resources Administration announced a new employment plan for public assistance recipients. The plan, which was already being phased in before the formal announcement, makes the agency’s employment programs less punitive and puts more emphasis on education and training. Some of the changes can already be seen by comparing participation data from December 2013 with December 2014.

  • The number cash assistance cases under or facing sanctions for violating the employment requirements fell from 19,632 (19.6 percent of all cases) to 14,473 (13.6 percent).
  • Cases with the household head in an education, training ,or job search program increased from 3,347 (3.3 percent) to 5,485 (5.1 percent).
  • The number of cases classified as temporarily unengageable jumped from 9,119 (9.1 percent) to 19,823 (18.6 percent), primarily due to a big increase in the number of cases being evaluated for WeCARE, a program designed to help clients overcome medical and/or mental health barriers to employment.
  • The number participants in the long controversial Work Experience Program, which requires participants to work for their cash and food stamp benefits, also decreased somewhat from 10,661 (10.6 percent) to 9,786 (9.2 percent). The plan calls for gradually phasing out this program.

Prepared by Paul Lopatto
New York City Independent Budget Office

SOURCE: Human Resources Administration, Weekly Caseload Engagement Status Reports for January 5, 2014 and January 4, 2015
NOTES: The numbers exclude cases categorized as indefinitely unengageable including child only cases, and those in which the household head is receiving Supplemental Security Income, is age 60 or over, or is receiving services from the HIV/AIDS Services Administration. They also exclude a small number of cases categorized as unengaged. Cases are classified by their primary activity.

Print version available here.

New York City By The Numbers

IBO Homepage

How Much Would the City’s Annual Contribution Be Today If Aid for the Metropolitan Transportation Authority’s Capital Projects Had Kept Pace with Inflation?

The city makes an annual payment to the Metropolitan Transportation Authority (MTA) to support the authority’s capital program. NYPIRG’s Straphangers Campaign asked IBO to review the annual contributions to see if they have kept pace with inflation.

chart1btn40a

• The city’s contribution to the MTA’s first five-year capital plan (1982-1986) averaged $136 million a year. In nominal terms, the city’s contribution was highest during the 1987-1991 and 1992-1999 plans and has remained fairly constant at around $100 million per year since 2000.
• If the city had instead decided to keep its contribution at the 1982-1986 level in real (inflation-adjusted) terms, the contribution would have reached $363 million in 2014, and provide more than $1.8 billion for the proposed 2015-2019 capital plan.

• The city’s contribution to the MTA’s 1982-1986 capital plan averaged 1.2 percent of total city-funded expenses over the five-year period. Over time the city’s contribution as a share of total city-funded expenses has declined dramatically. The city’s contribution to the MTA capital plan in 2010-2014 averaged just 0.2 percent of total city-funded expenses a year.

New York City and state also provide indirect support to the capital program through dedicated tax revenue—in most cases, revenues predominately collected in the 12-county MTA region—that flow into the MTA’s operating budget. These revenues, which have grown substantially over the past three decades, are used to pay debt service on MTA bonds that finance capital projects as well as the operating expenses of the transit system. IBO estimates that New York City residents alone generated around $3.1 billion in city and state tax revenue for the MTA in 2014, compared with just $235 million in 1983.

Prepared by Alan Treffeisen
New York City Independent Budget Office

SOURCES: IBO analysis of data from the Metropolitan Transportation Authority, Moody’s Analytics, and the New York City Comptroller’s Office
NOTES: Inflation measured by the local government GDP deflator for the New York City metropolitan region. IBO compares the city’s contribution to the MTA on a calendar year basis to the city’s fiscal year expenditures.


Print version available here.

New York City By The Numbers

IBO Homepage

How Has the City’s Budget for Public Education Changed Since 2000?

Has the Long-Term Increase in Food Stamp Usage Finally Come to an End?


nycbtn35chart

  • From June 2006 through June 2013, the number of New York City residents receiving food stamps (now known as the Supplemental Nutrition Assistance Program, or SNAP) increased by 71.1 percent, from 1.1 million to 1.9 million. From June 2013 through June 2014, however, the number of recipients fell by 118,000, or 6.3 percent.
  • Recent decreases in the number of food stamp recipients likely reflect improvements in the local labor market.
    Nationwide, over the same June 2013-June 2014 period, the number of individuals receiving food stamps fell by a more modest 2.6 percent.
  • As a result of the decreased caseload as well as federal reductions in per family grant payments beginning in November 2013, total food stamp grants to city residents decreased by $244 million, or 6.9 percent, from fiscal year 2013 to 2014.


Prepared by Paul Lopatto
New York City Independent Budget Office

SOURCES: IBO analysis of data from the New York City Human Resources Administration, the New York State Office of Temporary and Disability Assistance, and the United States Department of Agriculture

Print version available here.

New York City By The Numbers

IBO Homepage


Is There Another Way to Tally City Budget Surpluses?


Print version available here.

New York City By The Numbers

IBO Homepage

The City’s 2015-2019 Capital Plan for Public Schools: How Many New Seats & When Will They Be Ready?

chartnycbtn33


Timeline for Design Start and Estimated

Completion of New Capacity Seats

tablenycbtn33

  • Under the recently adopted fiscal year 2015-2019 capital plan for schools, 62 percent of the 32,560 new seats will be completed within the five-year plan period, including projects that had been funded for design but not construction under the previous plan. Another 21 percent of the seats are expected to be completed in time for the 2020-2021 school year.
  • Including seats scheduled for completion after 2019-2020, design will begin for 79 percent of the new seats during the five-year plan period. Design for most of the other seats began during the preceding plan.
  • An average of 5,907 seats is expected to be completed each year from 2017-2018 through 2021-2022; over 95 percent of the new seats will be available by the start of the 2021-2022 school year.
  • The period from design to completion is typically expected to take from three to four years.

Prepared by Sarita Subramanian
New York City Independent Budget Office

SOURCE: IBO analysis of Department of Education data

Print version available here.

New York City By The Numbers

IBO Homepage