Destinations of Households Moving from New York City in 2012
Click on a state to see number and percent of households moving to that state.
Alaska 0.1% and Hawaii 0.2% of moving households
Twenty-one percent of the households that moved out of New York City in 2012 moved within New York State—either to the city’s suburbs or further upstate. And almost 42 percent of high-income households moving out of New York City moved within the state in 2012.
In second place was New Jersey—the destination of just over 13 percent of households moving out of New York City with incomes less than $500,000 and 22 percent of households with incomes over $500,000 in 2012.
Florida was the destination of more than 10 percent of the households moving out of New York City in 2012, making it the third most popular destination. Given the state’s popularity among retirees, it is perhaps unsurprising that the share of high-income households relocating to Florida was relatively small—just 2 percent of those who moved in 2012.
High-income New Yorkers were no more or less likely to move than other households in 2012. The share of high-income households that moved, 1.8 percent, was just equal to the share of city households with high incomes.
The destinations of households moving out of New York City with incomes under $500,000 looked very similar when comparing 2008 and 2012. But the destination of high-income households looked quite different. In 2012, a higher proportion of moving households stayed relatively close to the city—New York, New Jersey and Connecticut—compared with 2008.
Prepared by Julie Anna M. Golebiewski New York City Independent Budget Office
SOURCES: 2008 and 2012 three-year Public Use Microdata Sample data from the U.S. Census Bureau
NOTE: 2008 is a weighted sample of data from 2006 through 2008. Similalry, 2012 covers 2010 through 2012. Only households moving within the U.S. are shown.
Preliminary data for fiscal year 2014 indicate the city received about $41 million in revenue from camera-generated red-light, bus-lane, and now speeding summonses, as well as $14 million in ticket revenue from traffic violations written up by police officers. The proportion of revenue generated by cameras rose from 38 percent in 1999 to 75 percent in 2014.
The budget for this fiscal year, 2015, assumes that revenues from these sources will total about $62 million. The jump (from about $2 million to $8 million) in anticipated revenue from camera-generated speeding summonses is attributable to Albany’s recent approval of an increase of 120 in the number of speed cameras to be installed in school zones across the city. Twenty speed cameras have been in use in the city since January 2014 as part of a pilot program approved last year by the state.
The jump from $24 million in 2007 to $45 milion in 2008 in revenue from red light camera summones followed a state-authorized increase in the number of cameras installed throughout the city. Revenue from red-light camera summonses also spiked in 2011 to $71 million as a result of a ruling that unpaid red light summonses (in addition to unpaid parking tickets) would count towards the $350 threshold for having your car towed for unpaid tickets. Many motorists were required to pay delinquent red light camera fines that year in order to reclaim their vehicles from the tow pound.
Prepared by Bernard O’Brien New York City Independent Budget Office
SOURCES: Mayors’s Office of Management and Budget; Financial Management System
In 2002, Mayor Bloomberg urged that the Metropolitan Transportation Authority (MTA) take over the 82 express and local bus routes (most based in Queens) operated by seven private companies under franchise agreements that included city subsidies. He initially suggested that a takeover by the MTA could mean an end to city operating subsidies, which at that point totaled roughly $150 million to $175 million per year.
After reaching an agreement in 2004, the MTA took over the last of the routes in 2006. Under the new arrangement, the city reimburses the MTA for any operating expenses not covered by fares or a small amount of taxes dedicated to the bus lines.
Thanks in part to an influx of new buses, service has improved, but savings have not materialized. The city subsidy to MTA Bus—the subsidiary set up to run the lines—grew from $237 million in fiscal year 2008 to $393 million in 2013. The city’s payments to MTA Bus since 2008 have outpaced the growth in the operating budgets of both the city and the MTA’s other transit divisions.
The city also pays rent to some of the companies that had run the buses for use of their depots at a cost of about $17 million in fiscal year 2013, up from $14 million in 2008.
Prepared by Alan Treffeisen New York City Independent Budget Office
SOURCES: Metropolitan Transportation Authority Financial Plans; Mayor’s Office of Management and Budget; IBO Fiscal History, Revenue and Expenditure Summary
Citywide, the average high school student’s commute to school—by subway, bus, or foot—in school year 2011-2012 was estimated to take 32 minutes. In comparison, the commutes for city residents to jobs in the five boroughs averaged 39 minutes in 2012.
More than 1 in 5 high school students had commutes of 45 minutes or longer.
There was significant variation across census tracts in the share of students with longer commutes, reflecting both access to transit and school choice preferences.
The city’s Department of Education allows “hardship transfers” for high school students with commutes of more than 75 minutes. Less than 3 percent of high school students had commutes that long in school year 2011-2012.
The Geography of Student Commutes Longer Than 45 Minutes to School, School Year 2011-2012
Prepared by Asa Wilks New York City Independent Budget Office
SOURCES: IBO analysis of Department of Education Data, American Community Survey
NOTES: Calculations based on GoogleMaps estimate of trip times as of January and February 2014 between each student’s home and school address. Calculations reflect commuting time during business hours for students attending New York City high schools during the 2011-2012 school year. Trip duration includes walking time.
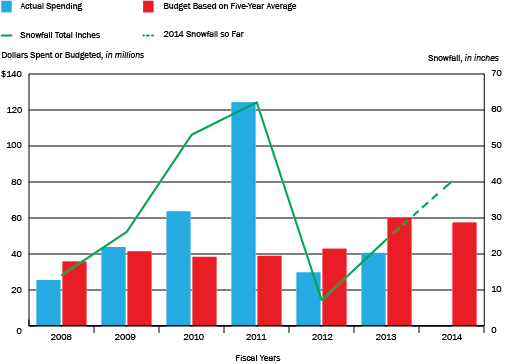
The amount the city budgets each year for snow removal is set by a formula in the City Charter. The formula is the average of spending on snow removal in the five prior years—so the budget for 2014 is based on the actual amounts spent in fiscal years 2008–2012.
In some years the formula provides more funding than is needed while in other years, such as 2011 when the city had an extraordinary amount of snow, the formula-driven budget fell $87 million short of need. The formula budgeted $13 million more in 2012 than the city needed for snow removal and $19 million more in 2013.
If there is unused funding in the snow budget, that money is reallocated or becomes part of the city’s end of year budget surplus. Conversely, if the budgeted amount is short of what is needed, funds are drawn from other parts of the city budget to cover the expense.
When Mayor Bloomberg presented his last budget plan in November, he noted that the city’s full-time and full-time equivalent headcount had fallen by 15,368 since December 31, 2001. But looking at staffing levels since the end of fiscal year 2002, which marks the beginning of Mayor Bloomberg’s first full-year budget, the numbers are somewhat different.
From June 30, 2002 through June 30, 2013, city staffing decreased by 9,028 positions and totaled 295,894 by the end of fiscal year 2013, a 3.0 percent decline.
For many agencies, there was little change in staffing from June 30, 2002.
Two areas of the budget accounted for the largest decrease in staffing, the education department and uniformed services.
The largest decrease—4,607 positions—occurred in uniformed services, including 1,986 police officers (a decline of 5.4 percent), 1,141 fire fighters (10.1 percent) and 1,645 correction officers (15.5 percent).
The education department saw a decrease of 4,496 positions (3.3 percent), of which 2,528 were teachers and professional staff.