All posts by admin
How Have New Yorkers Changed the Ways They Use the City’s Libraries in Recent Years?
Print version available here.
How Does Sick Leave Usage Vary Across the City’s Workforce?
The use of sick leave by municipal employees varies widely among agencies. Uniformed employees in the fire, correction, and sanitation departments tend to use sick leave at higher rates than other city workers. Some of the difference is attributable to the type of work done by uniformed staff and the greater likelihood of on-the-job injury. Another factor may be the unlimited sick time provided to uniformed city employees. Sick leave usage by uniformed employees is a key driver of city overtime spending—a set number of workers are needed, for example, for patrol cars or fire and sanitation trucks whether or not the regularly scheduled employees make it to work.
- The recently released Mayor’s Management Report for Fiscal Year 2016 shows that uniformed police and fire personnel on average use sick leave unrelated to on-the-job injuries at a lower rate than their correction and sanitation department counterparts. Excluding days off for injuries on the job, police officers and firefighters also use sick leave less frequently than civilian employees. Still, firefighters are the most likely to be absent when factoring in leave that stems from work-related injuries.
- Sizable shares of police officers and firefighters (48 percent and 31 percent, respectively) used no sick leave of any sort in 2016. An additional 6 percent of police officers and 26 percent of firefighters only took sick leave due to on-the job-injuries. Conversely, 92 percent of correction officers and 90 percent of sanitation workers used at least some amount of sick leave for reasons other than being hurt on the job.
- In all four uniformed agencies, a small subset of personnel accounted for a disproportionate share of sick leave use not attributable to line-of-duty injury. The top 10 percent of uniformed personnel in terms of taking routine sick leave accounted for at least half of all sick leave use in their agencies. Each of the uniformed agencies monitors sick leave usage to minimize abuses. Uniformed personnel who are chronically absent may be subject to home visits to verify their condition and may also face the loss of certain discretionary benefits and privileges such as eligibility for assignment to special units or commands.
Prepared by Bernard O’Brien
New York City Independent Budget Office
Print version available here.
| New York City By The Numbers |
How Much Do Yesterday’s 421-a Tax Exemptions Cost Us Today?
When representatives of the real estate industry and construction unions failed to reach an agreement over wages in January, the 421-a tax benefit program came to a halt for the construction of new multifamily housing. This meant the program, which provided property tax exemptions with benefit periods ranging from 10 to 25 years depending on when and where a building was constructed, was no longer available for new projects. But just because the program was suspended does not mean the city is off the hook for previously granted tax breaks. In 2017, the current fiscal year, the city will forego $1.4 billion in property tax revenue due to exemptions granted in prior years—in some instances two decades ago. The last of the properties awarded 421-a benefits before the program’s suspension are not expected to fully return to the property tax roll until 2044.
While state and local policymakers are seeking ways to resuscitate the program or create a new variation, IBO has tracked how long ago the exemptions that result in tax expenditures in a given year were granted.
- The overwhelming majority of 421-a tax expenditures in any given year are for properties that have been awarded benefits in prior years. Since fiscal year 1998, only 16 percent of the total tax expenditure awarded each year on average is attributable to newly exempted properties.
- For the 2017 tax roll, $94.2 million in new 421-a tax expenditures were added, the largest volume increase since 2013 and $14.2 million greater than the 20-year average.
- Of the 2017 tax expenditure, $547.5 million is due to exemptions that started in fiscal years 2007 through 2011, the latter being the year with the most-new exemptions granted (in nominal terms) in the history of the program.
- Buildings that started construction after 2008 are subject to a cap on the amount of value exempted regardless of appreciation. However, for older buildings the value of the exemption can continue to grow as properties appreciate. This results in an increasing share of the tax revenue in recent years coming from exemptions that were granted more than 10 years ago. In recent fiscal years there has also been some shift in the share granted 1 to 5 years earlier to the the share granted 6 to 10 years earlier as the bulge in exemptions granted in 2010 through 2012 age.
Prepared by Geoffrey Propheter
New York City Independent Budget Office
Print version available here.
SOURCE: Department of Finance
| New York City By The Numbers |
Which Sections of the City Generate the Most & Least Complaints to Graffiti-Free NYC?
Graffiti-Free NYC is a city program that removes graffiti at no cost to the owners of residential, commercial, or industrial buildings. Anyone can report graffiti on any property by calling 311. The program is run jointly by the city’s Economic Development Corporation, Department of Sanitation, and the Community Affairs Unit of the Mayor’s office.
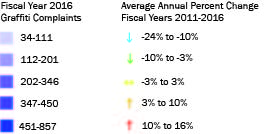
- Since fiscal year 2011, Graffiti-Free NYC has received an average of 14,916 complaints a year. But the numbers of complaints citywide are declining, from 15,393 in 2011 to 13,415 in 2016.
- In 2016, the heaviest concentrations of complaints were in Central and Southwest Brooklyn and in Lower Manhattan. Complaints have been largely down in the rest of the city since 2011, particularly in the South Bronx and Queens.
- In 2011 through 2013 it took an average of 67 days from receipt of a graffiti complaint for Graffiti-Free NYC to send a team to clean the site. In 2014 and 2015 it took an average of 114 days for a response (data is not complete for 2016).
- The increased response time may mean owners or neighbors are taking matters into their own hands. The percentage of complaints that resulted in graffiti removal has declined from 84 percent in 2011 to 62 percent in 2015 as cleaning crews responding to complaints increasingly find no graffiti at the reported location.
- The budget for Graffiti-Free NYC from fiscal year 2011 through fiscal year 2016 has averaged $1.9 million annually, with the majority of the funding in recent years coming from a federal grant program. While the federal funding is no longer available, the Mayor has increased the city funding for the program to $2.5 million in 2017.
Prepared by Daniel Huber
New York City Independent Budget Office
Print version available here.
SOURCE: IBO analysis of Department of Sanitation data
NOTE: Map divisions are based on City Council districts.
| New York City By The Numbers |
Does Firm Size Matter When It Comes to Wage Levels and Employment Shares?
The Quarterly Census of Employment and Wages data produced by the New York State Department of Labor shows that there are 226,900 private firms in New York City with about 3.8 million workers on their payrolls. IBO has grouped these establishments into four categories based on the number of workers they employ to look at how sector and wage profiles differ among firms of different sizes.
| Employment and Wages by Business Size, 2013 | |||
| Establishments | Employment | Total Wages | |
| Very Small Businesses (<20 Employees) |
88.3% | 22.3% | 14.4% |
| Small Businesses (20-99 Employees) | 9.6% | 22.8% | 20.5% |
| Medium Businesses (100-499 Employees) | 1.8% | 21.0% | 23.9% |
| Large Businesses (≥500 Employees) | 0.3% | 33.9% | 41.2% |
| New York City Independent Budget Office | |||
- A vast majority (88 percent) of businesses in the city employ less than 20 workers, while businesses employing 100 or more workers account for only 2 percent of all establishments.
- Large businesses employ over one-third of all workers, with the remaining employees almost equally distributed across very small, small, and medium-size businesses.
IBO also classified businesses by their average hourly wages and industrial sector. By grouping businesses by average wages (low, medium, and high) and firm size (very small, small, medium, and large), we can see how closely their shares of employment and wages match.
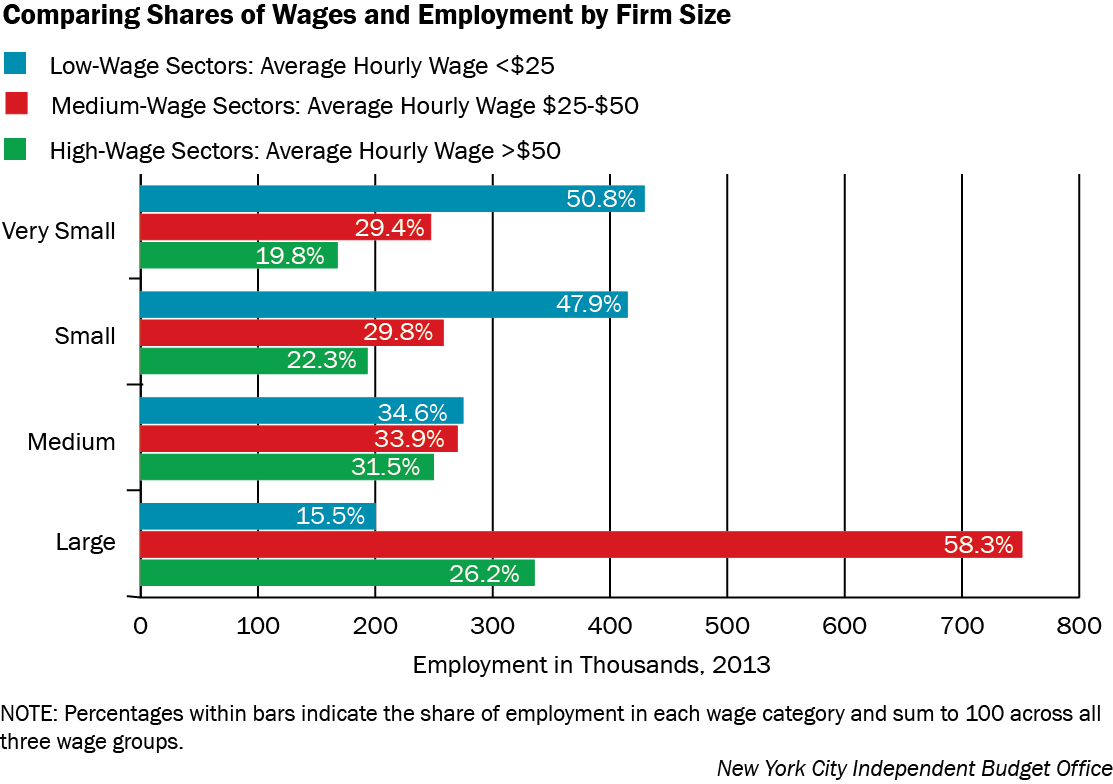
- Very Small businesses have a relatively small share of total wages (14 percent) compared with their share of employment (22 percent). Just over half of the 844,000 workers in these very small firms (51 percent) are employed in low-wage industries. This includes 182,000 who work in wholesale and retail trade. An additional 113,000 work in leisure and hospitality and 91,000 more are employed in other services.
- In contrast, the share of wages paid by the city’s small businesses (21 percent) is much closer to these firms’ share of total employment (23 percent). Almost half of the 866,000 employees of small businesses work in low-wage industries such as leisure and hospitality (165,000 workers) and trade (150,000).
- Medium-size businesses employ 795,000 workers and their wages are almost evenly divided among low-, medium-, and high-wage sectors. Employees in high-wage industries—including professional and business services, which employs 126,000 workers—receive about 60 percent of all wages paid by medium-size firms.
- Of the 1.3 million employees of the city’s large businesses, 264,000 work in the high-wage professional and business services and financial services industries. Two low-wage industries in the large establishment category—trade and leisure and hospitality—employ 200,000 workers. Roughly half of all workers in large firms are employed in education and health services, which are medium-wage industries.
Prepared by Debipriya Chatterjee
New York City Independent Budget Office
Print version available here.
SOURCES: IBO calculations of Quarterly Census of Employment and Wages data provided by New York State Department of Labor
| New York City By The Numbers |
How Much of the City’s Curbside Recyclables Get Properly Recycled?
New York City recycles a wide variety of waste, but some materials are more likely to be recycled than others. The city has three solid waste streams: refuse, paper recycling, and metal/glass/plastic recycling. Overall, about 44 percent of recyclable material is “captured” by city recycling programs with the remainder sent to landfills, according to data from the Department of Sanitation’s 2013 Residential Waste Characterization Study. But a lot of recyclables are thrown in the wrong bins—aluminum cans, for example, tossed in with regular trash. As a result, the capture rate for each of the recyclable materials varies widely, from as low as 5 percent to as high as 75 percent. Material that ends up in the refuse stream or the wrong recycling stream is not recycled. In fact, such “contamination” makes recycling more expensive.
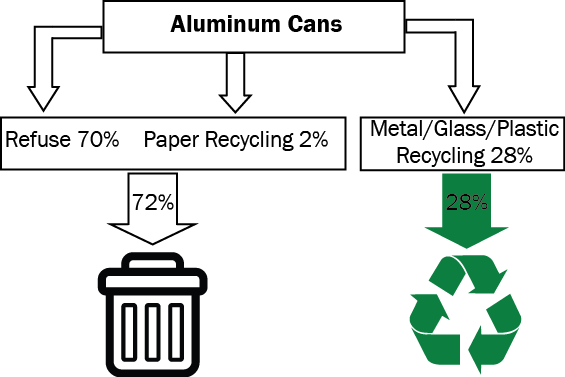
- Only about 28 percent of aluminum cans collected by the Department of Sanitation are captured in the metal/glass/plastic stream.
- This below-average rate may in part reflect the more frequent scavenging of cans from the city’s recycling bins than trash cans. This takes aluminum cans out of the recycling stream, but leaves them in the refuse stream and headed to landfills. Aluminum is one of the most valuable recycled metals providing greater incentives for scavenging.

- Plastic dishware, which includes single use plastic cups, plates, and cutlery, has the lowest capture rate—only 5 percent of the material collected enters the recycling stream.
- Plastic dishware is part of rigid plastics, which was added as a voluntary category for recycling in 2013—during the Waste Characterization Study period. It did not become a required recycling category until after the study ended. It can take years for recycling rates to rise as New Yorkers learn about items added to the list of recyclables.
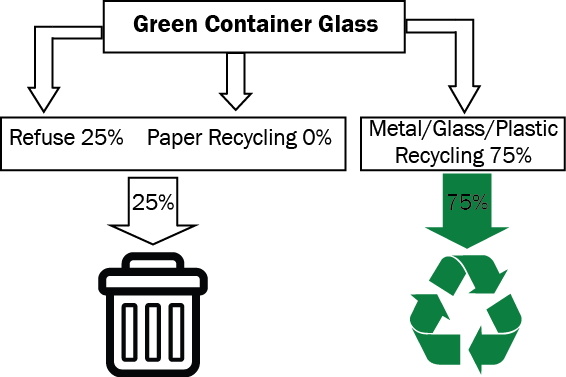
- Green container glass has the highest capture rate of any material category, with 75 percent of this glass in the waste stream being recycled.
- Glass has a long history of being recycled and public awareness is high, boosting the capture rate. Additionally, glass is not a valuable recycling commodity; only bottles that require a deposit have value outside the city waste stream.
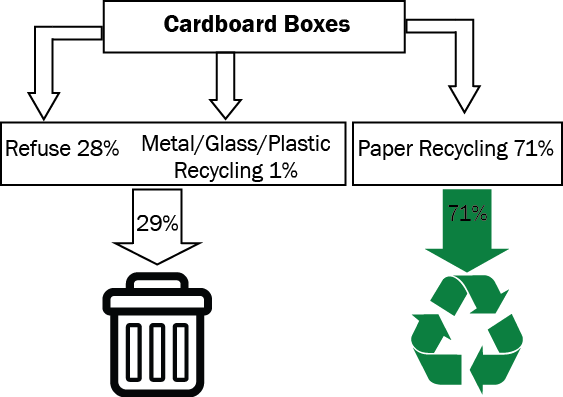
- Cardboard boxes and related paper products have one of the highest capture rates of any material, with 71 percent entering the paper recycling stream.
- The city has a long and uninterrupted history of paper recycling. The high capture rate may also reflect the ease of recycling large foldable items like boxes.
- Paper is the only material for which commodity prices exceed the cost of processing—meaning that New York City is paid to recycle paper.
Prepared by Daniel Huber
New York City Independent Budget Office
Print version available here.
SOURCES: New York City 2013 Residential Waste Characterization Study
| New York City By The Numbers |
Has the City’s Expansion of Alternative-to-Placement Programs Reduced the Share of Juvenile Delinquents Confined to Residential Facilities?
In September 2012, New York City launched a set of juvenile justice initiatives that included the expansion of alternative-to-placement programs for youth ages 7-15 found by Family Court to be juvenile delinquents. Some youth who are arrested have their cases diverted before even reaching the court. But for youth found guilty in a Family Court hearing, a judge issues a dispositional order determining the next step—which can range from conditional discharge to probation to confinement in a residential facility. Under the 2012 initiatives, more relatively low-risk youth who would have been sent to a residential facility would instead remain at home where they and their families would participate in a range of therapeutic programs.
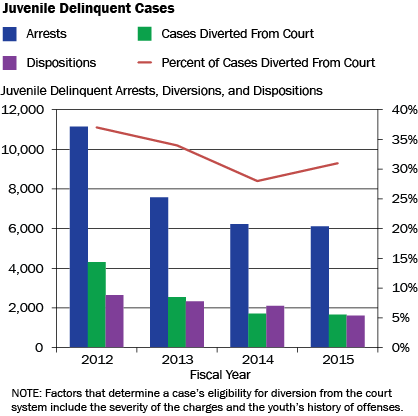
- There has been a sharp decrease in juvenile delinquent arrests beginning just before the reforms began, from 11,144 in fiscal year 2012 to 6,111 in 2015—a 45.2 percent decline. As a result, some decrease in placements due solely to the falling arrest rate is to be expected.
- The drop in arrests may result from the police department’s de-emphasis of arrests for low-level offenses. The decline in the share of cases being diverted—from 37.0 percent of intake cases in 2012 to 31.0 percent in 2015—supports this conjecture because the more serious the offense the less likely it would be diverted.
- The number of cases reaching the disposition stage dropped at a slower rate than arrests, decreasing by 39.2 percent from 2012 through 2015. This is likely due in part to the decrease in the share of cases diverted from court.
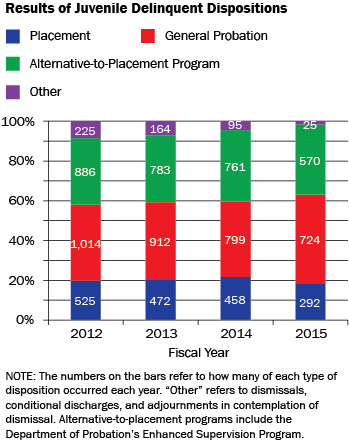
- The number of annual placements in residential facilities has decreased since 2012, the fiscal year before the reforms were implemented—from 525 to 292 in 2015. A more meaningful statistic, however, is the share of dispositions resulting in placements, which has fallen from 19.8 percent in 2012 to 18.1 percent in 2015, a 1.7 percentage point decline.
- The percentage of youths assigned to alternative programs in their homes has increased 2.0 percentage points, from 33.4 percent in 2012 to 35.4 percent in 2015.
- Overall, expanding the city’s alternative-to-placement options has so far led to only a relatively modest reduction in the share of youth assigned to home-based, family-focused programs rather than to incarceration in residential facilities.
Prepared by Katie Hanna
New York City Independent Budget Office
Print version available here.
SOURCES: Mayor’s Management Report, Department of Probation, New York Police Department, Administration for Children’s Services, New York State Office of Children and Family Services (via Juvenile Justice Monthly Indicators report compiled by Esperanza and disseminated by the Mayor’s Office of Criminal Justice)
| New York City By The Numbers |
How Much Has the Affordable Care Act Reduced the Share of Uninsured Patients Treated by the City’s Public Hospitals?
With the full implementation of the Affordable Care Act, the share of adults in New York City without health insurance dropped from 20.9 percent in 2013 to 13.8 percent in 2014, a 7.1 percentage point decline. To gauge the effect on New York City Health + Hospitals, we focus on adult outpatient visits to H + H hospitals and diagnostic and treatment centers because some conditions that require inpatient stays, such as medical emergencies, allow for temporary Medicaid eligibility.
- Although the city’s public hospital system saw a reduction in the share of outpatient visits by uninsured adults, the decline was less steep—4.0 percentage points—than the city as a whole.
- In 2015, the share of H + H’s outpatient visits by uninsured adults (25.2 percent) was 11.4 percentage points greater than the share of uninsured adults in the general population.
- For both the city’s population and H + H’s patients, those adults who gained health insurance did so through Medicaid or commercial insurance in approximately equal proportions.
- Both the share of adult outpatient visits by uninsured patients and the impact of the Affordable Care Act on this share vary widely across H + H facilities.
- The hospital centers serving the largest shares of adult outpatients who are uninsured include Elmhurst, Queens, Bellevue, and Woodhull.
- Although each of these four hospital centers saw declines in the share of adults without insurance from 2013 through 2015, all of the decreases fell short of the reduction in the share of uninsured for the city as a whole. Woodhull saw by far the smallest decline, 1.8 percentage points.
Prepared by Erin Kelly
New York City Independent Budget Office
Print version available here.
SOURCES Department of Health & Mental Hygiene, New York City Community Health Survey, 2014. Health & Hospital Corporation Payor Mix Reports, September 2015 and September 2014, as reported to the Finance Committee.
NOTES: For the share of outpatient visits by uninsured adults at H + H facilities, pre-Affordable Care Act reflects fiscal year 2013 and post-Affordable Care Act reflects fiscal year 2015. For the share of New York City adults who are uninsured, pre-Affordable Care Act reflects calendar year 2013 and post Affordable Care Act reflect calendar year 2014, as reported by the Department of Health and Mental Hygiene Community Health Survey for those years. Coney Island Hospital is not included in the chart breaking out visits by facility because Hurricane Sandy had a lasting impact on the number of visits the hospital was able to provide in 2013 and 2014.
Are Fewer Child Care Vouchers for 4-Year-Olds Being Used Because of the Expansion of Full-Day Pre-K?
Under federal and state law, families with young children receiving cash assistance and participating in work or training programs are guaranteed vouchers to pay for their choice of child care providers. A limited number of vouchers are also available to low-income working families. As the de Blasio Administration moved to vastly expand the number of full-day pre-kindergarten slots available for the city’s children, many expected that there would be a corresponding decline in the use of child care vouchers for 4-year-olds.
- From October 2013 through October 2015 the number of children enrolled in full-day pre-k more than tripled, rising from 19,490 to 69,090.
- Over the same period, the use of of full-time vouchers for the care of 4-year-olds fell. For the children of cash assistance families the decrease was only 9.5 percent, from 6,128 to 5,549.
- For children in low-income families the number fell by 23.3 percent, from 1,395 to 1,070.
- Together, these changes mean that as of fall 2015, 6,619 children were still in voucher-funded full-time child care rather than Department of Education pre-k classes.
- The relatively small number of 4-year-olds in part-time voucher child care increased over the two years by 36.9 percent, from 279 to 382. It is possible that many of them were attending pre-k classes and using the vouchers for after-school care.
Parents who use child care vouchers can choose among a wide variety of child care providers including informal care, family child care, and center-based care. Not all of these providers offer the educational elements available to children enrolled in the Department of Education’s pre-k programs.
Prepared by Paul Lopatto
New York City Independent Budget Office
Print version available here.
SOURCES: Department of Education; Administration for Children’s Services
NOTES: Pre-k enrollment is as of October of each year. The voucher numbers for school years 2013-2014 and 2014-2015 are averages for September through June. The voucher numbers for 2015-2016 are averages for September through December.