To view in full screen, hover over the top right corner and click the screen icon.
All posts by admin
Limiting School Suspension Days: How Many Students Would Have Received A Reduced Suspension?
To view in full screen, hover over the top right corner and click the screen icon.
Has the de Blasio Administration Made the City’s Capital Commitment Plan More Realistic?
To view in full screen, hover over the top right corner and click the screen icon.
How Has Universal Preschool Changed the Shares of City Children Enrolled in Public Preschool, Private Preschool, and Not Enrolled at All?
To view in full screen, hover over the top right corner and click the screen icon.
Driving While Impaired Arrests Have Been Trending Down for Years. What About Crashes by Impaired Drivers?
To view in full screen, hover over the top right corner and click on the screen icon.
Did the Pandemic Affect the Number of Housing-Related One-Time Emergency Grants Made by the City?
To view in full screen, hover over the upper right corner and click the screen icon
Police Overtime Spending Is Down This Year. How Far Down, and Is It Expected to Stay Below Past Years?
To view in full screen, hover over the top right corner and click the screen icon.
When a “B” Becomes an “A”: How Many Schools Weight Their Advanced Placement Courses?
To view in fullscreen, hover over the top right corner and click on the screen icon.
How Did Participation in Organics Collection Programs Vary Throughout the City?
Last May, faced with $25 million in pandemic-related budget cuts, the Department of Sanitation stopped collecting recyclable organic material from residences, schools, and greenmarkets. The sanitation department also canceled last year’s autumn leaf collections. While the 2021 Adopted Budget restored $3 million for some organics drop-offs at greenmarket sites, the bulk of the program remains suspended.
Starting back in 2013, the city had been slowly expanding organics recycling across the five boroughs, although further expansion of the residential curbside program was halted in 2018 as the sanitation department searched for ways to make the collection routes and processing more cost efficient. Low public participation had resulted in partially filled trucks and higher costs in certain areas of the city, a factor that ultimately made the program vulnerable when the Covid-19 crisis triggered the need for budget cuts. IBO examined a few of the factors that led organics collections to be more efficient in some neighborhoods than others.

- Prior to the program’s suspension, the majority of organics tonnage came from curbside residential collections, with smaller amounts from schools, fall yard waste collections, and greenmarket drop-off sites. But participation in the different types of collections varied throughout the city.
- Staten Island—the city’s least densely populated borough—saw the largest share of collections from yard waste, which made up around 35 percent of the borough’s annual organics tonnage. In Manhattan, collections from schools made up the largest share while, curbside residential collections made up the majority of collections in Brooklyn, Queens, and the Bronx.
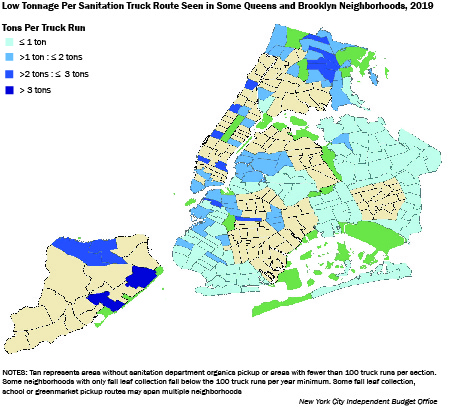
- In general, yard waste and schools collection are more efficient because the sanitation department gets more material per route from these pickups than from residential and greenmarket collections. The highest average tonnage per route, and therefore the routes with the greatest efficiency, occured mostly in areas with more yard waste and school collections: Staten Island, Manhattan, and parts of the Bronx. The lowest tonnage routes were clustered in eastern Queens and southern Brooklyn.
- Neighborhoods such as Greenpoint in Brooklyn, Riverdale in the Bronx, and Mariners Harbor in northwest Staten Island were some of the first communities to have curbside organics collection, and the sanitation department tended to collect more tons per route in these neighborhoods. In neighborhoods in Queens and southern Brooklyn, where the program had been expanded more recently, participation had not gained traction.
- If the program is reinstated, an ongoing commitment to mandatory citywide curbside organics collection and providing more ways for the public to participate could lead to fuller trucks and a more efficient program.
Prepared by Daniel Huber
New York City Independent Budget Office
Print version available here.
SOURCE: IBO analysis of Department of Sanitation data
Have School Attendance Rates This Year Varied by “Hardest-hit” Covid-19 Neighborhoods and Grade Levels?
To view in full screen, hover over the top right corner and click on the screen icon.