The Department of Transportation repairs and maintains the city’s streets. To fulfill this task, the department performs an ongoing street quality assessment and rates sections of every street in the city on an 18-month rolling basis on a scale from 1 to 10. Ratings are categorized into “poor” (1-3), “fair” (4-7), and “good” (8-10), with the exception of local streets for which a rating of 7 is deemed “good.”
Neighborhood Street Ratings with Borough and Citywide Rankings
- Based on ratings from 2014 and 2015 and weighted by their square feet, 70.2 percent of the city’s streets are in good condition, 29.2 percent are in fair condition, and 0.6 percent are in poor condition. Street conditions citywide have trended downward somewhat since 2012, according to the Mayor’s Management Report.
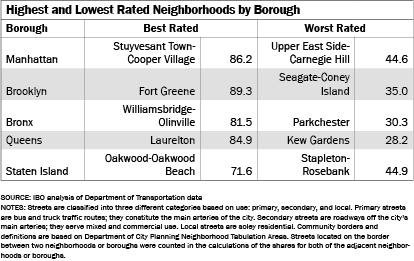
- Brooklyn streets are in the best shape with 75.1 percent of its streets rated as good, followed by Queens with 71.0 percent and the Bronx with 68.5 percent. Manhattan and Staten Island are the boroughs with the fewest streets in good shape—only 66.3 percent and 59.6 percent, respectively.
- Citywide, the neighborhoods with the best ratings are Fort Greene (89.3 percent good), Starrett City (86.5 percent), and Williamsburg (86.3 percent), all of which are located in Brooklyn. The neighborhoods with the worst street quality are Kew Gardens in Queens (28.2 percent good), Parkchester in the Bronx (30.3 percent), and Seagate-Coney Island in Brooklyn (35.0 percent).
Prepared by Giovanella Quintanilla Re
New York City Independent Budget Office
Print version available here.
| New York City By The Numbers |

