Last year New York City’s five pension systems for municipal employees paid $12.9 billion in benefits to more than 332,000 retirees or their beneficiaries. While many retired city workers remain in the five boroughs, many others collect their pension checks in states and counties all around the country—there are no residency requirements for pension eligibility. IBO has taken a look at how much of last year’s pension payouts flow to other parts of the U.S. and where they go.
Payments to New York City Government Retirees and Beneficiaries by U.S. County, 2017
Of the $12.9 billion in payments made by the city’s pension funds in 2017, $5.5 billion, or 43 percent, was paid to recipients living in New York City. Payments to municipal retirees within the state of New York equaled $9.3 billion, or 73 percent of total payments over the year.
The average per capita payment to all beneficiaries in 2017 was $38,711, with a median of $34,259. The comparable figure for New York State was $40,098. Among the states with at least 100 city retirees, pensioners living in Hawaii received the largest average payment: $41,700.
Among municipal retirees still living in New York City, per capita benefit payments averaged $36,092. Of the 25 largest counties by recipient population nationwide, Orange County, New York, had the highest per capita payments, $55,524.
Number of New York City Government Retirees by U.S. County, 2017
About 46 percent of retirees receiving pensions from the city live in one of the five boroughs. An additional 22 percent live in one of the six nearby New York State counties.
Of the top 10 counties in which New York City pension recipients resided, only one was outside of New York State—Palm Beach, Florida, with 7,868 city pensioners. Other leading counties home to New York City government pensioners included Broward County, Florida; and Ocean, Monmouth, and Bergen counties in New Jersey.
All 50 states and the District of Columbia have New York City pensioners residing within their borders, from 5 in North Dakota to the 35,410 Floridians who were paid $1.3 billion in pension benefits in 2017. The 1,601 beneficiaries living in Puerto Rico received $42 million in benefits, while an additional $24.4 million was paid to 866 retirees living outside the United States and its territories.
After New York and Florida, the eight other states with the most New York City government retirees are New Jersey, North Carolina, Pennsylvania, South Carolina, Georgia, Virginia, California, and Connecticut.
Each school year there is considerable movement of students who transfer from one school to another or out of the city’s public school system altogether. To develop a clearer picture of the extent of this movement and some factors that may prompt these transfers and exits from the school system, we tracked the mobility of students enrolled in the city’s traditional public schools and charter schools over a one-year period from the start of school year 2014-2015 to the start of the next school year. There were 1.043 million students enrolled in grades K-12 at the start of this period. When you take into account the students who graduated from high school or moved on, for example, from elementary school to middle school, you are left with 872,863 students.
More than 730,000 students remained in the same school from the start of school year 2014-2015 to the start of the next school year—a stability rate of 84 percent. This rate was higher in grades K-8 (84 percent) than in high schools (82 percent). The 2014-2015 stability rate was 2 percentage points higher than the rate for 2011-2012.
More students transferred schools (77,800, or 9 percent) than exited the system either to go to a private school or a school outside the city (51,500, or 6 percent) or dropped out or otherwise left the school system without graduating (13,300, or less than 2 percent). Transfers occur for a variety of reasons ranging from transfers prompted by the Department of Education to improve a student’s opportunities for learning to temporary transfers to a school or program, to elective transfers by the family, including to and from charter schools.
Not all transfers or exits are permanent. Some of the 142,617 students who initially transferred or exited switched again during the 2014-2015 school year or in the following summer. Nearly 2,700 students who transferred or exited returned and earned a credential later that same year.
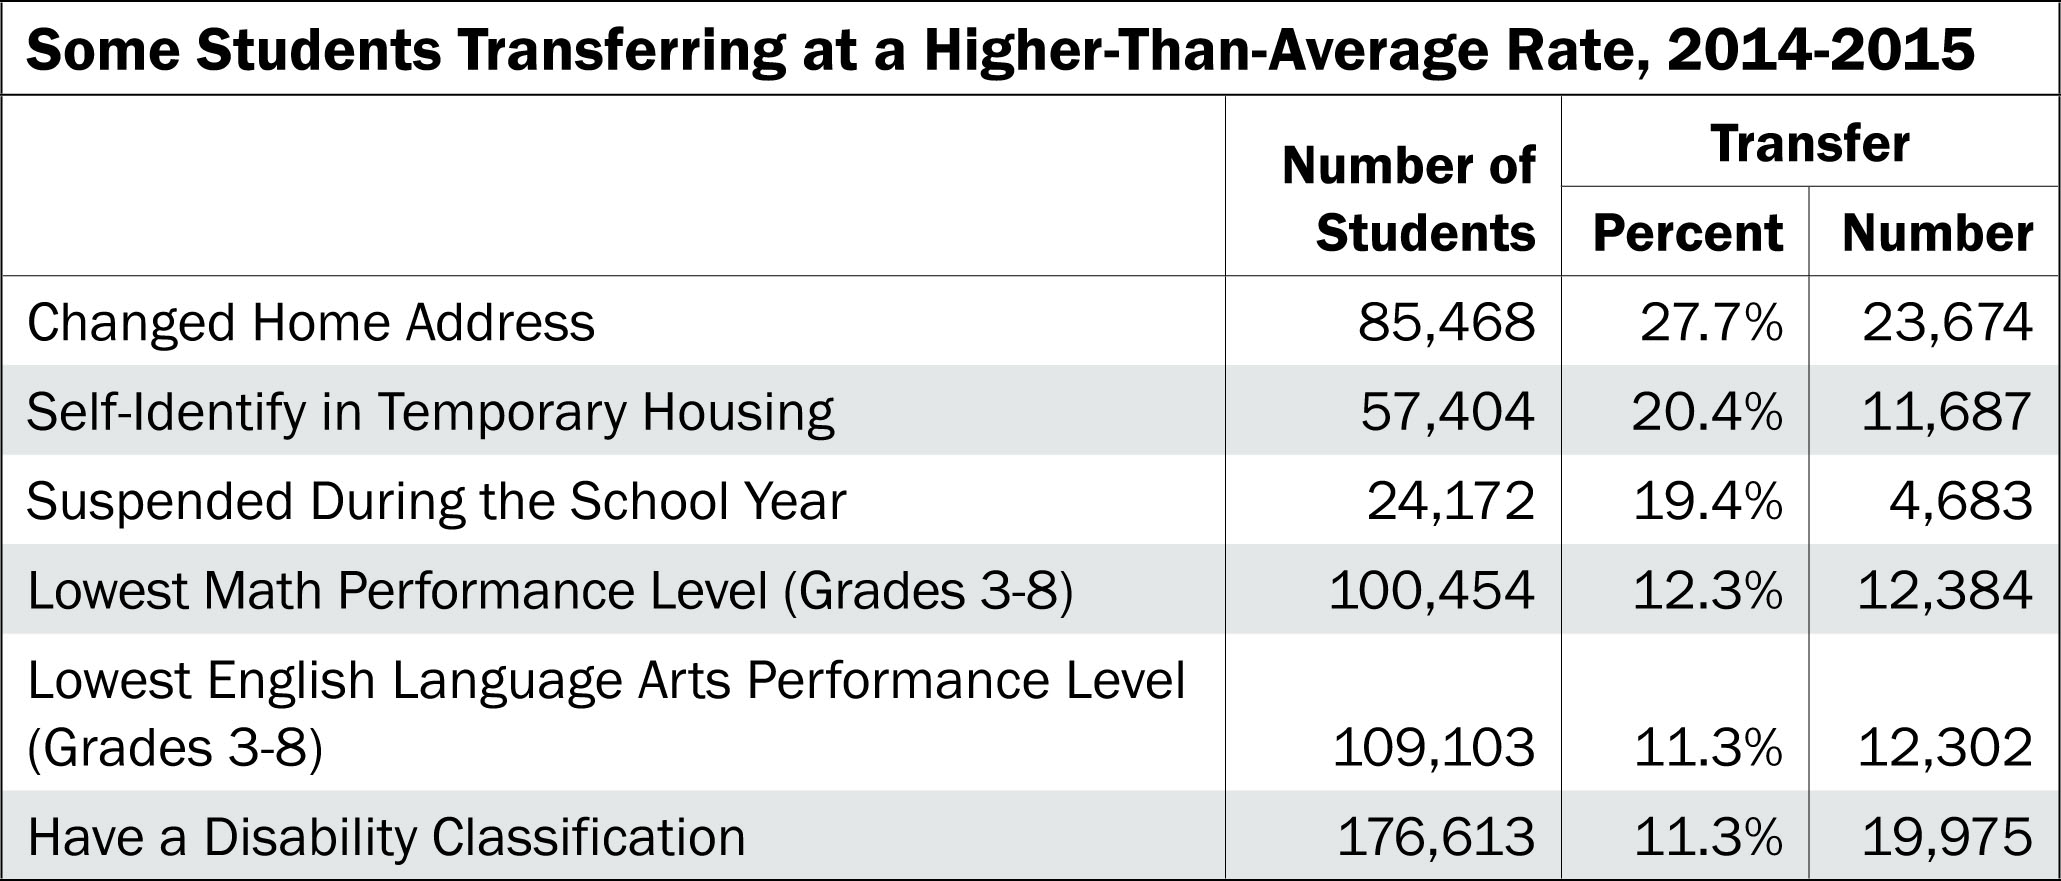
Not surprisingly, students who have changed home addresses from one year to the next transferred schools within the public school system at the highest rate. Nearly 28 percent of the almost 85,500 students who changed home addresses transferred schools during the period we examined.
Students who self-identify as living in temporary housing at some point in the school year also transferred schools at a higher-than-average rate. Over 20 percent of these 57,400 students transferred schools.
Over 19 percent of the nearly 24,200 students who were suspended at some point in the school year transferred schools.
Students who scored at the lowest level on the grades 3-8 English language arts and math tests also transferred schools at above-average rates: 12 percent of the 100,500 students who scored at the lowest level on the math test and 11 percent of 109,000 students at the lowest level on the English test.
Over 11 percent of the 176,600 students classified as having a disability also transferred schools.
Prepared by the Education Research Team New York City Independent Budget Office