All posts by admin

Seas Rise, Storms Surge, and NYC Presses Ahead with Waterfront Development Projects

Posted by Doug Turetsky, November 21, 2012

Long before Sandy slammed the city’s coastline, the Bloomberg Administration had been sounding alarms about coming threats to the city due to climate change. In well-known reports such as PlaNYC and through less publicized efforts such as the convening of scientists and risk management experts for the New York City Panel on Climate Change, the Bloomberg Administration signaled that it clearly recognized the significant impact global warming and rising sea levels could have on New York.

Photo credit: flickr/drpavloff

The Mayor’s March 2011 report Vision 2020: New York City Comprehensive Waterfront Plan forecast the coming of storms like Sandy and the potential affects: “The rise in sea level and increased frequency and magnitude of coastal storms will likely cause more frequent coastal flooding and inundation of coastal wetlands as well as erosion of beaches, dunes, and bluffs.” A few weeks later, in an update to PlaNYC, the warnings were reinforced: “As a city with 520 miles of coastline—the most of any city in America—the potential for more frequent and intense coastal storms with increased impacts due to a rise in sea level is a serious threat to New York City.”

Yet even as City Hall grappled with these concerns it continued to put substantial resources into major development projects on the waterfront, rezoning sites as manufacturing declined— including some in prime areas for flooding, the so-called Zone A evacuation areas. Just one month before Sandy struck the city, Mayor Bloomberg announced a plan by private developers to build a $500 million complex on city-owned land on Staten Island’s North Shore that would include the world’s largest Ferris wheel as well as a hotel and outlet mall. Part of the site sits in a floodplain.

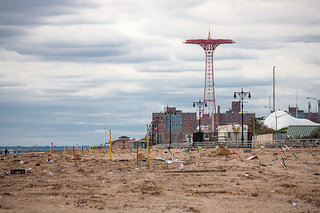
An even larger development project is planned on the Coney Island waterfront, one of the neighborhoods hardest hit by Sandy. The city has rezoned the area to allow the development of hotels, housing, and a new amusement park, and has allocated more than $400 million for sewer upgrades, land acquisition, lighting, boardwalk and park improvements, and other projects to foster the redevelopment plan. On the Queens waterfront, the city is investing $147 million in the Hunters Point South project, which also sits in Zone A. Already under construction, Hunters Point South includes 5,000 apartments, a 1,100-seat school, and retail space.

To be fair, the Bloomberg Administration has taken steps to protect the city from the affects of rising sea levels and storm surges, following existing city building codes and Federal Emergency Management Agency guidelines. But these guidelines may not be adequate in the face of storms with the fury of Sandy.

As Yale University’s Environment 360 Web site noted, “The storm easily overwhelmed many of the relatively minor adaptations that New York had already put in place.” For example, Brooklyn Bridge Park, where another large development project is planned, was created with what are called “soft edges.” These are supposed to help reduce the force of waves and accommodate rising tidal levels. While these edges may work in many instances, they were no match for Sandy, which swamped the park and sent water lapping at the structure housing the newly installed carousel.

In Sandy’s wake, Governor Andrew Cuomo, Mayor Bloomberg, and Council Speaker Christine Quinn are promising to ramp up efforts to protect the city and the city’s infrastructure from what many believe is the increasing threat posed by major storms. Speaking to a group of business and civic leaders, Council Speaker Quinn said, “We…must rethink the way we build in neighborhoods that were destroyed by the storm.”

Such rethinking takes time for evaluation and planning, time that some city officials and developers seem disinclined to take. Just last week, as many Staten Island residents and business owners continued to clear the rubble from Sandy—and mourned the loss of family and friends—the city’s Economic Development Corporation held a hearing to advance the Ferris wheel project on the North Shore.

The city can press ahead with waterfront projects like the one on Staten Island’s North Shore, as well as others throughout the five boroughs, before there is a clearer plan for the kinds of steps New York will take to minimize the danger from future Sandys. But doing so increases the risk that the next “superstorm” will exact an even higher price tag.
Sandy’s Aftermath: How Much Federal Aid Can the City Expect?

Posted by Doug Turetsky, November 8, 2012

In the decade since the terrorist attacks on 9/11, New York City has faced several other disasters that drew federal aid, such as last year’s Tropical Storm Irene and the blizzard and tornadoes of 2010. As IBO’s George Sweeting points out, the city received federal aid for a far wider range of uses in the aftermath of 9/11 than it did following the weather-related events.

While Hurricane Sandy shares the climatic origins of Irene, the blizzard, and tornadoes, the extent of the physical devastation is more akin to 9/11. The number of lives lost due to Sandy, while tragic, paled in comparison to the World Trade Center attacks. But the widespread devastation in the wake of Sandy —from large swaths of Staten Island to the Rockaways to Coney Island, and once again, Lower Manhattan—has a price tag that puts it in a league with 9/11. Moody’s Analytics has estimated a cost of $12 billion for the New York City area.

[UPDATE: Gov. Andrew Cuomo estimated today that losses due to Hurricane Sandy could total $33 billion in New York State.]

The question for the coming days and weeks for New York City and other hard-hit areas is: Will federal disaster relief have the more limited scope of the typical response after a serious storm or will Washington respond with much broader types of aid as it did following 9/11?

Federal aid in the wake of storms usually has one fundamental component: emergency response and recovery. This immediate assistance may include rescue effort; emergency food and shelter; low-interest loans to residents and small businesses; unemployment payments; the cleanup of debris; and repair of damaged infrastructure such as roads, buildings, equipment, parks, and utilities. The $20.5 billion in aid provided after the attacks on the World Trade Center featured two other significant components: assistance for additional rebuilding and development and substantial budget relief for the city to make up for expectations of lost tax revenues.

The aid for rebuilding and development after 9/11 was substantial, totaling $11.3 billion in direct assistance and tax breaks. A large portion of this was dedicated to transportation projects such as the approximately $4 billion World Trade Center Transportation Hub and $530 million for the now Sandy-flooded South Ferry subway station. For a more detailed look at World Trade Center-related aid, see this IBO report. Washington also authorized lower-cost financing for development projects through the creation of tax-exempt Liberty Bonds estimated to cost the federal government $1.2 billion in foregone tax revenue. The use of these bonds became controversial as some were directed towards projects such as the new Goldman Sachs office downtown as well as the Bank of America building in midtown and the Bank of New York tower in Brooklyn. Good Jobs New York, a nonprofit that monitors local economic development deals, has already raised concerns about how decisions will be made if wide-ranging rebuilding aid comes the city’s way as part of Sandy relief.

Post-9/11 assistance also included nearly $2 billion in budget aid mostly for the city (a portion of this amount was for the state). About half of this aid came through a provision that allowed the city to refinance some of its tax-exempt bonds and as a result reduce its spending on debt service. The other half materialized when expenditures for the initial emergency response and cleanup turned out not to cost as much as expected; the city just got to keep the money.

Federal aid following the September 2010 tornadoes was typical of the sorts of aid that follow natural disasters. The cost of cleaning up and repairing the damage from the storm was $21.2 million. The Federal Emergency Management Agency provided $10.8 million, the state $1.8 million. The rest was on the city’s dime. That was also the year of the blizzard that paralyzed the city in the days after Christmas. Washington only provided some disaster aid to cover costs in Staten Island. Coupled with the costs of several other big storms, the city spent more than $100 million that fiscal year on snow removal and related road repairs, the vast majority at our expense. For more details on weather-related costs in fiscal year 2011, see this report, pg 49. Damage from last year’s Tropical Storm Irene cost the city about $55 million, with 90 percent of the expenses eligible for federal reimbursement.

With the dust still settling from Tuesday’s election, it remains to be seen how extensive federal aid for Sandy will be. A $12 billion proposal to supplement federal disaster cleanup and recovery funds has been introduced in the House, but the Senate appears to be waiting for updated estimates on the extent of the damage before it acts. Neither the House nor the Senate seems to be discussing the kind of broader aid that followed 9/11.

Whose Streets You Calling Dirty?

Posted by Doug Turetsky, October 23, 2012

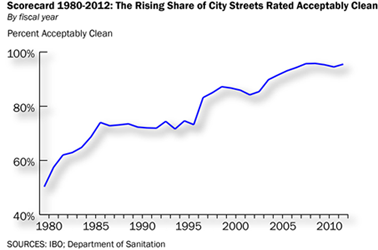
Last month, a Travel & Leisure magazine reader survey ranked New York the dirtiest city in the U.S. Just a few weeks later, the Bloomberg Administration released the Mayor’s Management Report for fiscal year 2012, which found that 95.5 percent of the city’s streets were ”acceptably clean”—meaning there were only scattered bits of litter on the streets. The report deemed not a single section of the city dirty.

Even acknowledging that there can be sharp differences among individual perceptions of intolerable levels of grit, grime, and litter, there’s a huge gulf between the T&L survey and the Bloomberg Administration’s rating. In 2012, the city spent $81 million on activities related to cleaning its streets such as running the city’s 450 mechanical brooms and emptying litter baskets, according to figures provided by the sanitation department. About $570 million more was spent collecting curbside trash and recyclables. Given these expenditures, chalking up that gulf in perceptions solely to eye-of-the-beholder differences seems insufficient—especially since city residents may not see eye-to-eye with the Bloomberg Administration rating either.

In July, the Mayor’s Office of Operations, which does the street cleanliness ratings, scored 98.4 percent of the streets in Manhattan’s Community Board 1 as acceptably clean. Yet Crain’s recently reported that complaints about overflowing trash cans in Lower Manhattan, which is part of Community Board 1, led city officials to add more trash cans in the area in August, the very month following the pristine rating. And now Lower Manhattan’s Downtown Alliance has placed solar powered trash-compacting bins that can hold five times the amount of garbage as a regular litter basket at five heavily trafficked street corners.

Community boards citywide also may be less sanguine than City Hall when it comes to the cleanliness of the city’s streets. As a way to gauge the demand for certain services, the Mayor’s budget office asks community boards each year to rank by importance 90 different services provided locally. Street cleaning ranked 17th citywide, ahead of other efforts such as economic development initiatives, housing code inspections, and services for the homeless.

On a recent Wednesday morning IBO’s Justin Bland and I joined Edwin Cuevas and Alicia Robinson as they rated the cleanliness of about 25 streets in Crown Heights. Each month three teams from the Scorecard program in the Mayor’s Office of Operations rate the same set of 6,900 of the city’s 120,000 blocks. As Robinson drove, Cuevas, a 19-year veteran of the program, eyeballed and quickly rated the cleanliness based on a seven-point numerical scale. To better ensure that the drive-by survey is representative of daily conditions, the week, day, time, and team doing the rating for each set of streets in the sample varies from month to month.

But there are two key reasons the survey findings may not mesh with public perceptions. First, the streets surveyed and the rating scale were developed in the late 1970s, a time when there may have been lower expectations—at least compared with today—for what measured up as an acceptably clean street. Additionally, the surveyed streets may no longer provide the most representative sample. Operations staff members acknowledge that public perceptions of what’s clean or dirty have changed over the years and are working to recalibrate their rating system as well as adjust which streets are surveyed.

Secondly, the ratings are compiled Monday through Friday. So the survey doesn’t capture a view of street cleanliness on weekends and holidays, when tourists abound and neighborhood commercial streets are busiest and litter most likely to pile up and trash cans overflow. For years, the City Council funded litter basket pick-ups on Sundays and holidays in business districts around the city. But the Council hasn’t provided funds for this service since 2009, when it pitched in $1.4 million.

Reconciling tourist impressions of what’s a clean street with those of New Yorkers may be impossible. For some tourists, the sense that the city’s streets are dirty may be heightened by the crowds and disorder that characterizes street life in some parts of New York, a level of activity that may be alien to their usual experience.

What may be more important is comparing New Yorkers own impressions of street cleanliness with those of the Mayor’s scorecard. Even if the Mayor’s office updates and improves its rating system, putting City Hall’s self-assessment alongside a survey of the views of residents and business owners could be instructive. After all, they’re the ones paying for the service.

Cutting the City’s Billion Dollar Spending on Overtime May be Easier Said than Done

Posted by Doug Turetsky, October 4, 2012

With the Mayor asking city agencies to come up with $2.0 billion in proposed budget cuts for the next year and a half, one area that could come under scrutiny is overtime spending. In fiscal year 2012, which ended June 30, the city spent about $280 million more on overtime pay than it did five years ago.

Somewhat surprisingly, at least in recent years, the growth in overtime spending bears little relation to changes in the size of the city’s workforce. Over the past five years, the number of full-time city workers has waxed and waned with the ups and downs of the local economy. In fiscal year 2007, there were 270,839 municipal workers as of June 30, 2007. A year later, there were 280,649. By June 30, 2012, the number was 270,795 (the June 2012 projection by the Mayor’s Office of Management and Budget), virtually the same as in 2007. Still, over those five years citywide overtime spending climbed steadily: from $989 million to nearly $1.3 billion.

About two-thirds of all overtime spending is generated by just a handful of agencies, the so-called uniformed forces: the police, fire, correction, and sanitation departments. Uniformed workers in these agencies collected $933.6 million in overtime pay last year.

Likewise, virtually all the growth in overtime spending has occurred among these same agencies. Since 2007, overtime spending by all city agencies on “civilian” employees (including civilian employees within the uniformed forces) grew by a modest $3.9 million, with some agencies spending more and others less.

There are a variety of factors that can drive overtime spending, some of which are unique to particular agencies and not entirely under the agencies’ control. The police department is responsible for the biggest share of the city’s overtime costs—$519.1 million for uniformed officers in 2012. This overtime is the result of a number of factors ranging from arrests and time spent in court to ongoing investigations to unplanned events (for example, Occupy Wall Street, presidential visits, one-time concerts) and planned events (such as annual street fairs, walkathons, and parades). See “IBO’s Police Overtime: Tracking the Big Growth in Spending” for more on types of police overtime spending.

Snowfall can cause sanitation department overtime to pile up. In 2011, more than 61 inches of snow fell on the city and sanitation workers earned $62.4 million in overtime pay to clean it up. Last winter, with less than 7 inches of snow, snow-related overtime melted to a modest $7.2 million.

Declining staff levels at an agency can lead to rising overtime costs. With hiring on hold at the fire department due to a discrimination lawsuit, overtime has soared. As retirees were not replaced, firefighter staffing fell from 11,459 in 2009 to 10,260 in 2012 and overtime spending grew from $127.6 million to $230.8 million over the same period. Despite the falloff in the number of firefighters, fire houses still have to be staffed around the clock to provide a constant level of services. With the judge on the lawsuit now allowing the city to hire more firefighters, the department’s overtime spending should decline as new recruits graduate from the fire academy.

While the fire department used increased overtime spending in order to maintain services in the face of diminished staffing, the parks department cut staffing and increased overtime spending to achieve overall budget savings—savings that may also affect the level of services delivered. Parks department full-time staffing fell by about 430 in 2012 to 2,920, while overtime spending increased by $1.2 million to $8.7 million. That’s about $2,700 in additional overtime spending for each staff member lost, an amount well below the cost of salary and benefits for a full-time employee. Of course, that doesn’t mean all the work done by the former staff members is being accomplished on overtime—budget savings by cutting personnel may also be accompanied by service declines.

Conversely, even when staffing levels rise, agency overtime spending may increase. Civilian full-time staffing grew by about 300 last year at the Department of Correction, but overtime spending jumped by nearly $5.0 million to $11.7 million.

With a tab of more than $1 billion a year, overtime spending appears to be a ripe target for budget cutting. But given the different factors driving this spending, hitting those targets may take some careful aim.

New York City: Your Ad Here

Posted by Doug Turetsky, September 6, 2012

New York City itself may not be for sale, but the rights to tie your corporate name and logo to a variety of city facilities and services may increasingly be up for grabs as public agencies look for ways to raise revenues to meet growing expenses and offset city funding cuts.

On September 14, the city’s parks department is scheduled to receive bids from companies for the right to affix their names to 55 dog runs and 631 basketball courts. The city’s 2013 budget anticipates $1.5 million in annual revenue for the naming rights to the dog runs and $3.5 million from the basketball courts in fiscal years 2013-2016. An additional $8.0 million in annual revenue over the same period is expected through more sponsorships, although the parks department has not yet announced what facilities it will offer to potential sponsors. The city’s financial plan expects the parks department to take in $13 million annually in sponsorship revenues through 2016.

The parks department’s effort to sell these naming rights is being done under an initiative it calls the NYC Parks Corporate Partnership Program. Under this program, the agency says, “[C]ompanies can invest in a unique opportunity to promote their brand through NYC parks assets.” The parks department is offering potential partners rights that can stretch from onsite to online.

IMG Worldwide, a major sports and fashion marketing and licensing company, has been enlisted to play a key role in the parks’ partnership program (IMG is the marketer of New York City Fashion Week). The parks department Web site describes IMG as “the exclusive designated agency to develop and commercialize this opportunity.” Proposals for sponsoring the dog runs and basketball courts are to be sent to IMG. For its work on behalf of the parks department, IMG is reportedly being paid by NYC & Company, a private organization that does tourism promotion and marketing for the city. In 2011, about 40 percent of NYC & Company’s $36.4 million in revenues came from city funding.

The parks department is not the first agency to market naming or sponsorship opportunities. The Department of Transportation’s bike-share program, now expected to start rolling in March 2013, is being funded solely with sponsorship money: $41 million from Citigroup and $6.5 million from MasterCard. For its cash, Citigroup will get its name on 10,000 bikes and 600 docking stations around the city. MasterCard is providing the payment system for the program.

Similarly, the Metropolitan Transportation Authority is seeking to take greater advantage of the MetroCard’s ubiquity as well as its iconic link to the city by offering advertising space on the front of the card. The back of the card has already been available at costs ranging from $25,500 for 50,000 cards to $450,000 for 2.5 million cards. Rates for the front of the card haven’t been determined yet.

The transportation authority has also sold naming rights to the Atlantic Avenue-Pacific Street subway stop for $200,000 a year for 20 years to the British banking firm Barclays. The station, which sits under the soon-to-be opened Barclays Center arena in Brooklyn, is now called Atlantic Avenue-Barclays Center (Barclays paid $400 million over 20 years to purchase naming rights for the publicly subsidized arena from the Nets).

At least one other local agency has declared its intention to offer up its facilities for some form of advertising. Last September, the Daily News reported that the New York City Housing Authority was floating the notion of offering billboards to advertisers at its development projects, an idea that provoked unease among some residents and elected officials.

But the housing authority still sees its 2,600 buildings in 334 developments citywide as an opportunity for prospective advertisers. In January, the housing authority released Plan NYCHA: A Roadmap For Preservation, a five-year plan to improve services and increase partnerships and revenues. Although it provides only the barest of details, the plan states that the housing authority aims to “design and launch a plan to offer NYCHA property for advertising with input from residents.”

New York’s streets were once believed to be paved with gold. In the future, they may increasingly be paved with sponsorship dollars.

Water Conservation Program Could Cause a Flood of New Problems for the City’s Housing Authority

Posted by Doug Turetsky, August 16, 2012

With the New York City Housing Authority facing a recent barrage of critical press, it’s not surprising that a seemingly small change in how the housing authority will be billed for water has been overlooked. But what may seem like a small drip of an issue now could open a floodgate later.

In an extension of its effort to encourage water conservation, the city’s Department of Environmental Protection last month put the New York City Housing Authority into a water conservation program that requires water meters to be installed at all of the housing authority’s 334 developments. If the housing authority cannot meet the requirements of the conservation program, it may instead be billed by water meters that track the amount of water used in a building. This could result in higher water and sewer bills for an agency already struggling with budget shortfalls and has trouble with the timely upkeep and repair of its properties.

Water already comes at no small cost for the housing authority. In 2011, the water bills for the housing authority’s developments totaled $149.9 million, according to IBO analyst Justin Bland. Under the new conservation program, the housing authority will pay about $160 million in 2013. The housing authority’s five-year operating plan shows a General Fund deficit of $61.3 million this year and $63.3 million for 2013 (about 3 percent of the roughly $2 billion budgets for public housing developments in both years).

The housing authority is not the only property owner being compelled to join the conservation program, but it is the largest. All of the city’s buildings were supposed to be metered and billed by water usage more than a decade ago. Launched in 1988 following a severe drought, the metering program aimed to be universal within 10 years. A decade after that deadline, as recounted in an October 2009 IBO Weblog Post, the program was well behind schedule, with nearly 50,000 water accounts still being billed on the frontage system—fees based on building size and the number of sinks, showers, tubs, and toilets.

As of July 1, the Department of Environmental Protection required that most of the remaining unmetered residential buildings in the city take a step towards the Universal Metering Program. The department has automatically enrolled the housing authority and other owners of properties with four or more units that have lagged behind in the city’s water metering efforts into its Multi-Family Conservation Program. The program sets a flat rate of $894.15 per apartment annually for water and sewer fees, about $60 higher than the average under the previous system. But paying the flat rate and staying in the conservation program is contingent upon installing water meters by January 2014 and “high-efficiency water-using filters” in 70 percent of a building’s apartments by June 2015.

Meeting these requirements may be a challenge for the housing authority, which is already awash in a backlog of repairs and delayed renovation projects. A June 2012 City Council Report for a budget hearing on the housing authority cited a 2011 backlog of nearly 300,000 work orders for about 17,900 apartments, 10 percent of the 179,000 units in public housing developments. And recent articles in the New York Daily News have chronicled the ongoing delays in major upgrade and renovation projects at housing authority developments. The need for such upgrades is likely to grow—1,400 of the 2,600 buildings in housing authority developments are at least 50 years old.

Many New Yorkers would no doubt agree that water conservation is an important public policy goal. But as it struggles to provide its 400,000 residents with safe and livable apartments, this may be a particularly difficult time for the housing authority to take on a new challenge.

Few Layoffs in 2013 City Budget, But Municipal Workforce Would Continue to Shrink

Posted by Doug Turetsky, July 24, 2012

Are cities and states around the U.S. undergoing a surge in hiring? That was the finding of a USA Today news story earlier this month, which noted that hiring by cities, states, and local school districts during the first four months of 2012 was 20 percent above the rate for the same period last year. This hiring comes in the wake of steep recession-related government job cuts. A just-released report by the Volcker/Ravitch Task Force on state budgets found that state and local governments slashed employment far more than in previous recessions.

 
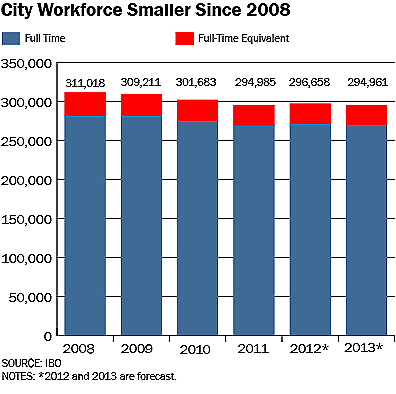
While New York City government is certainly doing some hiring, don’t expect a rise in the number of municipal workers anytime soon—at least not based the budget that was recently adopted for fiscal year 2013, which began on July 1. Based on the budget for 2013, the city workforce will decline by 1,697 this year and total 294,961 by June 30, 2013 (including the number of hours worked by part-timers calculated to add up to an equivalent number of full-time positions). That’s down from 311,018 in June 2008, just as the recession began to squeeze city tax receipts. The decline has occurred through a combination of layoffs and attrition—not rehiring if a position becomes vacant due to an event such as retirement or resignation.


Proposed staffing cuts played a relatively small role in the recent round of budget debates. That’s far different from last year, when wrangling over the Mayor’s proposed budget for 2012 was largely dominated by his proposal to lay off nearly 4,300 teachers and not replace about 1,900 other teachers who were expected to leave the school system. Although the teacher layoffs were averted in negotiations with the City Council, other layoffs have occurred in the wake of the recession.

 
Determining the number of city workers that have been laid off is difficult because not every employee is in the city’s main payroll database. For example, Department of Education administrators and, as of a few weeks ago, custodians are in the main database. Other education department employees, such as the 672 school aides laid off last year, are in a separate database.


A review of the city’s main payroll database by IBO labor analyst Martin Davis identified a total of 2,031 layoffs among regular full-time and part-time city workers from fiscal year 2009 through May 2012. Most of the layoffs in the database we reviewed were concentrated in just a few agencies, and nearly half occurred in 2010 when there were 940.

Besides the Department of Education school aide layoffs, the Administration for Children’s Services accounted for the most layoffs we were able to identify in the 2009-2012 period, with 598. Well more than half of these occurred in 2010.There were 509 layoffs among staff identified as administrators at the Department of Education over the same four-year period. The Department of Health and Mental Hygiene’s layoff total was next at 296.


The Mayor’s initial budget proposals for the current fiscal year projected far fewer layoffs than his 2012 proposals. And more than half of the projected layoffs for 2013 were not actually of municipal employees but rather the result of anticipated cuts in the city subsidy to libraries and cultural organizations—cuts that were ultimately reversed in the most recent budget deal with the City Council.

 
Among the comparatively small number of layoffs that are included in the budget adopted last month are staff cuts at the Department of Transportation as the city makes the shift from single-space parking meters to Muni Meters. The declining number of layoffs here mirrors a national trend found in an April 2012 survey by the Center for State & Local Government Excellence. Twenty-eight percent of responding governments said they had undertaken layoffs this year compared with 40 percent the year before. At least in the short term, layoffs may increasingly have more to do with changes in staffing needs than fiscal needs.

Tallying the Extra Cost of Four Citywide Election Days in 2012

Posted by Doug Turetsky, June 19, 2012

Democracy may be priceless, but the cost of voting in New York City comes with an extra tab this year. That’s because next Tuesday’s Congressional primary will be the second of four citywide elections being held in 2012—the most in recent memory. It follows the Republican Presidential primary held in April. Still to come are the state legislative primaries on September 13 and the general election on November 6.

The price tag for each of these citywide elections: as much as $23 million.

We typically have three citywide elections in a year when the terms for state and federal officeholders are up for vote. But this year a federal judge ruled that New York State’s scheduling of its Congressional primaries in September, in conjunction with the state primaries for Assembly and Senate, would not leave enough time to get absentee ballots to military personnel overseas before the general election in November.

Albany officials could have shifted state legislative primaries to June 26 as well, but chose not to. With New York’s legislative session scheduled to run until June 21, the State Senate balked at the idea of holding an election just five days later that would leave them little time to get home and campaign. So counties across the state pony up more money to cover the cost of an additional day for voters to go to the polls. For the city this meant adding $23 million to the Board of Election’s budget. The funds cover expenditures such as printing ballots, transporting voting machines to the city’s more than 1,300 polling sites, and paying about 30,000 poll workers.

Although the city budget included $23.9 million for April’s Republican primary, actual expenditures totaled about $13.3 million according to information obtained by IBO’s Bernard O’Brien. The original allocation was made last year based on the assumption that both Republicans and Democrats would be holding primaries. But with only a primary for the city’s 486,000 registered Republicans taking place, the Board of Elections could cut some costs. By law every polling place had to open, but the elections board was able to combine some election districts within polling places. This allowed the board to reduce the number of voting machines needed to be delivered, ballots printed, and poll workers hired.

Despite the cost savings, the price per vote didn’t come cheap. Turnout in April was light, with 25,475 registered Republicans casting ballots, or about 5 percent of eligible voters. The cost per vote: about $522.

Turnout should be somewhat heavier in the upcoming elections, although that means there will likely not be as many opportunities for cost savings similar to those in the April 24th election. So the total cost for the four elections this year may be upwards of $80 million.

That amount doesn’t include the cost of overtime for police officers stationed at voting sites. In 2008, when the city similarly had federal and state elections, police overtime cost an average of $500,000 for each of the three election days that year.

Nor does the $80 million include the cost of the special election in Brooklyn’s 27th Senatorial District held in March. While the city budget originally included $840,000 for this election, the cost for the March election day was closer to $750,000. But the vote tallies for the two candidates were so close that it triggered a recount that is expected to bring the full cost significantly higher—for a district slated to disappear at the end of the year as new Senate lines go into effect in the wake of the 2010 Census and redistricting.

The Coop & Condo Tax Break Is About to Expire, Renewing the Existing Bill Will Cost the City Millions in Unintended Benefits

Posted by Doug Turetsky, May 17, 2012

With about five weeks to go in the New York State legislative session, there are still some controversial issues to resolve such as the push to increase the minimum wage, the DREAM Act, and pay hikes for legislators. One issue that has received little if any public notice is the impending expiration in June of New York City’s tax break for coop and condo owners.

If Albany doesn’t act to reauthorize the tax abatement, roughly 365,000 New York City coop and condo owners could see their property tax bills jump. But if legislators simply renew the existing bill, they’ll be giving far steeper tax breaks to many coop and condo owners than originally intended and costing the city hundreds of millions of dollars in foregone revenue.

In the early 1990s, many coop and condo owners complained that the city’s property tax system was unfair, burdening apartment owners with higher tax rates than those paid by owners of one- to three-family homes. A special commission to look at problems with the city’s property tax system was appointed by Mayor David Dinkins and Council Speaker Peter Vallone. The commission concurred with the complaints of coop and condo owners and recommended that taxes on homeowner apartments be brought into line with those one- to three-family homeowners. (For more details on the commission and inequities in the property tax system, see IBO’s Twenty-Five Years After S7000: How Property Tax Burdens Have Shifted in New York City.)

Fixing the inequity between apartment owner and homeowner taxes proved difficult under the constraints of the broader property tax system crafted by the state. In 1997, at the behest of the City Council and then-Mayor Rudolph Giuliani, the state Legislature enacted what was supposed to be a temporary fix for coop and condo owners.

But the temporary fix has in effect become permanent, renewed four times—at no small cost to the city treasury. The total cost of the abatement in 2012 is about $445 million in forgone revenue. An estimated $260 million of that is a tax break for coop and condo owners whose tax burdens are actually lower than what they would face if they were simply moved into the homeowner tax class, according to calculations by IBO’s Ana Champeny. And many of these coop and condo owners live in some of the wealthiest neighborhoods in the city, particularly east and west of Central Park and brownstone Brooklyn.

Why do many apartment owners have lower tax burdens than homeowners? Under state law coops and condos are assessed as if they are rental buildings, meaning that in many instances the properties are greatly undervalued—especially in neighborhoods where values have risen dramatically over the years.

The effect of the state’s assessment rule becomes clear when IBO estimates coop and condo building values using actual sales data rather than the assessments the city is required to use. Take the example of 101 Central Park West. The Department of Finance market value is about $630,000 per unit while the average sales price for apartments sold since January 2011 has been $8.4 million. Using our sales-based market value ($5.8 million per unit) for the building, 101 CPW has an effective tax rate for of 63 cents per $100 of market value in 2012. That’s 19 percent less than the city-wide average effective tax rate of 78 cents per $100 of market value for the one- to three-family homes—before applying the coop and condo abatement. With the coop and condo abatement, apartment owners at 101 Central Park West have an effective tax rate of 52 cents per $100 of market value.

As the clock winds down on this year’s legislative session with no bill as yet introduced to make the promised adjustments to what was supposed to be a stopgap measure, it is likely the coop and condo abatement will simply be renewed as it has been before—an outcome with repercussions for the city’s budget. The $260 million in revenue foregone by providing a benefit for some apartment owners that goes beyond the intended level of tax relief is enough to restore some of the most contentious cuts in the Mayor’s budget for 2013 such as reductions in after-school programs, the subsidy to the city’s libraries, and the closing of 20 fire companies.

As Rental Subsidies for Families End, Time in Shelter Grows

Posted By Elizabeth Brown, February 23, 2012

February marks the first month that the city will not pay subsidies for families who signed leases under the Advantage rental assistance program. The city officially eliminated Advantage nearly a year ago after Governor Cuomo ended state support for the program, leaving the city without a plan to move families out of homeless shelters and into permanent housing. While no new families have entered the program in almost a year, the city had been under a court order to continue paying the subsidies for families already enrolled—until earlier this month when the order was lifted. The loss of the subsidy jeopardizes the housing of the 8,000 to 9,000 formerly homeless Advantage recipients still in the program. The city’s decision to stop paying the subsidy comes as more families are already staying longer in shelter and follows shortly after Governor Cuomo’s suspension of $15 million in homelessness aid to the city for the next fiscal year as part of his budget proposal.

The city ended Advantage, a rental assistance program that paid a portion of families’ rents for up to two years, when the state withdrew both its funding and the federal match for the program last April. (See Analysis of the Mayor’s Preliminary Budget for 2012 for details.) When advocates for the homeless sued, the city was ordered to continue to subsidize families who had already rented apartments through the program, while the court determined whether the city could stop making payments for these families before their leases end. Although final resolution is pending, in the interim, the order requiring the city to continue payments was lifted earlier this month and the city announced it would not pay the February subsidies. (The case is currently on appeal, the city won in trial court.)

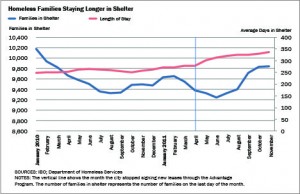
The city had already spent $71 million on the Advantage payments in the first seven months of fiscal year 2012, before the court order was lifted. In addition to these costs, it is likely that the cost of family shelter will now rise. Without an alternate program or change in policies to help families move out of shelter, the length of time that homeless families stay in the city’s shelter system has increased. In the eight months after the city stopped signing new Advantage leases, the average shelter stay for a family was 316 days, nearly two months longer than the average of 258 days during the same eight months in the year before the Advantage program ended. As families stay longer, the total number of families in shelters has also begun to increase in recent months. And now that the city has stopped paying subsidies to former Advantage tenants, some of these families may also return to shelter, which would further drive up city homelessness spending.

This potential increase in shelter costs comes after the suspension of homeless aid from Albany. After the state cut Advantage funding last April, it provided a $15 million grant for a loosely defined new homelessness program in New York City—about a fifth of what the state had spent on Advantage in the prior year. According to the Mayor’s Office of Management and Budget it was largely left up to the city to decide how to use the $15 million, and the city used $10 million of the funds to help pay for the Advantage program’s continuing costs. However, the governor’s most recent budget suspended the homelessness grant for the upcoming state fiscal year noting that, “because the initiative remains under development, additional funding will be suspended pending a determination of the efficacy of the program.”

Thus, the loss of funds from Albany comes when more families are staying longer in the city’s shelter system, and when it is likely that their numbers will continue to increase. Even if the courts decide that the city must pay Advantage subsidies until the end of the remaining tenants’ leases, without a replacement program or policy change the pathway to permanent housing for current and future homeless families remains uncertain.