Category Archives: Economic Development

Next Phase of Hudson Yards May Come With Increasing Costs for the City

Posted by Doug Turetsky, October 3, 2013

The next phase of the Hudson Yards project is beginning to take shape as approvals get underway that will allow the rise of an 80-story office building known as North Tower. But the project’s cost to the city may be rising as well.

On October 10, the New York City Industrial Development Agency plans to hold a public hearing on the proposed tax breaks for the next phase of the project. Since the Hudson Yards plan was first approved in 2005, references to tax abatements focused predominately on the need to spur the office development component of the office, residential, and retail project. Now it appears that in addition to the 20-year tax breaks for the North Tower, the IDA is also set to award a 20-year tax break to the 1.1 million square foot shopping mall to be constructed with an entrance into the new tower.

The Industrial Development Agency estimates the tax abatement for the North Tower and mall will be worth $328 million (in today’s dollars). The value of the tax break for the tower is not separated from that of the mall by the agency since it is being treated as a single entity rather than two distinct developments.

The North Tower and mall will together total 3.8 million square feet, a little more than twice the square footage of the South Tower that is already under construction by Related Companies. Yet the IDA estimated the tax break for the South Tower is worth $106 million—just a third as much as for the North Tower and shopping mall. The rent the mall can command from retailers makes it especially valuable and is apparently driving the difference in the size of the property tax breaks between the two sites.

Providing a property tax abatement for the mall means the city will need to pump more money than previously expected into Hudson Yards to meet the development’s debt service obligations. It also undercuts a shift in city policy away from showering retail projects with tax breaks.

When the Industrial Development Agency, which is administered by the quasi-public Economic Development Corporation, announced its plan for making tax incentives available to spur construction at Hudson Yards, the discussion focused on making the construction of new office space more affordable. Residential and retail components of the Hudson Yards plan were ancillary.

Interim IDA Chairman Joshua J. Sirefman stated in an August 2006 press release describing the agency’s guidelines for awarding tax breaks at Hudson Yards: “The UTEP [Uniform Tax Exemption Policy] amendment provides the framework for financial assistance to overcome the high cost barrier to development that will enable the city to capture demand for new Class A office space and will fuel the continued growth of the city’s economy.”’

The Bloomberg Administration sought to lessen the use of property tax breaks for retail projects with the revamping of the city’s Industrial and Commercial Incentive Program in 2008. But the Industrial Development Agency has substantial leeway to provide tax breaks to the mall if the agency sees fit.

Under the tax exemption policy for Hudson Yards approved by the IDA’s Board of Directors, the mall can qualify for tax abatements if it’s of sufficient size (at least 1 million square feet) or furthering the commercial purposes of the office tower.

Ultimately it boils down to this: it’s up to the development agency to decide. As the guidelines for awarding city tax breaks at Hudson Yards state, the determination of whether a component of the project furthers its commercial purpose is “…in the sole discretion of the Staff.” Likewise, “…it shall be in the Agency’s sole discretion to determine whether the project is of sufficient size and density to qualify [for tax abatements].”

A tax break for the mall means there will be somewhat less money flowing to the Hudson Yards Infrastructure Corporation from new development within the 26-acre Hudson Yards site. The infrastructure corporation, created by the city, issued $3 billion in bonds to pay for the extension of the 7 subway line and to make other improvements aimed at spurring development in the Hudson Yards area.

Under the financing plan for Hudson Yards, all of the money that would typically flow to the city from property tax on the new developments at the site is instead directed to the infrastructure corporation to help pay debt service on the bonds. Because debt service would begin to come due before there was sufficient new revenue to pay the bondholders, the city was temporarily on the hook to make the payments. As the project proceeded and development picked up, city officials expected that Hudson Yards would increasingly generate the funds needed to make the annual debt payments on the borrowed money.

It hasn’t worked as planned. The pace of new development has been slower than expected, forcing the city to spend more of its own funds. A report by IBO’s Sean Campion found that from 2006 through 2012, Hudson Yards produced only $170 million in tax and fee revenues from development—$113 million less than anticipated by project planners. In the early years, interest earnings from investing the bond proceeds offset some of the shortfall but those have now dried up. Over the seven-year period, the city has provided the infrastructure corporation with $374 million in funding for debt service and other needs.

Giving up tax revenue that would have come from the shopping mall means the city’s tab will continue to grow.
The More Things Change, the More They Stay the Same: Richest and Poorest NYC Census Tracts, 2000 & 2011

Posted by Doug Turetsky, September 24, 2013

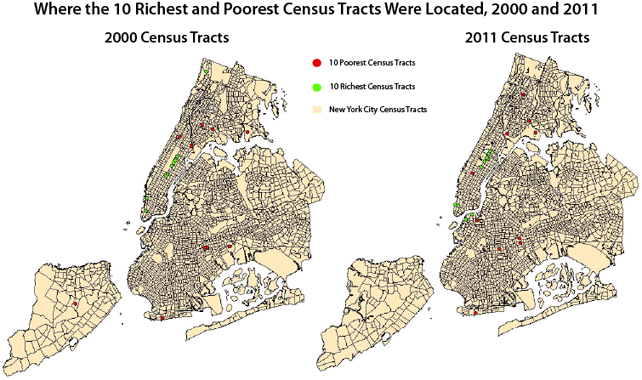
New York has often been characterized as a city of contrasts, especially when it comes to wealth and poverty. To get an idea of how those contrasts may have changed over the past decade, IBO took a look at where the 10 highest and lowest income census tracts in the city were located in 2000 and 2011 based on the median household incomes in those tracts.

2013censustractmapbMap created by Nashla Salas

Looking at these top 10, bottom 10 compilations, a few observations can be made that are both telling and not wholly unexpected: wealth tends to be geographically concentrated in New York City, poverty more dispersed. While median household incomes in 2011 for the city’s highest income census tract in 2011 is still below 2000 levels (when adjusted for inflation), the gulf between rich and poor remains large.

IBO’s Julie Anna Golebiewski compiled the lists of highest and lowest income census tracts using the 2000 Census and the 2011 American Community Survey five-year estimates. Census tracts vary in size both spatially and in number of residents, though the U.S. Census Bureau aims for census tracts to contain about 4,000 people and are initially drawn to encompass a demographically homogenous population. To aid our comparison, all incomes from 2000 are expressed in 2011 dollars.

Based on our lists of poorest census tracts, concentrations of poverty are dispersed through most of the city. In 2000, 4 of the 10 lowest income census tracts were in Brooklyn, another three in the Bronx, two in Manhattan, and one in Staten Island. Only one neighborhood, Brownsville in Brooklyn with 2 of the 10 poorest census tracts, contained more than one of the poorest tracts in 2000. A decade later, 5 of the 10 poorest census tracts were located in Brooklyn, four in the Bronx, and one in Manhattan. The geographic dispersion narrowed a bit more with two of the lowest income census tracts still in Brownsville and two others in Hunts Point.

Conversely, the city’s extreme wealth is concentrated in relatively few neighborhoods. In 2000, 9 of the 10 highest income census tracts in the city were located in Manhattan—the one tract outside of Manhattan was in the Riverdale/Fieldston section of the Bronx. This geographic concentration of wealth becomes clearer with the observation that five of those highest income census tracts were located on the Upper East Side. In 2011, the story was similar. Eight of the 10 wealthiest census tracts were located in Manhattan, six of them on the Upper East Side.

One significant geographic change was that two Brooklyn census tracts muscled into the 2011 top 10 list—one in Brooklyn Heights, the other in DUMBO—where none had made it in 2000. Over the decade, median household income grew by more than 45 percent in each of these census tracts. In Battery Park City, another newcomer to the top 10 list in 2011, median household income increased by more than 25 percent during the years 2000-2011.

Moving past locational differences, the contrasts in wealth and poverty become even starker when viewed in terms of dollars and cents. In 2000, median household income in the wealthiest census tract, located in Midtown Manhattan (just southeast of Central Park), was $256,100. The poorest census tract, located in the Bronx’s Hunts Point, had a median household income of $9,600. That’s a gap of more than $246,000 between median incomes in the city’s wealthiest and poorest districts. Or to put it another way, median household income in the Midtown tract was more than 25 times that of the Hunts Point tract in 2000.

Between 2000 and 2011, median household income in the richest census tract declined, as it did for the city as a whole. Over the same period, median household income remained roughly constant in the poorest census tract and the income gulf between the richest and poorest tracts narrowed slightly.

The wealthiest census tract in 2011, located in Manhattan’s Upper East Side, had a median household income of $247,200. In comparison, the poorest census tract, located in Coney Island, Brooklyn had a median household income of $9,500. The difference in median household incomes between the two census tracts was over $237,000, meaning the city’s richest census tract still had a median income 25 times higher than the lowest income tract.

While New York’s highest income areas in 2011 may have been a little less well off than the highest income areas in 2000, a yawning gap remained between the richest and poorest sections of the city.

Operator of Yankee Stadium Parking System Strikes Out: With Bonds in Default and Growing Debt to the City, Company Issued Request for Proposals to Redevelop Two Lots

Posted by Doug Turetsky, July 11, 2013

In 1970, Joni Mitchell famously sang about tearing down paradise to put up a parking lot. More than 40 years later, it looks like a financially troubled set of parking lots and garages built in conjunction with the new Yankee Stadium will add a different twist to Mitchell’s refrain.

The parking system, which contains nearly 9,300 spaces, was built with substantial public subsidies, including $238 million in tax-exempt bonds and direct subsidies of $70 million from the state and $39 million from the city. Additionally, about 3 acres were removed from use as city parkland and leased by the city to the parking system. Use of the garages and lots has been well below expectation and the parking system has not generated sufficient revenue to make recent payments to bondholders.

With the Bronx Parking Development Company, which runs the parking system, in default and in need of new revenue, a request for proposals was issued to sublease and redevelop two lots near Yankee Stadium. The responses were due June 5 to the Bronx parking company. Edward Moran, who was hired to restructure the parking company, did not respond to two e-mail requests and a follow-up phone call for information about the number of proposals received and when a selection is expected to be made.

A payment of $6.9 million was due bondholders April 1. The last payment made was in October, when the company drained much of its reserve fund to meet its obligation to bondholders. While the bonds were issued by the city’s Industrial Development Agency, the city is technically not responsible for repaying the bondholders.

Yet the city may still lose on the deal. The Bronx parking company has not paid the city any of the $3.2 million in annual rent that has been due since January 2008 nor has it made any of the required payments in lieu of taxes. Under the terms of the lease with the Bronx Parking Development Company, money owed to the city takes a back seat to payments to bondholders if revenues are insufficient to cover both.

In October 2012, it was reported that the parking company owed the city $25.5 million. City financial documents that IBO receives do not specify how much is currently owed by the Bronx parking company. Neither Moran nor the Mayor’s Office of Management and Budget responded to several requests for this information.

Although the Yankees demanded a parking system able to hold about 8,700 cars plus 600 for its own use—more parking spots than were available for the old stadium even though the new stadium holds about 6,600 fewer fans—the team itself bears no financial responsibility for the garages and lots.

Even on game days, use of the Bronx parking company’s system has been much lower than expected. A number of factors contribute to this, not the least of which is cost. The price for parking at the system’s garages and lots is higher than at the old stadium, and on game days can run as much as $48 for valet parking. There are cheaper parking alternatives nearby at the Gateway Mall and more fans are taking public transit to the game than in the past, especially after the opening of the new Metro-North railway station in 2009. Ironically, the recent request for proposals to redevelop the lots on 151st Street between River and Gerard Avenues touts the site’s easy accessibility by public transportation as a prime selling point.

Last March, City Comptroller John Liu issued an audit report critical of a number of Industrial Development Agency deals, including the one with Bronx Parking Development Company. The Comptroller’s office contended that the projections of revenue from the parking system “…were based on questionable occupancy rates and inflated attendance figures and did not account for demand fluctuations that would result from price increases and competition.”

While the default sparked the effort to redevelop two of the lots and bring in more revenue for the fiscally challenged parking company, it has also brought some new players into the saga of the parking system—including a major proponent of building a new stadium for the Yankees. Creditors hired Bracewell & Giuliani, the firm of former Mayor Rudolph Giuliani, to represent them in negotiations with Bronx Parking Development Company. The parking company agreed to pick up the tab for Bracewell & Giuliani and has budgeted $240,000 in 2013 to pay the Mayor’s firm.

But none of the expected $7.1 million in parking company operating expenditures this year include rent or payments in lieu of taxes owed to the city. As the saying goes, wait till next year.

Seas Rise, Storms Surge, and NYC Presses Ahead with Waterfront Development Projects

Posted by Doug Turetsky, November 21, 2012

Long before Sandy slammed the city’s coastline, the Bloomberg Administration had been sounding alarms about coming threats to the city due to climate change. In well-known reports such as PlaNYC and through less publicized efforts such as the convening of scientists and risk management experts for the New York City Panel on Climate Change, the Bloomberg Administration signaled that it clearly recognized the significant impact global warming and rising sea levels could have on New York.

Photo credit: flickr/drpavloff

The Mayor’s March 2011 report Vision 2020: New York City Comprehensive Waterfront Plan forecast the coming of storms like Sandy and the potential affects: “The rise in sea level and increased frequency and magnitude of coastal storms will likely cause more frequent coastal flooding and inundation of coastal wetlands as well as erosion of beaches, dunes, and bluffs.” A few weeks later, in an update to PlaNYC, the warnings were reinforced: “As a city with 520 miles of coastline—the most of any city in America—the potential for more frequent and intense coastal storms with increased impacts due to a rise in sea level is a serious threat to New York City.”

Yet even as City Hall grappled with these concerns it continued to put substantial resources into major development projects on the waterfront, rezoning sites as manufacturing declined— including some in prime areas for flooding, the so-called Zone A evacuation areas. Just one month before Sandy struck the city, Mayor Bloomberg announced a plan by private developers to build a $500 million complex on city-owned land on Staten Island’s North Shore that would include the world’s largest Ferris wheel as well as a hotel and outlet mall. Part of the site sits in a floodplain.

An even larger development project is planned on the Coney Island waterfront, one of the neighborhoods hardest hit by Sandy. The city has rezoned the area to allow the development of hotels, housing, and a new amusement park, and has allocated more than $400 million for sewer upgrades, land acquisition, lighting, boardwalk and park improvements, and other projects to foster the redevelopment plan. On the Queens waterfront, the city is investing $147 million in the Hunters Point South project, which also sits in Zone A. Already under construction, Hunters Point South includes 5,000 apartments, a 1,100-seat school, and retail space.

To be fair, the Bloomberg Administration has taken steps to protect the city from the affects of rising sea levels and storm surges, following existing city building codes and Federal Emergency Management Agency guidelines. But these guidelines may not be adequate in the face of storms with the fury of Sandy.

As Yale University’s Environment 360 Web site noted, “The storm easily overwhelmed many of the relatively minor adaptations that New York had already put in place.” For example, Brooklyn Bridge Park, where another large development project is planned, was created with what are called “soft edges.” These are supposed to help reduce the force of waves and accommodate rising tidal levels. While these edges may work in many instances, they were no match for Sandy, which swamped the park and sent water lapping at the structure housing the newly installed carousel.

In Sandy’s wake, Governor Andrew Cuomo, Mayor Bloomberg, and Council Speaker Christine Quinn are promising to ramp up efforts to protect the city and the city’s infrastructure from what many believe is the increasing threat posed by major storms. Speaking to a group of business and civic leaders, Council Speaker Quinn said, “We…must rethink the way we build in neighborhoods that were destroyed by the storm.”

Such rethinking takes time for evaluation and planning, time that some city officials and developers seem disinclined to take. Just last week, as many Staten Island residents and business owners continued to clear the rubble from Sandy—and mourned the loss of family and friends—the city’s Economic Development Corporation held a hearing to advance the Ferris wheel project on the North Shore.

The city can press ahead with waterfront projects like the one on Staten Island’s North Shore, as well as others throughout the five boroughs, before there is a clearer plan for the kinds of steps New York will take to minimize the danger from future Sandys. But doing so increases the risk that the next “superstorm” will exact an even higher price tag.

Sandy’s Aftermath: How Much Federal Aid Can the City Expect?

Posted by Doug Turetsky, November 8, 2012

In the decade since the terrorist attacks on 9/11, New York City has faced several other disasters that drew federal aid, such as last year’s Tropical Storm Irene and the blizzard and tornadoes of 2010. As IBO’s George Sweeting points out, the city received federal aid for a far wider range of uses in the aftermath of 9/11 than it did following the weather-related events.

While Hurricane Sandy shares the climatic origins of Irene, the blizzard, and tornadoes, the extent of the physical devastation is more akin to 9/11. The number of lives lost due to Sandy, while tragic, paled in comparison to the World Trade Center attacks. But the widespread devastation in the wake of Sandy —from large swaths of Staten Island to the Rockaways to Coney Island, and once again, Lower Manhattan—has a price tag that puts it in a league with 9/11. Moody’s Analytics has estimated a cost of $12 billion for the New York City area.

[UPDATE: Gov. Andrew Cuomo estimated today that losses due to Hurricane Sandy could total $33 billion in New York State.]

The question for the coming days and weeks for New York City and other hard-hit areas is: Will federal disaster relief have the more limited scope of the typical response after a serious storm or will Washington respond with much broader types of aid as it did following 9/11?

Federal aid in the wake of storms usually has one fundamental component: emergency response and recovery. This immediate assistance may include rescue effort; emergency food and shelter; low-interest loans to residents and small businesses; unemployment payments; the cleanup of debris; and repair of damaged infrastructure such as roads, buildings, equipment, parks, and utilities. The $20.5 billion in aid provided after the attacks on the World Trade Center featured two other significant components: assistance for additional rebuilding and development and substantial budget relief for the city to make up for expectations of lost tax revenues.

The aid for rebuilding and development after 9/11 was substantial, totaling $11.3 billion in direct assistance and tax breaks. A large portion of this was dedicated to transportation projects such as the approximately $4 billion World Trade Center Transportation Hub and $530 million for the now Sandy-flooded South Ferry subway station. For a more detailed look at World Trade Center-related aid, see this IBO report. Washington also authorized lower-cost financing for development projects through the creation of tax-exempt Liberty Bonds estimated to cost the federal government $1.2 billion in foregone tax revenue. The use of these bonds became controversial as some were directed towards projects such as the new Goldman Sachs office downtown as well as the Bank of America building in midtown and the Bank of New York tower in Brooklyn. Good Jobs New York, a nonprofit that monitors local economic development deals, has already raised concerns about how decisions will be made if wide-ranging rebuilding aid comes the city’s way as part of Sandy relief.

Post-9/11 assistance also included nearly $2 billion in budget aid mostly for the city (a portion of this amount was for the state). About half of this aid came through a provision that allowed the city to refinance some of its tax-exempt bonds and as a result reduce its spending on debt service. The other half materialized when expenditures for the initial emergency response and cleanup turned out not to cost as much as expected; the city just got to keep the money.

Federal aid following the September 2010 tornadoes was typical of the sorts of aid that follow natural disasters. The cost of cleaning up and repairing the damage from the storm was $21.2 million. The Federal Emergency Management Agency provided $10.8 million, the state $1.8 million. The rest was on the city’s dime. That was also the year of the blizzard that paralyzed the city in the days after Christmas. Washington only provided some disaster aid to cover costs in Staten Island. Coupled with the costs of several other big storms, the city spent more than $100 million that fiscal year on snow removal and related road repairs, the vast majority at our expense. For more details on weather-related costs in fiscal year 2011, see this report, pg 49. Damage from last year’s Tropical Storm Irene cost the city about $55 million, with 90 percent of the expenses eligible for federal reimbursement.

With the dust still settling from Tuesday’s election, it remains to be seen how extensive federal aid for Sandy will be. A $12 billion proposal to supplement federal disaster cleanup and recovery funds has been introduced in the House, but the Senate appears to be waiting for updated estimates on the extent of the damage before it acts. Neither the House nor the Senate seems to be discussing the kind of broader aid that followed 9/11.

Living Wage, Again

Posted by Doug Turetsky, November 30, 2011

Amid the uproar during the past few weeks over the proposed living wage law there’s one important point that you might have missed: the city already has a living-wage law. Its rules cover thousands of workers employed under more than $1 billion worth of contracts with the city.

In fact, New York City had one of the first living-wage laws in the country, though the city’s first bill covered just a couple thousand workers. Passed in 1996, over the veto of then-Mayor Rudolph Giuliani, the legislation was championed by advocacy organizations such as the Industrial Areas Foundation as well as local unions. It required that private firms contracting with the city to provide food services, security guards, cleaners, and temporary office workers pay their employees a living wage that ranged at the time from about $7.25 to $12 an hour.

The number and type of workers covered by the city’s living-wage rules expanded in 2002 when Mayor Michael Bloomberg signed a law that extended living-wage provisions to home health care and child care workers whose agencies had contracts with the city. The Brennan Center at New York University estimated that under the new requirements the pay of 50,000 home health care workers would rise immediately and later the pay of up to 9,000 child care workers. Shortly after the law went into effect, Steve Malanga wrote ruefully in City Journal, “Thanks to Mayor Bloomberg, New York will now have the largest number of workers covered by any living-wage law in the nation.” For a complete list of covered workers and wage rates, click here.

The proposed living-wage bill now garnering so much attention moves away from a focus on city contracts for services and instead aims at economic development projects. The bill would cover all workers in projects that receive certain public subsidies worth $1 million or more. But it would exempt from its wage rules businesses with revenues of less than $5 million a year, all manufacturing firms, and nonprofits. IBO’s George Sweeting submitted testimony to last week’s City Council hearing on the proposed bill in which he said about six or seven projects a year would be affected by the proposed rules, based on the economic development projects subsidized by the city in 2002-2008.

That’s a small number compared with the 437 contracts the city signed in fiscal year 2011 that are subject to the existing living-wage law. These contracts were valued at $533 million, according to an annual report by the Mayor’s Office of Contract Services. Over the past four fiscal years, the city has signed nearly 1,100 contracts worth more than $1.5 billion that must comply with living-wage rules.

Too bad so much of the debate that continues to simmer on the new living-wage bill largely ignores the fact that the city already has a fairly significant commitment to living-wage provisions. Maybe the $1 million shelled out by the city’s Economic Development Corporation for a study of the potential effects of a living-wage law would have benefitted by looking at what’s happened under the rules that already exist here.

The Big, and Small, Stall in Construction Projects

Posted by Kerry Spitzer, September 21, 2009

One clear sign of the city’s real estate downturn is the abundance of sites where the construction of apartments or commercial space has come to an abrupt stop. City officials are concerned that many of these sites pose a public safety hazard. But some also see a potential opportunity to use these projects as a resource for affordable housing.

This summer, the Department of Buildings began posting a weekly list of sites where construction has stalled. The sites have been mapped by several news sources (see Times and WNYC). IBO recently matched the department’s August 2, 2009 list of stalled sites to the department’s Building Information Services permits file and reviewed what types of buildings developers had underway. Because buildings are added or removed from the list on a weekly basis, the data offer only a snapshot at a point in time. Regardless, the list may understate the extent of the problem; as some real estate observers have pointed out, several large projects are not listed. Nonetheless, it provides some insight into the kind of projects that have been stalled and the diversity of approaches that may be needed if public officials want to jump start construction at these sites.

On August 2, 2009, the list contained 398 unique sites, roughly three-quarters of which were in Brooklyn and Queens. In total, 44 percent of the sites were in Brooklyn, 32 percent in Queens, 15 percent in Manhattan, 5 percent in the Bronx, and 4 percent in Staten Island.

Eighty-one percent of the sites were residential. These 305 sites were to produce 6,741 units of housing—apartments and one-to three-family homes. Among the rest of the stalled construction sites, 15 percent (57 sites) had been planned for commercial use and 3 percent (12 sites) were proposed for hotel or other kinds of transient occupancy. (Twenty-four of the records did not include occupancy data.)

Reading press coverage about the stalled projects, one could come away with the impression that all or most of the sites are large luxury condo developments in Williamsburg and other up-and-coming neighborhoods. While the Greenpoint and Williamsburg areas have the highest concentration of stalled projects—with over 42 of the 305 stalled residential sites and 971 of the units—in fact, most of the projects are fairly small, with less than 10 units. And over one-third (40 percent) of the stalled residential developments are one- to three-family homes.

Even though many projects have 10 or fewer units, the majority of units are in larger developments. Seven percent of the sites (20 projects) account for nearly 50 percent of the planned units (3,290). The largest stalled site is on Manhattan’s far West Side at 605 West 42nd Street, which was expected to include 764 units. The Hudson Yards and Clinton neighborhoods of Manhattan have only a half-dozen stalled residential sites, but they contain a large share of the proposed units —1,046 units or 16 percent of the total. Other areas that have a concentration of moderately sized projects include: East Harlem, Lower Manhattan, the Rockaways, Clinton Hill, Downtown Brooklyn, Prospect Heights, and Prospect-Lefferts Garden. In contrast, South East Queens (Community District 12 and the southern half of Community District 13) contains roughly 35 developments and just over 65 units.

Some policymakers consider these stalled sites an opportunity for the city to further its affordable housing goals. As city and state officials consider programmatic options, focus could easily fall on just the big sites where more units could be leveraged in each deal, perhaps at a lower cost per unit than at smaller sites, and developers are likely to be more experienced at navigating public programs.

But there is also reason to focus on the sites with fewer units, many of which are in neighborhoods already considered distressed. For example, all 39 of the stalled residential developments located in census tracts defined by the federal Department of Housing and Urban Development as distressed are one- to three-family homes. Stalled projects in distressed neighborhoods are of particular concern because they threaten to increase the likelihood of abandonment and vandalism in areas already hit by foreclosures.

Quiet on the Set?

Posted by Eldar Beiseitov, August 19, 2009

Shooting movies and television programs in New York City has always been expensive. At the end of June, it became even more expensive. That’s when the city’s program that provided tax credits for qualified film and television production ran out of money.

This, and uncertainty about the renewal of a similar New York State tax credit, which had also run out of money, may have been factors in the decision by Warner Brothers Television in February to move Fox’s hit series “Fringe” from New York to Vancouver for next season. Currently, it is filmed in Long Island City. (Back in 2008, NBC’s “Ugly Betty” moved from California to New York, to take advantage of our tax credit.)

From 2005 until it ran out of money, the city offered a Film Production Tax Credit program, with eligible film and television productions receiving a fully refundable tax credit equal to 5 percent of qualified production expenses. While many states, including New York, provide similar incentives, New York City is the only U.S. municipality that has had such a program.

The city’s film credit program was funded at $12.5 million in 2005 and then $30 million annually through 2011, but funding could be shifted from future years if needed for eligible productions until the total allocation of $192.5 million was reached. Now, with three years to go, all the money has already been committed.

Certain categories of productions are not covered by the program, including documentaries, news or current affairs programs, interview or talk shows, instructional videos, sport shows or events, and daytime soap operas. Similarly, while qualified expenses include costs of technical and crew production and expenditures for facilities, props, makeup, and wardrobe, the program excludes costs of stories and scripts, and wages for writers, directors, producers and performers.

The State of New York also offers production companies a similarly structured but much larger tax credit—30 percent—for filming in the state. When combined, the city and state refundable tax credits total 35 percent of eligible production costs for qualified feature films, television pilots, and television movies and miniseries.

Unlike many tax credits, which are available to all qualifying taxpayers regardless of the aggregate cost of the program, the city and state film credits are capped which means that once the authorized total spending for the program is reached, no new benefits are available, even for projects that would otherwise qualify. With both the state and the city tax credits maxed out, studio owners warned that New York had become a much less attractive place for film production. When the state adopted its budget for the 2009-2010 fiscal year, which began in April, the state credit was funded for an additional year.

Last May the Bloomberg Administration submitted to Albany a proposal to authorize additional funds for the city tax credit through 2011, at lower rates and with limits on how long television productions can receive the credit. Under the proposal, the program would receive $24 million annually through 2011 in additional city funding on top of the funds already committed. Projects that do 75 percent of their work in the city would receive a 4 percent tax credit, down from 5 percent.

Television shows would get the full 4 percent for three years, but the credit would drop to 3 percent in the fourth year and to 2 percent the following year. Also, the proposed legislation would set a $250,000 cap for each qualified production.

Whether tax credits are effective is the subject of some debate. A study by the Federal Reserve Bank of Boston of a similar program in Connecticut evaluated the tax credits’ costs and benefits in 2009, and concluded that the credit does not pay for itself, meaning that new tax revenues generated by the production did not offset the cost of the credit.

On the other hand, a 2009 study by Ernst & Young, prepared at the request of the New York State Governor’s Office of Motion Picture and Television Development and the Motion Picture Association of America, concluded that the state’s tax credit did pay for itself, while another Ernst &Young study prepared for New Mexico reached the same conclusion. A recent publication by the Boston Fed explores why the findings of these studies diverge so widely.

Swinging at the Wrong Pitch

Posted by George Sweeting, January 29, 2009

Much of the outcry over the recent vote to give the Yankees (and Mets) a second helping of tax-exempt bond financing for their new stadiums overshadowed the most important issue: would the public investment in the stadiums pay off? At times it seemed like a public policy version of an infielder holding the ball and arguing with an ump over whether a hit was fair or foul while base runners scored uncontested.

In the days leading up to the Industrial Development Agency’s vote on the financing, lots of attention focused on the question of the so-called PILOTs—payments in lieu of taxes— and if these dollars, which would be used to pay debt service on the tax-free bonds, should be counted as lost revenue to the city. It’s an important question, but not the one that ultimately determines who wins and who loses on the stadium deals.

In terms of the PILOTs, IBO concluded that since the current stadiums don’t pay property taxes, the fact that the new deals also leave the new stadiums tax exempt means there’s no new loss of revenue. The debt service payments are being called PILOTs in a creative dance around prohibitions against using tax-exempt financing for sports facilities that were enacted by Congress in 1986 under the sponsorship of Senator Daniel Patrick Moynihan. Absent the need to squeeze through a loophole in the IRS regulations—since closed—the payments probably wouldn’t have been called PILOTs and there would be little question that they are not really property tax payments.

What went largely unexamined leading up to the IDA vote was whether the tax revenues generated from the construction and operation of the new stadium would exceed the value of the public subsidies. Because such estimates are very dependent on the assumptions used, they should be accompanied by full disclosure so that decision-makers and the public can assess the reasonableness of the estimates. Unfortunately, we saw little evidence of such transparency.

When IBO asked the Industrial Development Agency for information about how the benefit estimates it cited were derived, we were told that the city’s staff was too busy. But they could get back to us later—after the vote.

Consider that the city’s Industrial Development Agency asserted that the benefits from the new Yankee Stadium will amount to $438 million, exceeding their estimate of the cost to taxpayers by $60 million. From the little information that was made public, it appears this might have resulted from some generous official scoring. The Yankees expect to draw the same 4 million fans in the new stadium as they did in the old one. And it’s unlikely that fans in 2009 will eat, drink, and buy Yankee regalia in much greater quantities than those who filled the stands in 2008. So besides the construction activity there’s little obvious reason to believe the new stadium will deliver much in the way of new jobs and tax revenue.

Spring training, a time when all fans are filled with hope for the upcoming season, is just a few weeks away. So let’s hope that consideration of future requests for taxpayer assistance for sports facilities and other big projects will provide greater detail on the claimed benefits. That detail will help all of us consider whether the public subsidies are a home run—or a strikeout—for the taxpayer.