Posted by Doug Turetsky, September 24, 2013
New York has often been characterized as a city of contrasts, especially when it comes to wealth and poverty. To get an idea of how those contrasts may have changed over the past decade, IBO took a look at where the 10 highest and lowest income census tracts in the city were located in 2000 and 2011 based on the median household incomes in those tracts.
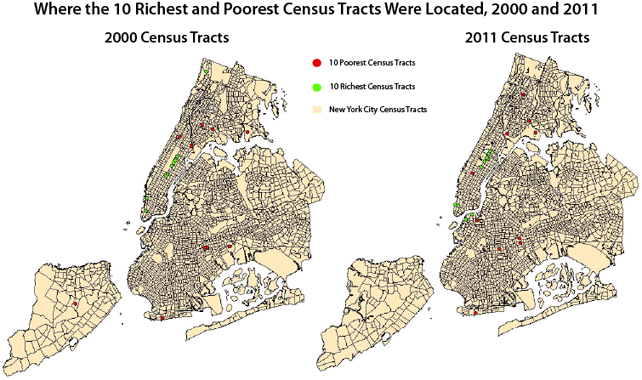 Map created by Nashla Salas
Looking at these top 10, bottom 10 compilations, a few observations can be made that are both telling and not wholly unexpected: wealth tends to be geographically concentrated in New York City, poverty more dispersed. While median household incomes in 2011 for the city’s highest income census tract in 2011 is still below 2000 levels (when adjusted for inflation), the gulf between rich and poor remains large.
IBO’s Julie Anna Golebiewski compiled the lists of highest and lowest income census tracts using the 2000 Census and the 2011 American Community Survey five-year estimates. Census tracts vary in size both spatially and in number of residents, though the U.S. Census Bureau aims for census tracts to contain about 4,000 people and are initially drawn to encompass a demographically homogenous population. To aid our comparison, all incomes from 2000 are expressed in 2011 dollars.
Based on our lists of poorest census tracts, concentrations of poverty are dispersed through most of the city. In 2000, 4 of the 10 lowest income census tracts were in Brooklyn, another three in the Bronx, two in Manhattan, and one in Staten Island. Only one neighborhood, Brownsville in Brooklyn with 2 of the 10 poorest census tracts, contained more than one of the poorest tracts in 2000. A decade later, 5 of the 10 poorest census tracts were located in Brooklyn, four in the Bronx, and one in Manhattan. The geographic dispersion narrowed a bit more with two of the lowest income census tracts still in Brownsville and two others in Hunts Point.
Conversely, the city’s extreme wealth is concentrated in relatively few neighborhoods. In 2000, 9 of the 10 highest income census tracts in the city were located in Manhattan—the one tract outside of Manhattan was in the Riverdale/Fieldston section of the Bronx. This geographic concentration of wealth becomes clearer with the observation that five of those highest income census tracts were located on the Upper East Side. In 2011, the story was similar. Eight of the 10 wealthiest census tracts were located in Manhattan, six of them on the Upper East Side.
One significant geographic change was that two Brooklyn census tracts muscled into the 2011 top 10 list—one in Brooklyn Heights, the other in DUMBO—where none had made it in 2000. Over the decade, median household income grew by more than 45 percent in each of these census tracts. In Battery Park City, another newcomer to the top 10 list in 2011, median household income increased by more than 25 percent during the years 2000-2011.
Moving past locational differences, the contrasts in wealth and poverty become even starker when viewed in terms of dollars and cents. In 2000, median household income in the wealthiest census tract, located in Midtown Manhattan (just southeast of Central Park), was $256,100. The poorest census tract, located in the Bronx’s Hunts Point, had a median household income of $9,600. That’s a gap of more than $246,000 between median incomes in the city’s wealthiest and poorest districts. Or to put it another way, median household income in the Midtown tract was more than 25 times that of the Hunts Point tract in 2000.
Between 2000 and 2011, median household income in the richest census tract declined, as it did for the city as a whole. Over the same period, median household income remained roughly constant in the poorest census tract and the income gulf between the richest and poorest tracts narrowed slightly.
The wealthiest census tract in 2011, located in Manhattan’s Upper East Side, had a median household income of $247,200. In comparison, the poorest census tract, located in Coney Island, Brooklyn had a median household income of $9,500. The difference in median household incomes between the two census tracts was over $237,000, meaning the city’s richest census tract still had a median income 25 times higher than the lowest income tract.
While New York’s highest income areas in 2011 may have been a little less well off than the highest income areas in 2000, a yawning gap remained between the richest and poorest sections of the city.