Category Archives: Municipal Labor

Report on Pay, Demographics of Municipal Workforce Slips From Sight on Bloomberg Administration’s Last Day

Posted by Doug Turetsky. February 5, 2014

A little noticed report, prepared by the Department of Citywide Administrative Services and the Mayor’s Office of Operations and released on the Bloomberg Administration’s last day in office, looks at changes in the compensation and composition of the municipal workforce over the past decade. The report, which is not available on the city’s website but IBO provides here could fuel arguments on both sides of the negotiations to settle the city’s expired labor contracts.

According to the report, the median base salary, which doesn’t include overtime, pension, or fringe benefit costs, for full-time city employees in fiscal year 2012 was $65,299. That’s relatively little-changed from an inflation-adjusted median salary of $64,698 in 2003, Mayor Bloomberg’s first full fiscal year in office. As the report states, “Median [inflation-adjusted] salaries have remained stable over the past ten years, ranging from a low of $59,000 in 2005 to a high of $66,000 in Fiscal 2010.”

While union leaders may look at those numbers and see fodder for arguing that salaries for municipal workers barely stayed ahead of inflation over that 10-year period, that small gain might look pretty good to a large share of the rest of the city. For city residents as a whole, median earnings adjusted for inflation have not yet rebounded to their 2005 level. Median citywide earnings in 2005 were $37,091 and just $34,019 in 2012, according to Census Bureau figures compiled by IBO’s Julie Anna Golebiewski.

The report, New York City Government Workforce Profile Report, covers 39 agencies with nearly 327,800 full-time and full-time equivalent employees. The report includes all the city agencies that report to the Mayor along with the Health and Hospitals Corporation and New York City Housing Authority, even though these two are technically not city agencies. So that means agencies such as IBO and the Campaign Finance Board and employees of other elected officials are not included.

Overall, nearly one-third of the city’s full-time workforce—about 100,000 employees— had base salaries of $50,000 or less in 2012. On the other end of the salary scale, 9 percent of the municipal workforce—about 27,000 staffers—had base salaries of $100,000 or more.

On the agency level, median base salaries also varied. The very highest was the School Construction Authority, where the median base salary for its staff of 660 was $100,400. The uniformed services tended to have substantially higher median salaries than workers in other agencies. At $76,488, the median salaries for the police, fire, and correction departments outstripped the 2012 citywide median. The sanitation department, with a median salary of $69,339 was nearer the median for all city employees.

Conversely, a number of agencies had median base salaries well below the citywide level. The Taxi and Limousine Commission’s 460 full- and full-time equivalent employees had a median salary of $39,205 in 2012. They were followed closely by the housing authority’s 11,500 staff members with a median salary of $40,624.

In addition to information on salaries, the report provides numerous demographic details on the city’s workforce—from gender and racial and ethnic profiles of agencies and various occupational categories to information on employees’ average years of city service, civil service status, and eligibility for retirement. The report’s intent is clearly stated up front: “The goal of this report is to make New York City’s municipal workforce…transparent to the people it serves, and to provide interested parties with the personnel data needed for analysis and planning.”
Somehow that goal of transparency faded away in the waning hours of the Bloomberg Administration and this report—covering the city’s single largest expense, about $37 billion annually on its workforce—went largely unseen.
Cutting the City’s Billion Dollar Spending on Overtime May be Easier Said than Done

Posted by Doug Turetsky, October 4, 2012

With the Mayor asking city agencies to come up with $2.0 billion in proposed budget cuts for the next year and a half, one area that could come under scrutiny is overtime spending. In fiscal year 2012, which ended June 30, the city spent about $280 million more on overtime pay than it did five years ago.

Somewhat surprisingly, at least in recent years, the growth in overtime spending bears little relation to changes in the size of the city’s workforce. Over the past five years, the number of full-time city workers has waxed and waned with the ups and downs of the local economy. In fiscal year 2007, there were 270,839 municipal workers as of June 30, 2007. A year later, there were 280,649. By June 30, 2012, the number was 270,795 (the June 2012 projection by the Mayor’s Office of Management and Budget), virtually the same as in 2007. Still, over those five years citywide overtime spending climbed steadily: from $989 million to nearly $1.3 billion.

About two-thirds of all overtime spending is generated by just a handful of agencies, the so-called uniformed forces: the police, fire, correction, and sanitation departments. Uniformed workers in these agencies collected $933.6 million in overtime pay last year.

Likewise, virtually all the growth in overtime spending has occurred among these same agencies. Since 2007, overtime spending by all city agencies on “civilian” employees (including civilian employees within the uniformed forces) grew by a modest $3.9 million, with some agencies spending more and others less.

There are a variety of factors that can drive overtime spending, some of which are unique to particular agencies and not entirely under the agencies’ control. The police department is responsible for the biggest share of the city’s overtime costs—$519.1 million for uniformed officers in 2012. This overtime is the result of a number of factors ranging from arrests and time spent in court to ongoing investigations to unplanned events (for example, Occupy Wall Street, presidential visits, one-time concerts) and planned events (such as annual street fairs, walkathons, and parades). See “IBO’s Police Overtime: Tracking the Big Growth in Spending” for more on types of police overtime spending.

Snowfall can cause sanitation department overtime to pile up. In 2011, more than 61 inches of snow fell on the city and sanitation workers earned $62.4 million in overtime pay to clean it up. Last winter, with less than 7 inches of snow, snow-related overtime melted to a modest $7.2 million.

Declining staff levels at an agency can lead to rising overtime costs. With hiring on hold at the fire department due to a discrimination lawsuit, overtime has soared. As retirees were not replaced, firefighter staffing fell from 11,459 in 2009 to 10,260 in 2012 and overtime spending grew from $127.6 million to $230.8 million over the same period. Despite the falloff in the number of firefighters, fire houses still have to be staffed around the clock to provide a constant level of services. With the judge on the lawsuit now allowing the city to hire more firefighters, the department’s overtime spending should decline as new recruits graduate from the fire academy.

While the fire department used increased overtime spending in order to maintain services in the face of diminished staffing, the parks department cut staffing and increased overtime spending to achieve overall budget savings—savings that may also affect the level of services delivered. Parks department full-time staffing fell by about 430 in 2012 to 2,920, while overtime spending increased by $1.2 million to $8.7 million. That’s about $2,700 in additional overtime spending for each staff member lost, an amount well below the cost of salary and benefits for a full-time employee. Of course, that doesn’t mean all the work done by the former staff members is being accomplished on overtime—budget savings by cutting personnel may also be accompanied by service declines.

Conversely, even when staffing levels rise, agency overtime spending may increase. Civilian full-time staffing grew by about 300 last year at the Department of Correction, but overtime spending jumped by nearly $5.0 million to $11.7 million.

With a tab of more than $1 billion a year, overtime spending appears to be a ripe target for budget cutting. But given the different factors driving this spending, hitting those targets may take some careful aim.

Few Layoffs in 2013 City Budget, But Municipal Workforce Would Continue to Shrink

Posted by Doug Turetsky, July 24, 2012

Are cities and states around the U.S. undergoing a surge in hiring? That was the finding of a USA Today news story earlier this month, which noted that hiring by cities, states, and local school districts during the first four months of 2012 was 20 percent above the rate for the same period last year. This hiring comes in the wake of steep recession-related government job cuts. A just-released report by the Volcker/Ravitch Task Force on state budgets found that state and local governments slashed employment far more than in previous recessions.

 
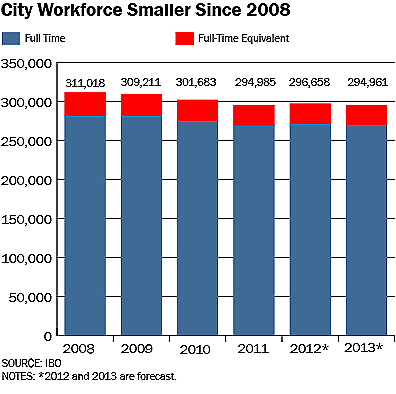
While New York City government is certainly doing some hiring, don’t expect a rise in the number of municipal workers anytime soon—at least not based the budget that was recently adopted for fiscal year 2013, which began on July 1. Based on the budget for 2013, the city workforce will decline by 1,697 this year and total 294,961 by June 30, 2013 (including the number of hours worked by part-timers calculated to add up to an equivalent number of full-time positions). That’s down from 311,018 in June 2008, just as the recession began to squeeze city tax receipts. The decline has occurred through a combination of layoffs and attrition—not rehiring if a position becomes vacant due to an event such as retirement or resignation.


Proposed staffing cuts played a relatively small role in the recent round of budget debates. That’s far different from last year, when wrangling over the Mayor’s proposed budget for 2012 was largely dominated by his proposal to lay off nearly 4,300 teachers and not replace about 1,900 other teachers who were expected to leave the school system. Although the teacher layoffs were averted in negotiations with the City Council, other layoffs have occurred in the wake of the recession.

 
Determining the number of city workers that have been laid off is difficult because not every employee is in the city’s main payroll database. For example, Department of Education administrators and, as of a few weeks ago, custodians are in the main database. Other education department employees, such as the 672 school aides laid off last year, are in a separate database.


A review of the city’s main payroll database by IBO labor analyst Martin Davis identified a total of 2,031 layoffs among regular full-time and part-time city workers from fiscal year 2009 through May 2012. Most of the layoffs in the database we reviewed were concentrated in just a few agencies, and nearly half occurred in 2010 when there were 940.

Besides the Department of Education school aide layoffs, the Administration for Children’s Services accounted for the most layoffs we were able to identify in the 2009-2012 period, with 598. Well more than half of these occurred in 2010.There were 509 layoffs among staff identified as administrators at the Department of Education over the same four-year period. The Department of Health and Mental Hygiene’s layoff total was next at 296.


The Mayor’s initial budget proposals for the current fiscal year projected far fewer layoffs than his 2012 proposals. And more than half of the projected layoffs for 2013 were not actually of municipal employees but rather the result of anticipated cuts in the city subsidy to libraries and cultural organizations—cuts that were ultimately reversed in the most recent budget deal with the City Council.

 
Among the comparatively small number of layoffs that are included in the budget adopted last month are staff cuts at the Department of Transportation as the city makes the shift from single-space parking meters to Muni Meters. The declining number of layoffs here mirrors a national trend found in an April 2012 survey by the Center for State & Local Government Excellence. Twenty-eight percent of responding governments said they had undertaken layoffs this year compared with 40 percent the year before. At least in the short term, layoffs may increasingly have more to do with changes in staffing needs than fiscal needs.

It’s Not Just OWS: How Wind, Snow, and the Red Sox Drive Police Overtime Spending

Recent reports that the first month of the Occupy Wall Street protests cost the city $3.4 million in police overtime no doubt led to some raised eyebrows. While a substantial sum, it equals just a fraction of police overtime spending in recent years.

In fiscal year 2011, which ended on June 30, police overtime totaled $549.5 million. And it has been climbing steadily. Just looking at the prior five years, spending on police overtime grew from $412.0 million in 2006 to $538.4 million in 2010, according to numbers assembled by IBO’s Bernard O’Brien. Some portion of the increase is probably a reflection of wage growth during the five years, not just more overtime hours.

The New York Police Department categorizes part of its overtime spending in terms of planned and unplanned events. Planned events, meaning the event has occurred annually for at least three consecutive years, include goings-on such as the New York City Marathon ($2.3 million in police overtime last year), the Thanksgiving Day Parade ($192,763), and the Steinway Street Festival ($3,474).

Not surprisingly, Occupy Wall Street falls under the category of unplanned events. And there are a lot of them each year, some stemming from acts of nature, others very much manmade. The tornados that swept Brooklyn, Queens, and Staten Island in September 2010 caused $318,407 in police overtime. Last December’s blizzard dumped $1.6 million in overtime costs on the city. The snowstorms that followed in January piled on another $883,721.

Baseball games are events of our own making that can also mean police overtime, especially when the Red Sox come here to play the Yankees. The two teams squared off in the Bronx in August and September last year, generating headlines and $410,948 in police overtime spending. And that doesn’t include the playoffs against the Twins last October, which knocked in $305,045 more in police overtime. (The Mets, it seems, simply don’t ignite the same passion—or extend their season long enough—to warrant added overtime.)

Presidential visits, international events, and Mayoral initiatives also can boost the city’s police overtime bill. Last fiscal year, President Obama visited the city seven times, resulting in $2.4 million in overtime for the local police force. When Osama bin Laden was killed by Navy SEALS in Pakistan in May, it triggered $773,981 overtime for extra security in the city. Mayor Bloomberg’s Summer Streets initiative, which opens seven miles of streets for walking, biking, and playing on three consecutive Saturdays in August, cost $709,358 in 2010.

With all the events, planned and unplanned, that occur in the city, the need for police overtime might seem like a given—especially as the number of officers declines. Since 2006 the number of police officers has dropped by nearly 2,000 to 33,777 at the end of last fiscal year.

If recent history is any guide, size of the force isn’t all that matters when it comes to police overtime. For example, in the two fiscal years prior to 9/11, police staffing hit all time highs, yet police overtime spending continued to rise. Then, in the aftermath of 9/11, antiterrorism efforts multiplied while the number of officers began to decline. Yet overtime spending, excluding costs stemming from 9/11) leveled off (see IBO’s Police Overtime: Tracking the Big Growth in Spending for more details).

While the cost of police overtime seems to follow its own laws of gravity, it’s likely that we’ll see substantial overtime costs for Occupy Wall Street and other goings-on around town for some time.

Mayor’s Plan for School Budget Savings Overstates Need for Teacher Layoffs

Posted by Ray Domanico, June 1, 2011

Probably the most well known piece of the Mayor’s budget plan for 2012 is the proposal to eliminate more than 6,166 teacher positions, 4,278 of them through layoffs and the remainder by not hiring new teachers to replace those that leave the school system. But an analysis by IBO indicates that the calculation of the savings cited by the Mayor and the Schools Chancellor from these reductions significantly overstate the number of layoffs needed to meet the budget target. Savings from attrition could be almost $104 million higher than the budget assumes, which would reduce the number of layoffs needed by more than 1,600 to achieve the same budget cut.

The Mayor’s Executive Budget for Fiscal Year 2012 calls for the city school system to operate with 6,166 fewer teachers next year: a cut of 5,778 teachers introduced by the Mayor during this year’s budget process plus another 388 teacher reductions that are still pending for 2012 from last year’s budget cycle. The 5,778 assumes 1,500 teachers will leave voluntarily and not be replaced (attrition) and that an additional 4,278 teachers will be laid off. The remaining 388 planned reduction appears to be through attrition. IBO has estimated the savings associated with these staffing changes and compared our estimates with those included in the Mayor’s Executive Budget.

The Mayor’s budget projects savings of $269 million from the layoff of 4,278 teachers, or an average of $62,879 per teacher, while the savings from not replacing 1,500 teachers who leave voluntarily is reported as $106.8 million, an average of $71,180. The difference between the two estimates is that the city will have to pay increased unemployment insurance premiums because of the layoffs, offsetting some of the savings.

The Bloomberg Administration’s estimates don’t reflect the fact that the salaries of teachers who leave voluntarily are likely to be higher than those who are laid off. Current law requires the school system to lay off the newest teachers first within teacher license areas (English, math, science, etc.). Given that teachers who voluntarily leave the city system will almost certainly include some higher paid teachers opting for retirement and that teachers being laid off would be drawn largely from lower salary levels, on a per teacher basis, the salary savings associated with attrition will be greater than those associated with layoffs. The city is assuming the same average salary of $54,000 for both types of teachers leaving the payroll.

Using data obtained from the Department of Education on the current and past pool of teachers in the city’s public schools, including their salary “step,” IBO did its own estimate of the amount that the city can expect to save from teacher attrition in the coming year, based on the final salaries of those who left the system at the end of the 2009-2010 school year. The method we used was straightforward. We began by identifying teachers who had been assigned to classrooms in the 2009-2010 school year but who did not have classroom assignments in 2010-2011. (In neither year did we include teachers identified as being in the Absent Teacher Reserve pool.)

Next, given that DOE has the discretion to exempt teachers in certain assignments from its reduction plan, we dropped math, science, special education, bilingual education and English as a second language teachers. These are either hard to staff positions or mandated services, so we assume that the DOE will fill these positions despite its reduction plan. We were left with 2,571 teachers who had worked in the school system in 2009-2010 and who had not returned this year—well above the level of attrition assumed in the Bloomberg Administration’s estimate. The teachers we identified had an average salary of $64,731, which is $10,731 higher than the average salary assumed by DOE. Once we add in the cost of fringe benefits for such teachers, IBO estimates that each teaching position lost through attrition saved the city $81,911.

Based on the number, salaries, and benefits of teachers in nonmandated or priority assignments who voluntarily left the system at the end of last year, IBO estimates possible savings of $210.6 million if teachers leaving the system this year are not replaced for the coming year, almost twice the savings the Mayor’s Executive Budget is assuming for next school year. If the attrition pattern from 2009-2010 holds, the additional $103.8 million in attrition savings could be used to reduce the number of teachers to be laid off by 1,651.

As a final check of our analysis and data, we estimated the amount of money that would be saved by the current plan to lay off 4,278 teachers. Using the same database as we used for the attrition analysis, we identified the 4,278 least senior teachers in assignments as of November 1, 2010. Our analysis confirmed the Mayor’s estimate of $269 million in savings to be realized from those layoffs.

For the system as a whole, whether the teaching force is reduced through layoffs or attrition matters less than the number of teaching positions that are ultimately lost. But for the teachers threatened with layoffs—and the schools most heavily staffed with recent hires—it obviously means a lot if the city could rely more heavily on attrition.

Sick Days and the City

Posted by Doug Turetsky & Bernard O’Brien, October 13, 2010

With Mayor Bloomberg making plain how much he dislikes the City Council bill that would require businesses to provide employees with paid sick leave, it seems like a good moment to look at how much sick leave is used by city workers. In fiscal year 2010 (which ended in June), city workers on average used 8.5 paid sick days—just about the nine days that the Council bill says businesses with 20 or more employees should provide for its workers.

As is often the case, averages can hide some interesting variations. There are substantial differences between the numbers of paid sick days taken by workers at different agencies. Based on data for 34 city agencies compiled by the Mayor’s office and available here, the number of paid sick days used last year by city workers (not including days lost to on-the-job injuries) ranged from 12 by uniformed correction officers to just five by staff members of the department of parks—maybe there is something to the old adage about the health benefits of outdoors work.

Or at least some kinds of outdoors work. Uniformed sanitation workers clocked in a comparatively high number of sick days. Just as working inside a jail may not be the healthiest of occupations, it’s probably no surprise given the nature of their job that sanitation workers used an average of 11.5 sick days last year. What may come as a surprise is that police officers and firefighters used fewer sick days than the citywide average: 6.6 for police and 7.0 for uniformed firefighters.

There are some other seeming anomalies in the use of paid sick days. Maybe it has something to do with being a tax collector, but over at the finance department, workers used an average of nearly 11 paid sick days last year. Perhaps working with musty documents also takes a toll on health. Staffers at the Department of Records used an average of about 10 paid sick days last year.

On the healthier side of the sick leave ledger, Landmarks Preservation Commission staff used a comparatively modest average of 6.2 sick days in 2010. And despite working for an agency whose name and mission is synonymous with stress, staff at the Office of Emergency Management averaged just 6.1 sick days.

The number of paid sick days that city employees are entitled to varies depending upon their civil service title and, in some cases, time on the job. An IBO analyst, for example, earns 10 a year, growing to 12 after five years of city employment.

Citywide, use of paid sick leave has edged downward under Mayor Bloomberg, from 9.2 days on average during his first full year in office to last year’s 8.5.

When It Comes to Making Labor Contracts Readily Accessible, Albany’s Got Us Beat

Posted by Bernard O’Brien, August 13, 2009

More than 200,000 of the city’s municipal workers are members of labor unions. The wage and benefit levels set in the contracts for these workers make up a large share of the nearly $36 billion the Bloomberg Administration expects to spend on labor costs this year. Given the huge cost and the number of people affected, one might think that the terms set in these labor contracts would be online and readily accessible to analysts, researchers, and taxpayers in general. But the fact is you won’t find the contracts on the city’s Web site.

Putting labor contracts online is doable: for an example you have to look no further than Albany, where the state puts its contracts with union workers online along with other information related to employee compensation. In fact, the state site includes current as well as previous union contracts, some dating as far back as 1991.

The state Web site is available via Governor David Paterson’s Office of Employee Relations. The site is also accessible via the SeeThroughNY initiative sponsored by the Manhattan Institute’s Empire Center for New York State Policy at http://www.seethroughny.net.

The following questions can be answered by visiting the Governor’s Web site:

Which unions represent which state workers?
Taxpayers can determine that state police officers are represented by the Police Benevolent Association of the New York State Troopers, SUNY faculty members by United University Professions, and certain other categories of state workers by the Civil Service Employees Association. In total, 10 specific unions or negotiating units are identified on the Governor’s Web site.

How much do state workers earn?
The Governor’s Web site provides online access to both current and past state workforce labor contracts for each negotiating unit along with supporting documentation such as memoranda of agreement, salary schedules, and side letters associated with some labor contracts.

What other information related to the state workforce is available online?
The Governor’s Web site also provides certain demographic information such as breakdowns by age, length of service, and gender for each union representing state workers. An overall breakdown of state workers by race is also presented.

Here in New York City, some municipal labor contracts are available in hard copy and can be photocopied at City Hall Library located at 31 Chambers Street in Lower Manhattan. Yet none are available online for public review in the manner now made possible at the state level.

It should be noted that the city does annually publish its Civil List online each April. The most recent Civil List, an alphabetical snapshot of all city employees and their respective base salaries, can be accessed at www.nyc.gov/html/records/pdf/govpub/CIVIL_LIST_2008_Public.pdf.

New York City is often favorably compared with the state when it comes to matters such as budgetary transparency and fiscal reporting. But when it comes to information about labor contracts, the city has quite a ways to go to meet the standard being set by the state.

Two Paramedics on an Ambulance—Only in New York

Posted by Bernard O’Brien, July 27, 2009

Each day in the city there about 880 serious medical emergencies reported over the 911 system which are deemed by Emergency Medical Services dispatchers to require response by highly trained paramedics. On average 15 of these daily calls are instead responded to by emergency medical technicians (EMTs) with less training because paramedics are not available.

Even when paramedics are available to respond, they can’t always do it as quickly as city officials want. The city has a goal of paramedics arriving within 10 minutes of a call 90 percent of the time. They hit that mark about 700 times a day—but they’d have to do it an additional 80 times a day to reach the goal.

Although a proposal announced last January by Mayor Bloomberg would perhaps help remedy these public safety concerns by changing the manner in which many fire department ambulances are staffed, the city has not yet been granted the state regulatory approval needed to implement the proposal. The city unsuccessfully sought this same change in 2005.

The proposed restructuring would allow some city ambulances, as well as those operated by private ambulance services, to be staffed with teams composed of one paramedic and one EMT rather than the current practice of putting two paramedics in the same ambulance. This would allow more ambulances with at least one paramedic to arrive at more emergencies without hiring additional staff.

The planned change in ambulance staffing would also have implications for the city budget. Since an ambulance with a paramedic charges more, revenue would increase. The recently adopted budget for 2010 assumes that the planned change in ambulance staffing would have been underway on July 1 and estimates that the restructuring would raise $2.1 million a year. The increased revenue would allow for a commensurate reduction in the city subsidy for fire department ambulance operations.

Understanding the staffing change requires a bit of background on the two levels of ambulance service provided by the fire department as well as the important differences between paramedics and EMTs. There are two types of ambulances: Advanced Life Support and Basic Life Support. Advanced Life Support units, currently required to be staffed with two paramedics, are dispatched to the most serious medical emergencies, such as heart attacks, choking incidents, and third-degree burn cases. Basic Life Support units are staffed with two EMTs and are typically sent to less critical emergencies such as complaints of heat exhaustion or respiratory distress.

Paramedics are more highly trained than EMTs, with the former receiving some 1,500 hours of training as compared with 120 hours to 150 hours for technicians. Paramedics’ higher level of training allows them to perform advanced medical procedures, including intubation and the administration of drugs. The city charges more for advanced medical care, receiving higher reimbursements from Medicare and Medicaid as well as from patients’ private insurance plans.

There’s only one place in the state where Advanced Life Support ambulances are required to have two paramedics—New York City. Regulations governing ambulance staffing in New York State are issued by entities known as regional emergency medical services councils. The membership of each council consists of physician representatives from public and private hospitals as well as local emergency medical services providers. There’s a council with responsibility solely for New York City.

Under current staffing and deployment levels, there are times when ambulances with paramedics are unavailable or unable to reach an emergency in a timely manner. In fiscal year 2009, in about 2 percent of serious medical emergencies—or about 5,500 incidents—paramedics were not available and EMTs responded instead. Even when paramedics are available to respond, it wasn’t always as promptly as the city aims for. In fiscal year 2009, 80.4 percent of serious medical emergencies were responded to by paramedics in less than 10 minutes, falling short of the fire department’s own goal of 90 percent for this performance indicator. (Responder and response time data cover ambulances operated by the fire department and the private services.)

By teaming paramedics with emergency medical technicians, more ambulances would be staffed with at least one paramedic, increasing the likelihood that an ambulance with a paramedic shows up when needed and on time.

In refusing the city’s 2005 request, the local emergency services council asserted that the city had not submitted convincing evidence that Advanced Life Support units responding to 911 calls within the five boroughs could be safely staffed with fewer than two paramedics. The union representing paramedics agreed, saying that working individually would put too much pressure on paramedics and be a risk to patients. The city’s latest proposal to reverse the unique two-paramedic rule for ambulances operating in the five boroughs has yet to change the council’s mind.

How Much Did He Say in Pension Savings?

Posted by Doug Turetsky, March 6, 2009

When Mayor Michael Bloomberg released his budget plan in January, many observers were scratching their heads over one number in particular: $200 million in pension savings. That’s the amount the Mayor said the city would save in the next fiscal year alone if a new pension arrangement first proposed by Governor David Paterson was approved in Albany.

This so-called Tier V would require newly hired city employees to pay more into the pension system than current workers and make the new hires work longer before they become eligible to retire with full benefits, among other changes designed to lower public pension costs. Given that these changes would only apply to new municipal workers and that the city’s current budget malaise makes it unlikely there will be many of them in the near future, the Mayor’s savings estimate seemed very high.

It appears that the savings number in the Mayor’s Preliminary Budget is inconsistent with other estimates provided by the Bloomberg Administration. A Memorandum of Support of the Tier V proposal for city uniformed employees—police, firefighters, correction officers, and sanitation workers—based on information submitted by the Bloomberg Administration to the state Legislature cites much lower estimated savings. The memo says, “This bill will result in savings to New York City of approximately $25 million in the year after enactment. Savings would increase by approximately $25 million per year as new employees are hired, such that the annual savings will be $500 million in 20 years.”

So maybe most of the savings will come from the rest of the city’s workforce, including teachers and other civilian employees? A memo from the Mayor’s budget office to the state’s budget office puts that supposition to rest. Sent last January 9—just 21 days before the Mayor presented his Preliminary Budget—the memo estimated that savings from a new pension tier for teachers and civilian workers would be $10 million in the first year and grow by $10 million annually in subsequent years and reach $200 million in 20 years.

So how does a combined estimate of $35 million in first year savings morph into $200 million? It seems the Bloomberg Administration is hoping to get an agreement to “frontload” some of the expected savings by taking the average over a relatively long term and applying it annually rather than allow it to accrue on a year-by-year basis as current employees retire and new employees with lower pension costs for the city are hired.

Why the Mayor would want to do this is a matter for conjecture. But one thing is clear: whatever its longer term fiscal merits, a Tier V wouldn’t really save $200 million in 2010.

Big City, Big Staff—But Maybe Not as Big as It Seems

Posted by Doug Turetsky, January 21, 2009

As Mayor Bloomberg wrestles with the city’s projected budget gaps, pressure to reduce the size of the municipal workforce—by far the city’s biggest single expenditure—is growing. In the wake of the last recession, full-time city staffing dropped to 239,616 in 2003 from a previous high of nearly 251,000 in 2000. Since 2003, full-time staffing has grown steadily, reaching 280,649 at the end of the last fiscal year, a rise of more than 41,000 over five years.

While full-time staffing has grown at nearly every city agency, a large share of the growth occurred at just a few. The Department of Education saw the biggest rise in total number of employees: the number of teachers, principals, and other classroom staff (pedagogical employees in budget speak) rose by nearly 19,000 from 2003 through 2008, when it totaled 112,852; the number of non-pedagogical employees also jumped by nearly 4,000 over the same period, reaching 10,760 in 2008.

But numbers alone don’t tell the whole story. While the city has steadily increased the ranks of teachers, a significant share of the rise in education department staff isn’t really due to new hiring—but rather from a reclassification of about 15,000 paraprofessionals who were previously listed as part-timers and not included in full-time staffing levels. The same holds true at the parks department, where the official full-time headcount nearly doubled to 3,702 by 2008 as many so-called seasonal workers who were really working full time were added to the count.

Still, the staffs of many agencies increased because more people were hired. Under plans to beef up its inspection and enforcement efforts, the Department of Buildings has grown 45 percent since 2003 and had 1,162 full-time employees in 2008. Full-time staffing at the Department of Health and Mental Hygiene has grown even more since 2003 in both percentage and absolute terms, rising by 60 percent to 5,202 in 2008. The Mayor’s office has also gotten bigger, growing by nearly 11 percent since 2003 to a full-time headcount of 923 in 2008.

Not every agency saw growth in its full-time staff. The number of uniformed officers at both the police and correction departments declined during the 2003-2008 period. The number of police officers fell by 715 to 35,405—though the number of civilian employees grew because school safety agents were reclassified as full-time workers. The number of correction officers dropped by 404 to 9,149. At the Commission on Human Rights staffing has declined by more than 25 percent, to 79 in 2008.

So while the total city workforce has certainly grown since the last recession, the number of workers newly added to the payroll is not as high as the numbers indicate at first blush. Nor are the increases equal across all agencies.