Category Archives: Sanitation

Whose Streets You Calling Dirty?

Posted by Doug Turetsky, October 23, 2012

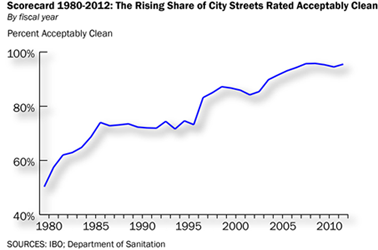
Last month, a Travel & Leisure magazine reader survey ranked New York the dirtiest city in the U.S. Just a few weeks later, the Bloomberg Administration released the Mayor’s Management Report for fiscal year 2012, which found that 95.5 percent of the city’s streets were ”acceptably clean”—meaning there were only scattered bits of litter on the streets. The report deemed not a single section of the city dirty.

Even acknowledging that there can be sharp differences among individual perceptions of intolerable levels of grit, grime, and litter, there’s a huge gulf between the T&L survey and the Bloomberg Administration’s rating. In 2012, the city spent $81 million on activities related to cleaning its streets such as running the city’s 450 mechanical brooms and emptying litter baskets, according to figures provided by the sanitation department. About $570 million more was spent collecting curbside trash and recyclables. Given these expenditures, chalking up that gulf in perceptions solely to eye-of-the-beholder differences seems insufficient—especially since city residents may not see eye-to-eye with the Bloomberg Administration rating either.

In July, the Mayor’s Office of Operations, which does the street cleanliness ratings, scored 98.4 percent of the streets in Manhattan’s Community Board 1 as acceptably clean. Yet Crain’s recently reported that complaints about overflowing trash cans in Lower Manhattan, which is part of Community Board 1, led city officials to add more trash cans in the area in August, the very month following the pristine rating. And now Lower Manhattan’s Downtown Alliance has placed solar powered trash-compacting bins that can hold five times the amount of garbage as a regular litter basket at five heavily trafficked street corners.

Community boards citywide also may be less sanguine than City Hall when it comes to the cleanliness of the city’s streets. As a way to gauge the demand for certain services, the Mayor’s budget office asks community boards each year to rank by importance 90 different services provided locally. Street cleaning ranked 17th citywide, ahead of other efforts such as economic development initiatives, housing code inspections, and services for the homeless.

On a recent Wednesday morning IBO’s Justin Bland and I joined Edwin Cuevas and Alicia Robinson as they rated the cleanliness of about 25 streets in Crown Heights. Each month three teams from the Scorecard program in the Mayor’s Office of Operations rate the same set of 6,900 of the city’s 120,000 blocks. As Robinson drove, Cuevas, a 19-year veteran of the program, eyeballed and quickly rated the cleanliness based on a seven-point numerical scale. To better ensure that the drive-by survey is representative of daily conditions, the week, day, time, and team doing the rating for each set of streets in the sample varies from month to month.

But there are two key reasons the survey findings may not mesh with public perceptions. First, the streets surveyed and the rating scale were developed in the late 1970s, a time when there may have been lower expectations—at least compared with today—for what measured up as an acceptably clean street. Additionally, the surveyed streets may no longer provide the most representative sample. Operations staff members acknowledge that public perceptions of what’s clean or dirty have changed over the years and are working to recalibrate their rating system as well as adjust which streets are surveyed.

Secondly, the ratings are compiled Monday through Friday. So the survey doesn’t capture a view of street cleanliness on weekends and holidays, when tourists abound and neighborhood commercial streets are busiest and litter most likely to pile up and trash cans overflow. For years, the City Council funded litter basket pick-ups on Sundays and holidays in business districts around the city. But the Council hasn’t provided funds for this service since 2009, when it pitched in $1.4 million.

Reconciling tourist impressions of what’s a clean street with those of New Yorkers may be impossible. For some tourists, the sense that the city’s streets are dirty may be heightened by the crowds and disorder that characterizes street life in some parts of New York, a level of activity that may be alien to their usual experience.

What may be more important is comparing New Yorkers own impressions of street cleanliness with those of the Mayor’s scorecard. Even if the Mayor’s office updates and improves its rating system, putting City Hall’s self-assessment alongside a survey of the views of residents and business owners could be instructive. After all, they’re the ones paying for the service.
Less Trash, Less of it Recycled

Posted by Doug Turetsky, November 10, 2011

An October 26th Daily News article reported that New Yorkers put out less trash for curbside pickup in fiscal year 2011 then they did in 2010. But lower trash levels are not a citywide phenomenon. The one exception: the Bronx.

Some sanitation experts say there’s more trash in the Bronx destined for landfills or incinerators because the borough diverts a comparatively small share of its trash to recycling.
In 2011, the Bronx diverted a paltry 10.3 percent of its refuse to recycling, well below the diversion rate of the other boroughs. Manhattan topped the charts at 19.0 percent with Staten Island a close second at 18.6 percent. Seven of the Bronx’s 12 community districts recycled less than 10 percent of their trash. Of the city’s 47 other community districts, only 6 had recycling rates below 10 percent.

Still, the citywide recycling rate declined overall in 2011 to 15.4 percent from 15.7 percent in 2010. Every borough except Staten Island saw the share of its refuse diverted to recycling fall in 2011. Only 25 of the city’s 59 community districts met or exceeded the citywide goal in 2011 of diverting 16 percent of its trash to recycling. In the same Daily News article, Council Member Letitia James, who chairs the City Council’s sanitation committee, blamed low recycling rates on the city’s failure to adequately educate the public.

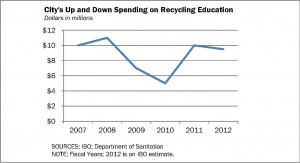
Although the Mayor’s PlaNYC lists several initiatives to encourage recycling, including the expansion of education programs, funding levels for education efforts have varied over time. Numbers compiled by IBO’s Yevgeniya Bukshpun show the extent of the fiscal ups and downs. Spending on recycling education and outreach tumbled from just under $11 million in 2007 to barely $5 million in 2010. It rebounded to nearly $10 million last year but IBO currently projects it to total about $450,000 less than that this year.

Inconsistent funding of education and outreach may not be the only reason many New Yorkers find it hard to know (or care) what should and shouldn’t be recycled. There have also been some abrupt changes in the program.

In an effort to save money, the city temporarily stopped collecting glass and plastic in 2002—only metal and paper were recycled. In July 2003, plastic recycling resumed, but the city temporarily shifted to alternate week pickups of recyclables. For many New Yorkers, this meant letting recyclables collect in their apartments or basements for a couple of weeks—or simply tossing it with the regular trash. Glass was not recycled again until April 2004. Anecdotal evidence such as a peek at neighbors’ recycling cans give an indication there’s still confusion over what is and isn’t recycled.

While more education and outreach programs could relieve the bewilderment over what’s recycled, it won’t address the “slimming down” of some of what is recycled. Sanitation experts generally talk about how much is recycled in terms of the diversion rate: the share by weight of our curbside trash stream that’s set aside for recycling.

Declines in the city’s diversion rate may in part be because recyclables don’t weigh as much as they used to. Some plastics have gotten lighter and newspapers and magazines are shrinking (along with their readership and advertising pages). Some of the drop in recyclables, as well as regular trash, may also be a side effect of the sluggish economy—people are buying and throwing out less.

Perhaps there’s a lesson to be learned from this fall off in curbside trash. While recycling is the “apple pie” of environmentalism, it might make sense to increase the emphasis placed on those other two “Rs” in the litany of environmentally sound trash management practices: reuse and reduce.

As IBO has well documented, it costs more to collect and dispose of a ton of recycling than the city’s regular rubbish, although the gap has been narrowing as the cost of exporting trash to landfills and incinerators has escalated. But stuff that never winds up at curbside for pickup, whether recycling or regular trash, costs nothing for collection and disposal. Of course, additional efforts to decrease the amount of stuff that winds up in the city’s waste stream may take more investment in public education and outreach.

City‘s Recycling Goal Just Rubbish?

Posted by Doug Turetsky, April 13, 2009

While it has cost more to collect and dispose of a ton of recyclables than a ton of trash, the difference is narrowing as the cost of exporting garbage to landfills and incinerators outside the city rises. Last month the city signed a new 20-year contract for transporting refuse picked up by the sanitation department in Brooklyn to landfills and incinerators outside the city. The new Brooklyn contract is estimated to cost $134 per ton, well more than last year’s average citywide cost of $85.11. As a result, the fiscal incentive to promote recycling is increasing.

But the rising cost of exporting the city’s rubbish is only one part of the fiscal equation. Making recycling more cost-effective will also take increasing the city’s recycling rate. (For more details, see IBO’s More Recycling Needed to Help Lower City’s Trash Costs.)

When the Mayor and City Council adopted the city’s Solid Waste Management Plan in 2006, a key part of the plan was to reinvigorate New Yorkers’ recycling efforts. But the amount of paper, metal, glass, and plastic picked up curbside for recycling remains substantially below the city’s goals. And the amount of trash that’s recycled varies widely throughout the city.

The city aims to have 25 percent of the trash it picks up recyclable. In other words, by weight about 25 percent of the trash New Yorkers put out for collection should be separated in the appropriate recycling bins or bags. In fact, the share of recycling has only been about 16 percent since the solid waste plan was passed, which is actually lower than the 19.8 percent recycling rate in 2002. Granted the rate plummeted in 2003-2004 when the recycling program was cut back to just paper, and it took a while to get people back in the habit of recycling the other stuff. And with bottles increasingly being made from plastic and the size of newspapers shrinking (along with their readership), a weight-based goal has more hurdles. But reaching the 25 percent goal seems especially tough if you look at recycling rates at a borough or neighborhood level.

In fiscal year 2008, none of the boroughs had a recycling rate of 25 percent or more, and only 6 out of the city’s 59 sanitation districts had rates of 25 percent or above. Of the districts meeting or exceeding the recycling goal, five were in Manhattan. But some Manhattan neighborhoods were well under the goal. While neighborhoods such as the Upper West Side and Greenwich Village exceeded the goal, East Harlem and Central Harlem each recycled less than 10 percent of their curbside trash.

In the Bronx, where the overall 2008 recycling diversion rate was 10.8 percent, no district reached a 25 percent rate and 7 of the borough’s 12 districts recycled less than 10 percent of their trash. Among Brooklyn’ s 18 districts the recycling rate was 15.5 percent, and only the district comprising Park Slope, Carroll Gardens, and Red Hook exceeded 25 percent while two districts including Bedford-Stuyvesant and Brownsville recycled at rates below 10 percent. In Queens, where the boroughwide rate was 17.7 percent, and Staten Island, where it was 16.5 percent, no district met the 25 percent goal but no district was at or below 10 percent.

The statistics through the first six months of the current fiscal year look very similar. Only six districts are meeting or exceeding the 25 percent goal: the same six as last year, although the Brooklyn district’s rate has slipped a bit. With the cost of exporting the city’s regular rubbish expected to rise by $80 million over the next few years and reach $395 million in 2012, it may be fiscally prudent to pull the city’s recycling rates out of the trash bin.