Where the Jobs Are Growing the Money Isn’t Always So Good

Posted by Doug Turetsky, January 18, 2012

IBO’s latest economic projections for the city anticipate the creation of nearly 39,000 jobs this year and about 50,000 in 2013. That’s good news for the city, which has already regained more than half the 135,000 jobs it lost in the recession. As the New York Times reports today on a U.S. Conference of Mayors’ study, New York City is doing better than many other cities, including Los Angeles and Chicago. In total, the U.S. has regained about a quarter of the jobs it lost.

But before the celebrating gets too loud, there’s another important consideration: the jobs we’re regaining don’t pay nearly as well as many of the ones we lost. While the city shed thousands of jobs in such high-paying sectors as Wall Street, where securities and commodities brokers earn average salaries of about $360,000 annually based on 2010 New York State Department of Labor data, we’re regaining jobs in industry sectors that pay just a fraction of that yearly wage.

The largest job gains projected by IBO are in education, health, and social services (excluding government jobs such as those in public schools or public hospitals). Together these sectors are expected to generate more than 33,000 jobs—or nearly 40 percent—of the city’s jobs growth over the next two years. But the industries expected to lead the growth in that sector have annual average wages below the citywide mean of $77,997 in 2010.

We anticipate that about 15,000 jobs will be created in health services, where salaries average roughly $54,900 a year (labor department salary estimates for these jobs include government positions). This industry includes occupations such as home health aides, medical assistants, and nurses. Another 10,000 jobs are expected in education, where the average salary is nearly $52,600. The education industry includes jobs ranging from child care workers to teachers to support staff. IBO also expects about 7,000 jobs will be gained in social assistance, where annual salaries average just $27,800. Social assistance includes occupations such as social workers, pre-school teachers, and recreation workers.

The average salary is even lower for the waiters, food prep workers, bartenders, dishwashers and other restaurant and bar staff whose occupations are included in the leisure and hospitality industry. We project food service and drinking places will add 15,000 of the 19,600 jobs expected to be gained in leisure and hospitality over the next two years. But the average annual salary for food and bar staff is just $24,050—less than a third of the citywide average—although tips help increase the take home pay.

The other industry we expect significant growth in is professional and business services, with a 19,200 increase in jobs over the next two years. This is a fairly well-paying industry as a whole and it lost a considerable number of jobs in the recession. About 11,000 of those jobs are projected to be in professional and technical services, which averaged $109,500 in annual salary in 2010. This portion of professional and business services includes occupations such as lawyers, accountants, and computer programmers.

But another 8,000 jobs to be gained in professional and business services are in administrative and support services, which doesn’t pay nearly as well, averaging $50,400 a year. The administrative and support services include jobs such as telemarketers, secretaries, and security guards.

The growth in comparatively lower paying jobs is better than the alternative—job losses. But lower paying jobs don’t give as big a boost as higher paying ones to the local economy and the city’s tax revenue. And that means less relief for a city budget already straining to keep up with the demand for public services.
Senior Centers Come, Senior Centers Go

Posted by Nashla Salas and Doug Turetsky, December 8, 2011

You may soon need a scorecard to keep track of many of the city’s senior centers. Against a backdrop of limited funding, the city has closed some senior centers and curtailed services and changed the status of others, yet also launched an initiative to create new senior centers.

In October, the Mayor announced that community-based organizations were selected to create eight new senior centers as part of his “Age-Friendly NYC” initiative. But less than two years ago, the Mayor was proposing to close 51 senior centers across the city.

The plan to close the more than four dozen centers was one of the most controversial parts of the Mayor’s budget plan in the spring of 2010. In the end, 27 centers were shuttered and 24 were spared. The Department for the Aging closed the centers based on criteria such as the number of meals served, the center’s level of use, and the quality of recordkeeping by the center’s operator.

Not long ago there were more than 300 centers in the city’s official network of senior services. Now there are 256—a count that doesn’t include some of the centers that were spared in 2010.

Of the 24 senior centers that were not closed under the Mayor’s proposal, the Bloomberg Administration agreed to maintain city funding for seven. The City Council agreed to provide $1.6 million to keep the other 17 centers open. The funds took a while to reach the centers, long enough that one, Glenridge—located in Ridgewood, Queens—closed its doors. The funding for Glenridge was subsequently redirected by the Council to 12 different agencies serving seniors.

The Council has again provided $1.6 million in the current fiscal year for the 17 centers, including $130,000 for Glenridge. But the building Glenridge had operated in has been sold with no immediate plan for the senior center to be allowed to reopen there. The president of the senior center’s board told the Times Newsweekly last month that Glenridge is “in the process of dissolving completely.” IBO assumes the Glenridge funds will again be reallocated by the Council. Other City Council allocations for the 17 centers range from $20,000 for the Wilson M. Morris Senior Center in West Harlem to $185,000 for the Rain Bailey Avenue Senior Center in the Morris Heights section of the Bronx.

Despite the public funds, the 17 centers were cut loose from operating under the aegis of the Department for the Aging. The department does not consider the 17 as part of the city’s network of senior centers, which makes them ineligible for city funds to support transportation and food, two prime services for seniors.

While these centers have been orphaned from the city’s official network of senior centers, the Bloomberg Administration is moving ahead with its plan to create eight new centers under its Age-Friendly NYC initiative. Eight organizations were selected to operate what are being called Innovative Senior Centers. Among them, Bronxworks will run a center that includes a community garden, SNAP in Queens will provide vegetarian meals, and SAGE will offer services to the city’s LGBT seniors. The centers, which are expected to open in January, will receive a total of $3.5 million in city funding for their first year of operation; these city funds will be supplemented by philanthropic support. The Bloomberg Administration intends to announce the creation of more centers under the initiative in the coming months.

The funds are being found for these new centers even as the Mayor’s budget plan for next year includes a $23.5 million, or 17 percent, reduction in city funding for the Department for the Aging. Last June, the Council restored $14 million that the Bloomberg Administration had proposed cutting in basic support for the operations of the senior centers that remain in the city network, along with another $3.5 million for transportation and food.

Although the new innovation centers are likely to be spared from the city’s budget pressures, other senior centers could find themselves “aging out” of the network.

Living Wage, Again

Posted by Doug Turetsky, November 30, 2011

Amid the uproar during the past few weeks over the proposed living wage law there’s one important point that you might have missed: the city already has a living-wage law. Its rules cover thousands of workers employed under more than $1 billion worth of contracts with the city.

In fact, New York City had one of the first living-wage laws in the country, though the city’s first bill covered just a couple thousand workers. Passed in 1996, over the veto of then-Mayor Rudolph Giuliani, the legislation was championed by advocacy organizations such as the Industrial Areas Foundation as well as local unions. It required that private firms contracting with the city to provide food services, security guards, cleaners, and temporary office workers pay their employees a living wage that ranged at the time from about $7.25 to $12 an hour.

The number and type of workers covered by the city’s living-wage rules expanded in 2002 when Mayor Michael Bloomberg signed a law that extended living-wage provisions to home health care and child care workers whose agencies had contracts with the city. The Brennan Center at New York University estimated that under the new requirements the pay of 50,000 home health care workers would rise immediately and later the pay of up to 9,000 child care workers. Shortly after the law went into effect, Steve Malanga wrote ruefully in City Journal, “Thanks to Mayor Bloomberg, New York will now have the largest number of workers covered by any living-wage law in the nation.” For a complete list of covered workers and wage rates, click here.

The proposed living-wage bill now garnering so much attention moves away from a focus on city contracts for services and instead aims at economic development projects. The bill would cover all workers in projects that receive certain public subsidies worth $1 million or more. But it would exempt from its wage rules businesses with revenues of less than $5 million a year, all manufacturing firms, and nonprofits. IBO’s George Sweeting submitted testimony to last week’s City Council hearing on the proposed bill in which he said about six or seven projects a year would be affected by the proposed rules, based on the economic development projects subsidized by the city in 2002-2008.

That’s a small number compared with the 437 contracts the city signed in fiscal year 2011 that are subject to the existing living-wage law. These contracts were valued at $533 million, according to an annual report by the Mayor’s Office of Contract Services. Over the past four fiscal years, the city has signed nearly 1,100 contracts worth more than $1.5 billion that must comply with living-wage rules.

Too bad so much of the debate that continues to simmer on the new living-wage bill largely ignores the fact that the city already has a fairly significant commitment to living-wage provisions. Maybe the $1 million shelled out by the city’s Economic Development Corporation for a study of the potential effects of a living-wage law would have benefitted by looking at what’s happened under the rules that already exist here.

Less Trash, Less of it Recycled

Posted by Doug Turetsky, November 10, 2011

An October 26th Daily News article reported that New Yorkers put out less trash for curbside pickup in fiscal year 2011 then they did in 2010. But lower trash levels are not a citywide phenomenon. The one exception: the Bronx.

Some sanitation experts say there’s more trash in the Bronx destined for landfills or incinerators because the borough diverts a comparatively small share of its trash to recycling.
In 2011, the Bronx diverted a paltry 10.3 percent of its refuse to recycling, well below the diversion rate of the other boroughs. Manhattan topped the charts at 19.0 percent with Staten Island a close second at 18.6 percent. Seven of the Bronx’s 12 community districts recycled less than 10 percent of their trash. Of the city’s 47 other community districts, only 6 had recycling rates below 10 percent.

Still, the citywide recycling rate declined overall in 2011 to 15.4 percent from 15.7 percent in 2010. Every borough except Staten Island saw the share of its refuse diverted to recycling fall in 2011. Only 25 of the city’s 59 community districts met or exceeded the citywide goal in 2011 of diverting 16 percent of its trash to recycling. In the same Daily News article, Council Member Letitia James, who chairs the City Council’s sanitation committee, blamed low recycling rates on the city’s failure to adequately educate the public.

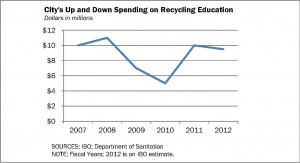
Although the Mayor’s PlaNYC lists several initiatives to encourage recycling, including the expansion of education programs, funding levels for education efforts have varied over time. Numbers compiled by IBO’s Yevgeniya Bukshpun show the extent of the fiscal ups and downs. Spending on recycling education and outreach tumbled from just under $11 million in 2007 to barely $5 million in 2010. It rebounded to nearly $10 million last year but IBO currently projects it to total about $450,000 less than that this year.

Inconsistent funding of education and outreach may not be the only reason many New Yorkers find it hard to know (or care) what should and shouldn’t be recycled. There have also been some abrupt changes in the program.

In an effort to save money, the city temporarily stopped collecting glass and plastic in 2002—only metal and paper were recycled. In July 2003, plastic recycling resumed, but the city temporarily shifted to alternate week pickups of recyclables. For many New Yorkers, this meant letting recyclables collect in their apartments or basements for a couple of weeks—or simply tossing it with the regular trash. Glass was not recycled again until April 2004. Anecdotal evidence such as a peek at neighbors’ recycling cans give an indication there’s still confusion over what is and isn’t recycled.

While more education and outreach programs could relieve the bewilderment over what’s recycled, it won’t address the “slimming down” of some of what is recycled. Sanitation experts generally talk about how much is recycled in terms of the diversion rate: the share by weight of our curbside trash stream that’s set aside for recycling.

Declines in the city’s diversion rate may in part be because recyclables don’t weigh as much as they used to. Some plastics have gotten lighter and newspapers and magazines are shrinking (along with their readership and advertising pages). Some of the drop in recyclables, as well as regular trash, may also be a side effect of the sluggish economy—people are buying and throwing out less.

Perhaps there’s a lesson to be learned from this fall off in curbside trash. While recycling is the “apple pie” of environmentalism, it might make sense to increase the emphasis placed on those other two “Rs” in the litany of environmentally sound trash management practices: reuse and reduce.

As IBO has well documented, it costs more to collect and dispose of a ton of recycling than the city’s regular rubbish, although the gap has been narrowing as the cost of exporting trash to landfills and incinerators has escalated. But stuff that never winds up at curbside for pickup, whether recycling or regular trash, costs nothing for collection and disposal. Of course, additional efforts to decrease the amount of stuff that winds up in the city’s waste stream may take more investment in public education and outreach.

It’s Not Just OWS: How Wind, Snow, and the Red Sox Drive Police Overtime Spending

Recent reports that the first month of the Occupy Wall Street protests cost the city $3.4 million in police overtime no doubt led to some raised eyebrows. While a substantial sum, it equals just a fraction of police overtime spending in recent years.

In fiscal year 2011, which ended on June 30, police overtime totaled $549.5 million. And it has been climbing steadily. Just looking at the prior five years, spending on police overtime grew from $412.0 million in 2006 to $538.4 million in 2010, according to numbers assembled by IBO’s Bernard O’Brien. Some portion of the increase is probably a reflection of wage growth during the five years, not just more overtime hours.

The New York Police Department categorizes part of its overtime spending in terms of planned and unplanned events. Planned events, meaning the event has occurred annually for at least three consecutive years, include goings-on such as the New York City Marathon ($2.3 million in police overtime last year), the Thanksgiving Day Parade ($192,763), and the Steinway Street Festival ($3,474).

Not surprisingly, Occupy Wall Street falls under the category of unplanned events. And there are a lot of them each year, some stemming from acts of nature, others very much manmade. The tornados that swept Brooklyn, Queens, and Staten Island in September 2010 caused $318,407 in police overtime. Last December’s blizzard dumped $1.6 million in overtime costs on the city. The snowstorms that followed in January piled on another $883,721.

Baseball games are events of our own making that can also mean police overtime, especially when the Red Sox come here to play the Yankees. The two teams squared off in the Bronx in August and September last year, generating headlines and $410,948 in police overtime spending. And that doesn’t include the playoffs against the Twins last October, which knocked in $305,045 more in police overtime. (The Mets, it seems, simply don’t ignite the same passion—or extend their season long enough—to warrant added overtime.)

Presidential visits, international events, and Mayoral initiatives also can boost the city’s police overtime bill. Last fiscal year, President Obama visited the city seven times, resulting in $2.4 million in overtime for the local police force. When Osama bin Laden was killed by Navy SEALS in Pakistan in May, it triggered $773,981 overtime for extra security in the city. Mayor Bloomberg’s Summer Streets initiative, which opens seven miles of streets for walking, biking, and playing on three consecutive Saturdays in August, cost $709,358 in 2010.

With all the events, planned and unplanned, that occur in the city, the need for police overtime might seem like a given—especially as the number of officers declines. Since 2006 the number of police officers has dropped by nearly 2,000 to 33,777 at the end of last fiscal year.

If recent history is any guide, size of the force isn’t all that matters when it comes to police overtime. For example, in the two fiscal years prior to 9/11, police staffing hit all time highs, yet police overtime spending continued to rise. Then, in the aftermath of 9/11, antiterrorism efforts multiplied while the number of officers began to decline. Yet overtime spending, excluding costs stemming from 9/11) leveled off (see IBO’s Police Overtime: Tracking the Big Growth in Spending for more details).

While the cost of police overtime seems to follow its own laws of gravity, it’s likely that we’ll see substantial overtime costs for Occupy Wall Street and other goings-on around town for some time.

State Cuts to the Court System Likely to Carry a Price Tag for the City

Posted by Bernard O’Brien, July 27, 2011

New York State’s budget for this year includes $170 million in savings from cuts to the Office of Court Administration, which has already resulted in the layoff of more than 400 state court system employees, or about 2.5 percent of the system’s workforce statewide. But savings realized by the state from these cuts could mean millions of dollars in additional costs to New York City if the pace of processing criminal cases slows. That’s because people under arrest may be spending longer periods awaiting trial in the city’s jails—additional jail time that will largely be funded by the city.

The likelihood of slower court processing is almost certain. As state Chief Administrative Judge Ann Pfau told the New York Times, “Delays are going to be more built into everything we do, unfortunately….If you are waiting for a trial, the trial that is ahead of you is going to take longer.”

Much of the fiscal effect on the city would show up in the Department of Correction’s budget. More than 70 percent of inmates in city jails on Rikers Island and in borough-based facilities at any given time are detainees, meaning they are being held pending disposition of the criminal charges they are facing. The pace of criminal case processing in the courts is therefore a major determinant of the cost of running the city’s jail system, where the department’s total cost of incarcerating each inmate averages $387 per day.

For those inmates convicted of serious crimes and sentenced to time in the state prison system, the time they will actually spend in state prison (at the state’s expense) is reduced by the amount of time already spent in city custody prior to conviction and sentencing (almost entirely at the city’s expense). So that means the longer prisoners remain in city custody during adjudication of their cases, the larger the city’s—and the smaller the state’s—share of total imprisonment costs.

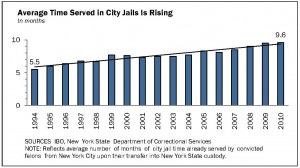
As reflected by the trend line in the graph below, the average amount of city jail time deducted from the state prison sentences of convicted felons from the city has already been moving upward in recent years, rising from 5.5 months in 1994 to 9.6 months in 2010. This trend is consistent with the slower pace of deciding some cases in recent years. While the Office of Court Administration’s own standards call for felony cases to be decided within six months from the date of filing, the percentage of felony dispositions in the city failing to meet that standard grew from 23 percent in 1994 to 37 percent in 2010.

Increases in jail time translate into additional city costs. For example, if slowdowns in case processing result in another month being added to the average time state prison-bound inmates spend in city jails, IBO estimates that the city would incur about $15 million in additional annual expenses at the Department of Correction. In addition, longer periods of incarceration for the thousands of detainees held temporarily in city jails each year but not ultimately destined for state prison—those held on misdemeanor charges, alleged felons ultimately acquitted, etc.—would also result in additional corrections costs borne by the city.

Besides potential increases in corrections department costs, the hit to the city’s budget from delays in criminal case processing could show up in other places as well. For example, police overtime expenditures could be driven up if cutbacks in court staff result in a longer arraignment process, with police officers spending additional time processing arrests. According to a number of recent press accounts, the time from arrest to arraignment has already increased.

So when it comes to cutbacks to the court system to help close the state’s budget shortfall, some of Albany’s savings may come at New York City’s expense.

City’s Multitude of Property Tax Exemptions Add Up to a Wealth of Revenue Foregone

Posted by Doug Turetsky, July 15, 2011

In one respect New York City is much like most other cities and towns across the country: the property tax is by far the biggest source of tax revenue. For 2012, the fiscal year that began two weeks ago, the property tax is expected to bring in $17.6 billion, about 42 percent of all the tax revenue the Bloomberg Administration expects to collect this year. But it could be more, a lot more, if not for the slew of tax exemptions doled out —$13.5 billion worth in 2012 based on an analysis of the city’s property tax roll for this year by IBO’s Ana Champeny.

That’s $1 billion more than the $12.5 billion in property tax breaks the finance department estimated for 2010. Some of the breaks are permanent and may actually be worth more than estimated by either IBO or the finance department.

Many of these exemptions are permanent; for example, the U.S. Supreme Court ruled in McCulloch v. Maryland (1819) that the Constitution exempts the federal government from state taxation. Because so many exemptions are permanent, there’s not much incentive for the city to invest in more accurate assessments. But it’s still instructive to have a handle on how much the city loses to all the various exemptions, some imposed from above and others granted more locally.

The biggest beneficiary is government itself: city, state, and federal as well as government-related entities such as the Metropolitan Transportation Authority and the New York City Housing Authority. New York City government holds more than 7,500 properties with a tax value of nearly $5.0 billion. The city will forgo $751.4 million in taxes on properties held by the transportation authority. Albany and Washington control properties with a tax value of $700.7 million that goes unpaid. Foreign governments also get a free ride that will cost the city $74.2 million this year on 311 properties.

The second largest beneficiaries of property tax exemptions in terms of tax dollars forgone are institutions, which range from cemeteries to private schools and colleges to churches, synagogues, and mosques. Together these institutions are exempt from paying $2.0 billion in property tax this year.

Among these institutional beneficiaries, houses of worship saved the most. This year, more than 9,500 churches, synagogues, and mosques will get a pass on $626.9 million in property taxes. About 40 percent of the religious institutions qualifying for the exemption are located in Brooklyn, long known as “the borough of churches.” But the sobriquet comes with a price tag of $186.2 million in forgone property tax. Manhattan may be far less spiritual in terms of the number of exemptions for houses of worship, but because of higher property values they come at a greater cost than in Brooklyn. Roughly 1,200 religious institutions in Manhattan will not be burdened by bills for $198.2 million in property tax.

Hospitals, medical clinics, and other health care facilities located in the city are also substantial beneficiaries of property tax exemptions, with the city foregoing $515.5 million in 2012 property taxes. Private elementary and secondary schools and colleges and universities are exempted from paying $430.2 million in property tax (for fuller discussion of the college and university exemption, see IBO’s Budget Options for New York City).

Other institutions benefitting from the property tax exemption are foundations and charitable organizations as well as many cultural organizations. Foregone property taxes will save charities $218.2 million and cultural organizations $103.5 million this year.
The city also provides property tax exemptions through about two dozen different programs to encourage construction or renovation of residential buildings, foster commercial development, or assist individual New Yorkers such as veterans or senior citizen homeowners. Some are targeted to very specific sites such as the exemption for Madison Square Garden ($15.1 million in 2012). Conversely, this year, more than 21,000 properties enjoy $168.6 million in J-51 tax exemptions to spur residential renovations.

As a New York Times article recently noted, cities and towns across the country are taking second looks at some of the tax exemptions they’ve granted. Some are focusing on “eds and meds,” seeking to negotiate voluntary payments or an increase in payments in lieu of the full property tax, often referred to as PILOTS. As New York City grapples with its own ongoing budget shortfalls, local policymakers may feel the need to reassess some local tax breaks as well.

Despite Cut in Capital Spending, Mayor Plans to Build a New Jail, Renovate Others

Posted by Nashla Salas, June 15, 2011

Tough fiscal times have led the Mayor to propose a 20 percent reduction in planned city capital spending. That means less money for affordable housing construction, building new schools, or rehabbing city parks. Because of this, some New Yorkers may be surprised to learn that the Bloomberg Administration is still planning to commit more than $620 million in 2011 through 2015 to the construction of a new jail on Rikers Island, the renovation of jails in Brooklyn and Queens, and the closing of other facilities. What may make this even more surprising is that when the changes are complete, the system will have less capacity than it does now.

While the jail proposal has also been cut back—by nearly $115 million or 16 percent in the May 2011 Capital Commitment Plan compared with the September 2010 plan —some may question the need for it at all. Part of what’s driving the initiative is dilapidated conditions. Some of the structures being used on Rikers were only meant to be temporary. Another reason is to reverse a Giuliani Administration initiative that closed the jails near the borough courthouses and placed all inmates on Rikers Island. That proved to be a costly decision, ratcheting up overtime and other expenses in order to transport inmates to court dates.

As a result, the Department of Correction is going ahead with a jail renovation initiative which includes the construction of a new 1,500 bed jail on Rikers Island and reopening detention facilities in Brooklyn and Queens, in conjunction with reductions in the capacity of a number of other facilities. Because the initiative would remove more beds than are being added from the new construction, the city’s overall jail capacity would be reduced by nearly 3,000 beds.

Prior to the implementation of the renovation plan, the city’s jail capacity totaled about 19,400 beds, including 16,400 in Rikers Island-based jails and a total of 3,000 in four facilities in Brooklyn, Queens, Manhattan, and the Bronx. When the renovation plan is finished, capacity will stand at about 16,550.The planned overall reduction would bring capacity more in line with the jail population, which has decreased from a daily average of more than 14,500 in 2003, the peak over the past decade, to 13,362 last year.

The largest project in the plan to renovate Rikers Island is a new 1,500-bed jail at a cost of about $563 million. Also included is a new 800-bed annex to the Rose M. Singer Center ($4.4 million), which is set to open in the next two months. This facility houses detained and sentenced female adults and adolescents. The new beds will partially offset the reduction of thousands of older beds at the 10 current Rikers jails. Many of the older units were meant to be temporary, have been costly to maintain and are overdue for closure. One of the oldest facilities, the 1,194 bed James A. Thomas Center, has already been closed.

While all the capacity changes will occur in the Rikers Island facilities, the plan also calls for reopening jails in Brooklyn and Queens which have not housed inmates since 2003 and 2002, respectively, although their beds were still counted in the system’s capacity. Improvements to the Queens facility total about $550,000 in elevator replacement work. Renovation of the Brooklyn House of Detention will cost $3 million, but a previous proposal to increase its capacity has been dropped. It is expected that the Brooklyn House of Detention will reopen by the fall and the Queens House of Detention will be reopened in the spring of 2012.

While the Rikers Island renovations have drawn little public attention, there have been mixed reactions to the plans to reopen the Brooklyn and Queens facilities. Advocates and families of those arrested have complained of the inaccessibility of Rikers Island and prefer that inmates be housed in borough facilities near their homes. On the other hand, residents near the Brooklyn facility have in the past complained that reopening a jail in their neighborhood will stifle development.

Mayor’s Plan for School Budget Savings Overstates Need for Teacher Layoffs

Posted by Ray Domanico, June 1, 2011

Probably the most well known piece of the Mayor’s budget plan for 2012 is the proposal to eliminate more than 6,166 teacher positions, 4,278 of them through layoffs and the remainder by not hiring new teachers to replace those that leave the school system. But an analysis by IBO indicates that the calculation of the savings cited by the Mayor and the Schools Chancellor from these reductions significantly overstate the number of layoffs needed to meet the budget target. Savings from attrition could be almost $104 million higher than the budget assumes, which would reduce the number of layoffs needed by more than 1,600 to achieve the same budget cut.

The Mayor’s Executive Budget for Fiscal Year 2012 calls for the city school system to operate with 6,166 fewer teachers next year: a cut of 5,778 teachers introduced by the Mayor during this year’s budget process plus another 388 teacher reductions that are still pending for 2012 from last year’s budget cycle. The 5,778 assumes 1,500 teachers will leave voluntarily and not be replaced (attrition) and that an additional 4,278 teachers will be laid off. The remaining 388 planned reduction appears to be through attrition. IBO has estimated the savings associated with these staffing changes and compared our estimates with those included in the Mayor’s Executive Budget.

The Mayor’s budget projects savings of $269 million from the layoff of 4,278 teachers, or an average of $62,879 per teacher, while the savings from not replacing 1,500 teachers who leave voluntarily is reported as $106.8 million, an average of $71,180. The difference between the two estimates is that the city will have to pay increased unemployment insurance premiums because of the layoffs, offsetting some of the savings.

The Bloomberg Administration’s estimates don’t reflect the fact that the salaries of teachers who leave voluntarily are likely to be higher than those who are laid off. Current law requires the school system to lay off the newest teachers first within teacher license areas (English, math, science, etc.). Given that teachers who voluntarily leave the city system will almost certainly include some higher paid teachers opting for retirement and that teachers being laid off would be drawn largely from lower salary levels, on a per teacher basis, the salary savings associated with attrition will be greater than those associated with layoffs. The city is assuming the same average salary of $54,000 for both types of teachers leaving the payroll.

Using data obtained from the Department of Education on the current and past pool of teachers in the city’s public schools, including their salary “step,” IBO did its own estimate of the amount that the city can expect to save from teacher attrition in the coming year, based on the final salaries of those who left the system at the end of the 2009-2010 school year. The method we used was straightforward. We began by identifying teachers who had been assigned to classrooms in the 2009-2010 school year but who did not have classroom assignments in 2010-2011. (In neither year did we include teachers identified as being in the Absent Teacher Reserve pool.)

Next, given that DOE has the discretion to exempt teachers in certain assignments from its reduction plan, we dropped math, science, special education, bilingual education and English as a second language teachers. These are either hard to staff positions or mandated services, so we assume that the DOE will fill these positions despite its reduction plan. We were left with 2,571 teachers who had worked in the school system in 2009-2010 and who had not returned this year—well above the level of attrition assumed in the Bloomberg Administration’s estimate. The teachers we identified had an average salary of $64,731, which is $10,731 higher than the average salary assumed by DOE. Once we add in the cost of fringe benefits for such teachers, IBO estimates that each teaching position lost through attrition saved the city $81,911.

Based on the number, salaries, and benefits of teachers in nonmandated or priority assignments who voluntarily left the system at the end of last year, IBO estimates possible savings of $210.6 million if teachers leaving the system this year are not replaced for the coming year, almost twice the savings the Mayor’s Executive Budget is assuming for next school year. If the attrition pattern from 2009-2010 holds, the additional $103.8 million in attrition savings could be used to reduce the number of teachers to be laid off by 1,651.

As a final check of our analysis and data, we estimated the amount of money that would be saved by the current plan to lay off 4,278 teachers. Using the same database as we used for the attrition analysis, we identified the 4,278 least senior teachers in assignments as of November 1, 2010. Our analysis confirmed the Mayor’s estimate of $269 million in savings to be realized from those layoffs.

For the system as a whole, whether the teaching force is reduced through layoffs or attrition matters less than the number of teaching positions that are ultimately lost. But for the teachers threatened with layoffs—and the schools most heavily staffed with recent hires—it obviously means a lot if the city could rely more heavily on attrition.

President’s Plan Could Cut Millions in Antipoverty Aid for City’s Poorest Neighborhoods

Posted by Nashla Rivas Salas and Doug Turetsky, April 28, 2011

There aren’t many government programs that pump millions of dollars into some of the city’s poorest neighborhoods and give residents of those neighborhoods a say in how that money is spent. The Community Services Block Grant, a program whose lineage dates back to the 1960s and President Lyndon Johnson’s War on Poverty, is a clear exception. But now President Barack Obama, a former community organizer, wants to cut the block grant’s funding in half in next year’s federal budget.

In federal fiscal years 2009 and 2010 the nationwide allocation for the Community Services Block Grant was $700 million. The initial allocation for the current year was also $700 million, but was cut by $20 million in the recent Capitol Hill budget deal that averted a government shutdown. The President’s budget proposal for 2012 seeks only $350 million for the block grant program.

Over the past seven years, New York City has received upwards of $30 million annually through the block grant. The city’s share comes via the state, which determines how much will go to eligible localities. (The state can peel off up to 10 percent of the statewide allocation for administration and oversight.) The city’s allocation this city fiscal year is nearly $32 million. About 30,000 New Yorkers, from youth to seniors, benefit from programs run by service providers funded by the block grant.

The city divvies up the federal dollars geographically based on areas of each borough with high concentrations of poverty. In these so-called Neighborhood Development Areas, at least 30 percent of the residents have incomes below poverty level. There are 43 Neighborhood Development Areas in the city: 12 in the Bronx, 17 in Brooklyn, six in Manhattan, seven in Queens, and one in Staten Island (maps).

Each Neighborhood Development Area receives an allocation based on its share of residents living in poverty. This year, the largest allocation, about $750,000, goes to Brooklyn 12, which includes parts of Sunset Park, Borough Park and other neighborhoods. The next largest allocation, about $740,000, goes to Manhattan 12 (Washington Heights, West Harlem). In the Bronx, the largest allocations, which total about $625,000 each, go to Bronx areas 4 and 5 (Highbridge, Morris Heights, Mount Hope). In Queens the largest allocation is about $485,000 and goes to Queens 12 (South Jamaica, Richmond Hill). Staten Island’s allocation is about $230,000.

Giving community residents a say in how the money is spent was a hallmark of the 1964 Economic Opportunity Act, the forerunner of the current block grant program. The original act promoted “maximum feasible participation,” and directed money to organizations that sought to empower local residents in efforts to end poverty. When the program was recast as a block grant in 1981, the notion of local participation continued.

The city’s Department of Youth and Community Development serves as what is known as a Community Action Agency. Although final determinations are up to the city agency, there’s a board comprised of low-income residents, elected officials or their representatives, and other New Yorkers that participates in decisions about the kinds of antipoverty activities that can be funded with block grant dollars and the groups selected to provide the services. There are now nine types of services ranging from health initiatives to support services for immigrants to adult literacy eligible for block grant funds.

Each Neighborhood Development Area has its own advisory board that prioritizes the eligible services within its boundaries. The neighborhood boards include up to 12 members who live in the community, six of them selected by the city agency and the other six by local elected officials. Each development area’s block grant funding is then allocated based on the priorities set by the advisory board, which solicits public input at community meetings. In Brooklyn 12, for example, the top ranked needs are housing assistance and services for seniors. Queens 12 splits the top allocation among programs aimed at middle school and high school students and services to promote family health.

Community participation is no guarantee that funding will go to the most effective programs. A June 2006 U.S. Government Accountability Office report found shortcomings in the states’ monitoring of the groups receiving community services funding.

Part of President Obama’s agenda for the block grant is to address concerns about the effectiveness of programs funded with community services dollars. To do this he proposes creating competition for the allocations among Community Action Agencies. This would be a big departure from current practice, which distributes funds to states based on their share of dollars when the original program was turned into a block grant in 1981. This change, along with the President’s plan to slice community services funding in half, means New York could lose a substantial amount of federal funds for some of the poorest areas in the city—at a time when state and local resources for these communities are already strained.

Note: Nashla Rivas Salas was a member of Neighborhood Advisory Board Queens 3 and Doug Turetsky served as the Manhattan Borough President’s representative to the citywide Community Action Agency board.