Category Archives: Social and Community Services

Bloomberg Administration Renews Plan to Close Two City-Run Immunization Clinics, Leaving Just One Open

Posted by Doug Turetsky, December 6, 2013

When New Yorkers look back on the administration of Mayor Michael Bloomberg, many are likely to think of the numerous public health initiatives. Indoor and outdoor bans on smoking. Calorie counts on menus. Eliminating transfats. And campaigns against salt and supersized sodas. So it may come as a surprise that during its last days in office the Bloomberg Administration plans to shut two clinics that provide immunizations to low-income New Yorkers.

There are currently three walk-in clinics run by the city that provide thousands of low-income patients with free or very low cost immunizations to prevent diseases such as mumps, rubella, and hepatitis B. The clinics in Tremont in the Bronx and Corona in Queens are set to close while the clinic in Ft. Greene, Brooklyn will remain open. In the first half of 2013 the three clinics served a total of 26,000 New Yorkers ages 4 and older.

To the city’s Department of Health and Mental Hygiene closing the clinics is a matter of dollars and sense. Closing the two clinics, which are each currently open two days a week for a total of 11 hours, will save $433,000 in city funds, according to the health department. There would be no layoffs connected with the closing, all staff would be reassigned; savings would come from leaving vacant positions unfilled and shedding the overhead costs for the two sites.

The city would also have to ante up more funds than in the past if the clinics were to stay open because of federal cutbacks in grants that help pay to purchase vaccines. The city’s health department expects federal funds to New York City for immunizations to fall from $5.4 million last fiscal year to $2.2 million this year.

Keeping the Tremont and Corona clinics open would entail taking on a level of city expenditure that doesn’t make sense to the health department since only about 1 percent of annual immunizations in the five boroughs take place at the clinics, according to the health department. The department notes that immunization rates have been climbing even though other clinics have been closed over the past decade. The health department reasons that by closing the two part-time clinics, the city can focus its resources on keeping the busiest of its three clinics open five days a week in Ft. Greene. Health department officials are assuming that only a portion of those that would lose access to immunizations in the Bronx or Queens will travel to Brooklyn.

This is the second time in recent months the Bloomberg Administration has sought to close the two clinics. Shortly after the City Council enacted the budget for the current fiscal year, which began on July 1, the health department announced it intended to shut the Tremont and Corona clinics, although it was not part of the budget plan. Public health and children’s advocates including the Commission on the Public’s Health System and Citizens Committee for Children protested the move, as did a number of elected officials and unions such as DC 37. The health department reversed the plan in August, at least temporarily.

While acknowledging the loss of federal funding, Anthony Feliciano, executive director of the public health commission, questions whether focusing resources on the Ft. Greene clinic makes sense from a public health perspective. Long commutes to Ft. Greene from the Bronx or Queens would undermine the walk-in nature of the clinics and discourage some individuals and families from getting needed immunizations.

Accessibility has apparently been a draw. Nearly 7,600 patients were seen in Corona during the first half of this year and about 6,000 in Tremont over the same period.

Although the health department contends there are 50 alternative clinics in the Bronx for free or low-cost vaccinations and 22 in Queens, Feliciano expresses concerns about language barriers and cultural sensitivity, especially for undocumented individuals. The Corona clinic sits in the community board with the highest share of foreign-born residents in the city.

Given Mayor Bloomberg’s emphasis on public health initiatives, closing the two clinics would make an odd coda to his last days in office.

Homelessness Up Locally, Down Nationally: But Federal Cutbacks May Soon Drive Up Numbers Coast to Coast

Posted by Doug Turetsky, October 24, 2013

New York City often bucks national trends. That can be a good thing, like when we add jobs following a recession at far faster rate than the rest of the country. But sometimes it’s not so good.

Take the issue of homelessness. Nationally, the number of homeless people has declined over the past six years by 6 percent, years that included a wrenching national recession and a period of rising home foreclosure. Over those same years, the number of homeless families and individuals in New York City has hit record highs, rising by 17 percent even though the recession and foreclosure crises were less severe here.

The number of homeless people nationwide fell from about 672,000 in 2007 to 634,000 in 2012, according to the federal Department of Housing and Urban Development’s 2012 Annual Homeless Assessment Report, which is based on counts during a single night. Over three-quarters of the decline in U.S. homelessness was attributable to fewer homeless families; from 2007 through 2012, the number of adults and children in homeless families declined by nearly 29,000, from about 423,000 to 394,000.

In New York, the numbers swung in a decidedly different direction. In fiscal year 2007, there was an annual average of 34,200 homeless people in the city’s shelter system each night, according to figures from the Department of Homeless Services. By 2012 the number had grown to more than 40,100, an increase of 5,900. In fiscal year 2013, which ended in June, the number of homeless grew by nearly 7,000, an increase of 17 percent, and totaled almost 47,100. This included more than 37,500 children and adults in homeless families. The increasing numbers of homeless was driven in part by the elimination of funding for the city’s Advantage program, which helped people move from shelters to permanent housing by temporarily subsidizing their rent.

Given these opposing national and local trajectories, it’s not surprising that HUD reports that among large cities, New York had by far the largest increase in its homeless population in 2012. HUD’s 2012 assessment report shows an annual increase of about 5,550 homeless people in New York City, a rise of nearly 11 percent. Percentagewise, that’s in line with Phoenix, but more than double the increase in San Francisco. Conversely, Los Angeles, Houston, Las Vegas, Fresno, and Philadelphia saw declines in homelessness that outpaced the 1 percent decline nationwide.

Mayor Bloomberg might contend that the declines in these other cities may have been achieved in part at New York’s expense. As the Mayor famously commented in March, “…you can arrive in your private jet at Kennedy Airport, take a private limousine and go straight to the shelter system, and walk in the door and we’ve got to give you shelter.” The Mayor is right on two counts: about 10 percent of homeless families list their last address as outside the city, as do a higher percentage of single adults, and New York, unlike any other city, has legal obligations to shelter the homeless. But it’s highly unlikely that their path to the shelter system follows the route he describes.

Soon, though, more cities may be on New York’s path. Federal budget cuts—the so-called sequestration—will be taking a toll on housing subsidies and support for homeless services programs. In February, HUD Secretary Shaun Donovan warned at a Senate Appropriations Committee hearing that cutbacks due to sequestration could result in 100,000 formerly homeless people nationwide being thrust back into homelessness. Donovan also said that an additional 125,000 individuals and families could lose their housing subsidies and as a result be at risk of homelessness.

The loss of rental subsidies is a particular risk for New York and could lead to some households currently receiving assistance falling into homelessness and also impede the city’s ability to provide subsidies that help the homeless leave the shelter system. As IBO noted in its report on the Mayor’s Executive Budget in May, the city’s Department of Housing Preservation and Development is expected to lose $36 million in federal Section 8 rent subsidies this fiscal year. City officials planned to tap a reserve fund to cover part of this year’s loss, but the budget hole remains completely unfilled for the ensuing years. A combination of cutbacks by Washington in federal fiscal year 2013 means the city’s public housing authority could lose $78 million in its share of Section 8 subsidies.

In 2004, the Bloomberg Administration set an ambitious goal of reducing New York’s homeless population by two-thirds by 2009. Instead, the city’s homeless population has grown. Now federal cutbacks threaten to further increase the number of children and adults without homes in New York—and nationwide.

Homeless for the Holidays, and Beyond

Posted by Doug Turetsky, January 7, 2013

5434134626_b587a4ab35_n


Photo Credit: Flickr/-LucaM- Photograph


Last month, the U.S. Conference of Mayors released a report that offered a discouraging view of homelessness across the country. Among 25 cities participating in a survey by the organization, 15 said the number of homeless in their communities had been increasing and another three said the number had stayed the same as last year. The other seven reported declines.

Some of the biggest cities in the survey admitted turning away a significant share of their homeless population because emergency shelters simply don’t have enough beds. Philadelphia reported turning away a third of those seeking shelter, Charlotte 25 percent, and Boston 20 percent.

New York City didn’t participate in the survey, but it could have provided some stark numbers of its own. Not only is the number of homeless on the rise here, but individuals and families are experiencing ever-longer stays in shelter beds. While court orders dating to the 1980s provide the homeless with a legal right to shelter, some advocates would argue that the city effectively turns people away through its eligibility review process. Still, with a growing number of people entering the homeless system, the city has added new shelter sites in recent months.

Over the first five months of this fiscal year (July-November), an average of 11,184 families, including those with children and adult families without children, spent the night in the city’s shelter system. That’s up by more than 1,600 families, or 17 percent, compared with the same five-month period last year.

These families are remaining in the shelter system more than a month longer on average than last year. Families with children typically spent 355 days in the city’s shelters as of the first four months of fiscal year 2013—up 40 days compared with the first four months of last fiscal year. For families without children, the picture is much the same. Average stays in the shelter system increased by 51 days, to 443 days during the first four months of this fiscal year.

The number of single adults spending the night in a city shelter has also grown by 10 percent, and averaged 9,213 over the first five months of this fiscal year. They, too, are also spending more days on average in the shelter system: 275 days during the first four months of this year, 12 days more than for the same four months last year.

There’s been a steady rise in the number of homeless and longer stays in the shelter system since the city eliminated the Advantage rental assistance program last year . The program had helped the homeless, mostly homeless families, leave city shelters by providing temporary rent subsidies. The program ended after the state eliminated its share of funding for the program, which cost in total about $210 million in 2011. The city’s share of the program’s cost was about $114 million.

Not surprisingly, more people and longer stays are driving up shelter spending. In November, the Mayor added $42.9 million in city, state, and federal funds to the budget for family shelters, bringing the total budget for 2013 to $466.5 million.

But IBO’s Elizabeth Brown says the additional funding is not enough to meet likely costs. Based on recent trends, she estimates that providing families with emergency shelter will cost about $42 million more than the Bloomberg Administration has budgeted for this year. Costs for emergency shelter for homeless single adults have also climbed.

In June 2004, the Mayor announced a five-year plan to cut homelessness by two-thirds. That plan never came close to meeting its goal and in recent months the city has sheltered record numbers of homeless New Yorkers. On Christmas Eve, more than 47,300 children and adults bedded down in the city’s shelters—a population about equal in size to the number of people who live in the upstate city of Binghamton.

State Cuts to the Court System Likely to Carry a Price Tag for the City

Posted by Bernard O’Brien, July 27, 2011

New York State’s budget for this year includes $170 million in savings from cuts to the Office of Court Administration, which has already resulted in the layoff of more than 400 state court system employees, or about 2.5 percent of the system’s workforce statewide. But savings realized by the state from these cuts could mean millions of dollars in additional costs to New York City if the pace of processing criminal cases slows. That’s because people under arrest may be spending longer periods awaiting trial in the city’s jails—additional jail time that will largely be funded by the city.

The likelihood of slower court processing is almost certain. As state Chief Administrative Judge Ann Pfau told the New York Times, “Delays are going to be more built into everything we do, unfortunately….If you are waiting for a trial, the trial that is ahead of you is going to take longer.”

Much of the fiscal effect on the city would show up in the Department of Correction’s budget. More than 70 percent of inmates in city jails on Rikers Island and in borough-based facilities at any given time are detainees, meaning they are being held pending disposition of the criminal charges they are facing. The pace of criminal case processing in the courts is therefore a major determinant of the cost of running the city’s jail system, where the department’s total cost of incarcerating each inmate averages $387 per day.

For those inmates convicted of serious crimes and sentenced to time in the state prison system, the time they will actually spend in state prison (at the state’s expense) is reduced by the amount of time already spent in city custody prior to conviction and sentencing (almost entirely at the city’s expense). So that means the longer prisoners remain in city custody during adjudication of their cases, the larger the city’s—and the smaller the state’s—share of total imprisonment costs.

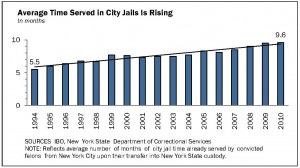
As reflected by the trend line in the graph below, the average amount of city jail time deducted from the state prison sentences of convicted felons from the city has already been moving upward in recent years, rising from 5.5 months in 1994 to 9.6 months in 2010. This trend is consistent with the slower pace of deciding some cases in recent years. While the Office of Court Administration’s own standards call for felony cases to be decided within six months from the date of filing, the percentage of felony dispositions in the city failing to meet that standard grew from 23 percent in 1994 to 37 percent in 2010.

Increases in jail time translate into additional city costs. For example, if slowdowns in case processing result in another month being added to the average time state prison-bound inmates spend in city jails, IBO estimates that the city would incur about $15 million in additional annual expenses at the Department of Correction. In addition, longer periods of incarceration for the thousands of detainees held temporarily in city jails each year but not ultimately destined for state prison—those held on misdemeanor charges, alleged felons ultimately acquitted, etc.—would also result in additional corrections costs borne by the city.

Besides potential increases in corrections department costs, the hit to the city’s budget from delays in criminal case processing could show up in other places as well. For example, police overtime expenditures could be driven up if cutbacks in court staff result in a longer arraignment process, with police officers spending additional time processing arrests. According to a number of recent press accounts, the time from arrest to arraignment has already increased.

So when it comes to cutbacks to the court system to help close the state’s budget shortfall, some of Albany’s savings may come at New York City’s expense.

Recession’s Divide: Food Stamp Caseload Soars, Welfare Caseload Does Not

Posted by Paul Lopatto, September 13, 2010

In stark contrast to the limited effect of the recent economic downturn on the public assistance caseload, the recession has contributed to a relative explosion in the city’s food stamp caseload. Following years of slow growth, food stamp enrollment began to accelerate in the early part of 2008. The number of New Yorkers receiving food stamp benefits has risen from 1.2 million in January 2008 to nearly 1.8 million in July 2010, an increase of 555,000 or 46 percent. [see graph]

The greater sensitivity of the food stamp program to rising unemployment and falling incomes can also be seen at the national level. Federal statistics indicate that in the two-year period between December 2007 and December 2009 the number of food stamp recipients increased by 41 percent, nearly three times the increase in the public assistance caseload. Part of the reason may be a matter of public perception. As public opinion towards receiving welfare became increasingly negative, the food stamp program has emerged as the more acceptable form of income assistance. Moreover, policy changes that have made food stamps easier to access have also boosted food stamp caseloads.

There appears to be another change developing in terms of public assistance as well. The public assistance caseload and spending on welfare grants for city residents have generally followed a downward trend since welfare reform began in the mid-1990s. That pattern has begun to change.

After rising modestly in the last two years, the Mayor’s budget office projects that total grant expenditures will rise by 19 percent to about $1.6 billion in fiscal year 2010 (final numbers are not yet in for the year, which ended on June 30), and to remain at that higher level for the foreseeable future. While economic downturns are commonly associated with greater demand for social services, what makes the increased grant spending especially notable is that it has very little to do with any increase in the number of welfare recipients.

What’s driving the increased spending? One factor is a state-mandated increase in the basic grant, which covers costs other than rent and utilities. In July 2009 the state increased the basic grant by 10 percent, after it had been frozen for nearly two decades. A similar percentage increase was implemented this past July, with a third round scheduled for July 2011.

While this has pushed up total grant expenditures, city revenues have been spared so far. In order to limit the impact of this mandated increase on local budgets, the state agreed to cover the local share of the incremental costs through 2012, using state and federal funds. Starting in 2013, however, the city will be responsible for its share of the costs, adding significantly to the city’s welfare expenditures from that point on.

A second factor driving the cost increases is the Advantage Rental Assistance program, which provides rent subsidies for up to two years to families and individuals moving out of the city’s shelter system. As the shelter population has increased, the Advantage program has emerged as a key component of the city’s strategy for reducing homelessness. Since it began in 2007, the program has moved roughly 20,000 families from shelters to apartments.

The move out of shelters is coming at a rapidly growing cost. In 2009 the city spent $122 million in total funds on Advantage subsidies—city funds cover roughly a third of the cost with the balance coming from state and federal revenues. Costs are projected by the Bloomberg Administration to have reached $188 million in fiscal year 2010 and rise to $207 million in 2011. City officials have recently moved to limit costs by requiring participants to pay a higher portion of their rent out of pocket, and by increasing the number of hours they must work. These changes may well affect the program’s future growth.

Public assistance outlays in 2010 also were boosted by the Back-to-School grant program, which made use of federal stimulus funds to provide one-time grants of $200 per child for families receiving public assistance or food stamp benefits, to purchase school-related supplies. The city budget included $102 million for Back-to-School grants for 2010; the one-time program did not require any city funds.

Just a small portion of the increase in grant costs can be attributed to an increase in the welfare caseload. As the city’s economy started to shed jobs during the recent economic downturn some observers expected a marked increase in the public assistance rolls as large numbers of the newly unemployed sought out government assistance to replace lost income. In fact, after reaching a low of 334,000 in September 2008, the number of public assistance recipients rose slowly, reaching 358,000 in December 2009, an increase of 24,000 over 15 months. Since then, the caseload has resumed its downward trend, with 344,000 individuals receiving assistance in July 2010.

The limited effect of the recession on the public assistance rolls provides further evidence that city, state, and federal welfare reform policies of the mid-1990s made it more difficult for city residents to access and retain public assistance grants.

Some Community Board Budget Priorities Face Budget Axe, Again

Posted by Eddie Vega, June 4, 2010

As part of the city’s budget process, New York’s 59 Community Boards are provided surveys each year that ask them to rank, by order of importance, government services in their districts. The survey lists 90 services provided by 24 public agencies. This year 46 Community Boards, two less than last year, submitted responses. Some top priorities align with the Mayor’s budget. Most do not. (Click here for the survey.)

While there was some reordering from last year, for example, child protection services jumped from 8th to 4th place, the same items appear in the top 10 priorities for both years. Taking care of the city’s elderly continued to be an important concern for the Community Boards; for the second year in a row, services for the elderly ranked first. Likewise, protecting young people and developing their talents has weighed heavily in the boards’ considerations. Programs and services intended to help young people find jobs and access educational opportunities and to protect children from abuse scored high in the rankings: youth development services, after school/summer school programs, and child protection services, took 2nd, 3rd, and 4th place, respectively. Also important were parks and public safety: parks maintenance (down from last year’s 2nd place finish) and police patrols of public housing and transit along with auxiliary patrols tied for 5th place. (See IBO’s blog About Those Services You Prioritized on last year’s Community Board rankings.)

The surveys also identified the priorities by borough. Services for the elderly were among the top two priorities for each of the boroughs except Staten Island, where it dropped to 14th from 12th place last year. Youth development services were among the top five priorities in each of the boroughs except Staten Island, where it ranked 24th. There was greater variation in rankings of after-school programs: after-school was included among the top three priorities in Brooklyn, the Bronx, and Manhattan, but was ranked 11th in Queens and 38th in Staten Island. And while branch library services ranked in the top 10 citywide (with a rank of 7th), Brooklyn and Staten Island community boards ranked it even higher at 2nd and 3rd, respectively.

As was the case last year, the Mayor’s Executive Budget proposes cuts to some of the services at the top of the Community Boards’ priorities. If enacted as written, the budget for 2011 would provide the elderly with fewer places to socialize and receive services because 50 senior citizens centers serving a total of 1,600 seniors would close. There would be fewer and busier child protection specialists to investigate complaints of abuse and neglect after the elimination of 32 units in the Division of Child Protection and a projected increase of the average workload for investigators from 9.5 cases to 10.9 cases. The parks might not be as well maintained after a reduction of 113 full-time equivalent positions for seasonal workers who clean, maintain, and provide security in the parks; also, four swimming pools would close and the pool season would be shortened by two weeks.

Other youth service-related cuts proposed in the Mayor’s budget include the elimination of Out-of-School Time programs at 33 schools that currently provide activities for 4,110 elementary and middle school children—about 7 percent of the 61,000 youth now served by the program. Additionally, there’s a $2.7 million reduction (7 percent) to school-based Beacon Centers, which provide after-school and other youth and family oriented programs.

A proposed $31.2 million cut in subsidies to the city’s public library systems would have a substantial effect on another of the Community Boards’ top priorities. This reduction, along with previously planned cuts, would bring the city’s subsidy for the libraries down about 20 percent to $247 million compared to this year’s level of nearly $310 million. The Brooklyn, New York, and Queens library systems have said that the reduced subsidy will mean branch closings and shorter hours of operation at many of the libraries that remain open.

While proposed cuts to youth, seniors, parks, and library services are often reversed in negotiations between the Mayor and the City Council, the challenging budget climate for the next few years means that the restoration of these reductions is far from certain.

Can the City’s Investment in Electronic Medical Records Net Health and Cost Benefits?

Posted by Jenna Libersky, February 11, 2010

As they wrangle over health care reform in Washington, one of the tools that policymakers count on to lower costs while improving medical outcomes is expanding the use of electronic health records. But well before national health reform took center stage, New York City embraced this technological tool.

For several years now, New York City’s Department of Health and Mental Hygiene has had its own initiative underway to help medical practices, particularly in under-served communities, integrate electronic records into their operations. The Bloomberg Administration clearly values the initiative: it added city dollars in the Preliminary Budget to offset state and federal cuts in Medicaid funds previously expected for the program at a time when other health services are facing the budget axe.

In 2007, as part of its Primary Care Information Project, the health department designed and began offering an electronic health record system to city physicians who care for the neediest patients. To qualify for the software and training package offered by the city, providers must have a client base made up of at least 10 percent Medicaid-enrolled or uninsured patients. Doctors must also be willing to bear the costs of hardware, installation, Internet connectivity, productivity loss during implementation, and a $4,000 fee to a fund that rewards providers for quality improvement. The fund offers on average $10,000 per physician for every patient with well-controlled cardiovascular risks and gives higher bonuses for Medicaid-enrolled or uninsured patients with health issues such as diabetes and heart disease.

The project’s budget for 2009 included $4.8 million in city funds and $13.5 million in state, federal, and private funds. One-quarter of the budget covered personnel costs, one-quarter covered supplies and equipment, and the remaining half was paid toward license fees for the software developer, eClinicalWorks, to support each provider that uses the technology. So far, over 1,600 providers have signed up.

The city’s role in this initiative is unusual, especially since many of the doctors derive significant income from private payers. The technology is more commonly used by large for-profit medical providers. But the city is targeting its efforts to smaller and less specialized practices.

Unlike standard electronic health records for which the purpose is simply to improve clerical efficiency, the city’s product has an additional goal: to improve public health by tracking health trends across all providers who participate in the system. Using the combined data from small practices can help health officials identify trends and potential risks to public health.

The health department’s system can also help individual patients by reminding doctors to monitor blood pressure and cholesterol, discourage smoking and alcohol use, offer vaccinations, and screen for depression, cancer, and sexually transmitted diseases. Practice-wide quality indicators and measures of indiviual patients’ progress are shared with the health department, and other participating physicians (with personally identifying information removed), and with the patients themselves.

The health department hopes the system will yield cost savings for the health system as a whole, as patients are less likely to need costly interventions to manage chronic conditions. But it is too soon to tell yet if the city’s investment in the system will actually result in savings. Academic research suggests that compared to paper records, electronic health records lower medical chart filing and transcription costs, increase revenue through more accurate billing, reduce the number of drugs and diagnostic tests prescribed, and prevent costly mistakes in administering drugs. One recent study showed net losses to providers within the first year of adoption but benefits that rose sharply in the years following, totalling $86,000 in net benefits per provider over five years.

Given the potential for savings, the city would expect a return on its investment. However, the direct effect of the new system on the city’s bill for health care—$5.5 billion for Medicaid and $3.5 billion for employee and retiree health benefits in 2010—is largely unknown. While electronic records can help doctors directly by lowering their administrative costs, a reduction in the city’s health care tab will depend on a couple of key factors. One factor will be the share of patients covered by plans that provide a flat fee to doctors for patient care. The other factor will be the degree to which private insurers and Medicaid managed care companies translate lower costs of care for doctors receiving a flat fee—mostly due to electronic records leading to fewer tests and procedures—to lower premiums paid by the city.

For the city cost savings from the health record initiative remain somewhat speculative. But, like other investments it has made (think calorie labeling and transfat bans), the city expects to see clear health benefits for its efforts.

Program Changes Become Roadblocks to Meals and Other Senior Services

Posted by Nashla Salas, November 19, 2009

When the Bloomberg Administration started reorganizing services for older adults about a year and half ago, it began with two fundamental programs funded by the Department for the Aging: case management and home-delivered meals. The agency realigned its case management system for evaluating and coordinating services for seniors, which resulted in a new route for how the city’s seniors apply for home-delivered meals and other services.

But seniors soon encountered speed bumps along the new route as they sought to receive meals. Rather than having more choices as designers of the new system promised in terms of meals, including frozen meals and frequency of delivery, seniors faced delays.

Under the new plan, seniors could no longer just contact a local senior services agency that provides home-delivered meals and apply for their assistance. The coordination of all in-home senior services is now centralized under a new case management system. While there were case managers before, neighborhood senior centers also often provided service coordination.

The old case management system served approximately 14,000 clients. The new system, which carved the city into 23 service areas with organizations contracted to evaluate needs and coordinate services for seniors, was expected to add about 4,000 new clients during a transition period from April 2008 to June 2008.

But seniors taking the new case management route to home-delivered meals and other services soon encountered roadblocks: many of the new case managers had more cases then they could handle, especially in some service areas. Depending upon the area, case managers were handling caseloads ranging anywhere from 47 clients to 106 clients.

The unexpectedly high caseloads meant that efforts to complete client needs evaluations fell behind schedule. Since seniors needed to complete a caseworker evaluation before they could get home delivered meals, the backlog among some casework providers prevented some clients from receiving meals and other services.

Recognizing the problem, Department for the Aging Commissioner Lilliam Barrios-Paoli told the City Council in late September that in an effort to reduce backlogs and caseload ratios by enabling providers to hire additional staff, start-up funding was extended past the original transition period and the provider contracts for the service areas were modified based on community need. As a result of the contract changes, five providers had their funding increase, two had a decrease, and the maximum number of clients served by any case manager fell to 88.

So seniors would not be forced to wait for long periods before receiving their meals, the Department for the Aging also temporarily waived requirements that caseworkers complete their evaluations before services could begin. Providers of home-delivered meals could start bringing meals to seniors based on the presumption that they qualify. Seniors are then referred to a case management program within 120 days so eligibility can be confirmed and the need for any other services assessed.

The initiative to overhaul the case management and home-delivered meals programs arose from projections of an increasing senior population. Demographers project that New Yorkers 60 and over will make up one fifth of the city’s population by 2030, outnumbering school-aged children. To ensure the city has the capacity to meet the needs of this increasing population, the Mayor began an overhaul of the Department for the Aging’s case management, home-delivered meal, and senior center programs.

The plan to turn senior centers into “Healthy Aging Centers” and address Bloomberg Administration concerns that roughly 40 percent of the city’s more than 320 centers are underused provoked the most controversy and was put on hold. Given the difficult introduction of the changes to case management and home-delivered meals, the plan for senior centers may remain on hold a while longer.

City’s Food Stamp Enrollment Surges

Posted by Paul Lopatto, October 22, 2009

Earlier this week it was widely reported that the number of homeless families had hit a record high in the city. Less noticed has been another record increase: As of August there were nearly 1.6 million New Yorkers on the food stamp rolls.

The rapid increase in food stamp enrollment began in early 2008, following years of relatively slow growth. From January 2008 through August 2009 food stamp enrollment increased by 354,000 persons, expanding the caseload by nearly 30 percent. Based on the current average monthly grant, the increase of food stamp recipients over the same period should result in about $680 million annually in additional federal assistance to low-income city residents, a level that’s juiced by the increase in benefits under the stimulus act.

While food stamp enrollment has fluctuated significantly over the last few decades, the pace of growth over the last year and a half has been unmatched since the early years of the program in the 1970s. It is likely that some of this growth can be attributed to policy initiatives by both city and state officials to increase the share of eligible people who enroll in the program.

At the city level, the application has been shortened and the hours of operation at some food stamp offices has been lengthened. As part of a statewide initiative the city’s Human Resources Administration has also been implementing new systems that make better use of information technology to allow for off-site electronic filing of applications and supporting documents, and recertification of some cases over the phone. In 2008 the social services agency also performed a data match to identify Medicaid recipients who might be eligible for food stamps but never applied, and then did a targeted outreach campaign to encourage them to fill out applications.

While these outreach efforts and initiatives to ease the application process helped boost enrollment, the extensive job losses and resultant income decreases experienced by large numbers of New Yorkers over the last year have significantly increased the pool of people who are eligible for assistance. Evidence from previous economic downturns, as detailed in IBO’s 2008 report Most Food Stamp Recipients No Longer Also Welfare Recipients, suggests that further labor market declines are likely to lead to continued growth in the food stamp caseload. Comparisons with prior recessions, however, serve to highlight the unprecedented magnitude of the recent caseload increases. Monthly food stamp enrollment growth since September 2008 has occurred at three times the rate seen in the last downturn that began in 2001.

The combined effects of the more user-friendly policies and rising economic distress have pushed the city’s food stamp caseload beyond its previous peak of 1.46 million people in April 1995. But current recipients differ from their earlier counterparts in one important respect. In 1995 nearly 80 percent of food stamp recipients also received public assistance; today only about one-quarter also receive welfare benefits.

This separation of food stamps from public assistance began with the implementation of welfare reform policies in the mid-1990s and has continued since. Recent caseload numbers offer further confirmation of the severing of these programs. From September 2008 through August 2009, with the local job market faltering, the number of city residents receiving food stamps increased by 258,000 or 20 percent while the public assistance caseload increased by only 13,000 or 4 percent. This suggests that while negative public attitudes and restrictive government policies toward welfare persist, food stamps have become an increasingly acceptable form of low-income assistance.

This trend is not unique to New York; federal statistics indicate that the divergence of these two key income support programs is progressing on a nationwide basis. From January 2008 to July 2009 food stamp enrollment increased by 29 percent to a record high 35.9 million recipients. While federal welfare caseload numbers are not yet available for 2009, the data indicate that during 2008, with the national recession underway, the number of food stamp recipients increased by 15 percent compared to only 4 percent for public assistance. Although high levels of unemployment could eventually lead to a more rapid movement of out-of-work people onto the welfare rolls, the delinking of food stamps and welfare is likely to persist.

Will Mounting City Job Losses Lead to Soaring Welfare Rolls? Maybe Not.

Posted by Paul Lopatto, February 2, 2009

The New York Times reported this morning that despite rising unemployment, public assistance rolls in 30 states declined or remained flat in 2008, while 20 states had an increase in their welfare caseloads. Does an increase in job losses necessarily lead to an increase in the welfare rolls? Some observers who project increases in the city’s welfare caseload and grant expenditures think so. But evidence from the last two recessions suggests the relationship between job losses and public assistance isn’t so clear. History suggests that the effect on welfare rolls will depend largely on the size of the economic downturn and how government policies treat those applying for and receiving public assistance grants.

From 1989 through 1992, the city experienced a deep recession, with job losses totaling more than 350,000 over four years. The job losses brought about a reversal of a prior downward trend in the welfare caseload. During the years of job losses, the number of welfare recipients increased by 231,000, including a rise of 118,000 in the program for families with children and 113,000 in the program for single adults and childless couples. The link between changes in employment and caseload was quite strong: for every three jobs lost about two more individuals were added to the welfare rolls.

In 1995 the city began to implement new local welfare reform policies that were later reinforced by changes at the state and federal levels. The new initiatives included intensive screening of new applicants, work requirements, and the use of job placement firms to push recipients aggressively into the paid workforce. The changes affected the ability of city residents to access and retain public assistance grants. The new policies helped to bring about a long period of caseload decline, with the total number of welfare recipients dropping by 60 percent between March 1995 and September 2001.

In early 2001, the city once again began to slide into recession. Later in the year, the attacks on the World Trade Center pushed the economy into further decline, leading to heavy job losses. By the end of 2003, the city had suffered a net loss of about 220,000 jobs. Compared to the prior recession, the rise in unemployment had a much smaller effect on the public assistance caseload because of the more restrictive welfare policies. In fact, the caseload of families on welfare continued to decrease. (It leveled off for a while in 2003 before resuming its decline.) Over the same period the caseload of single adults increased by a modest 20,000, but far less than in the prior downturn.

These findings are relevant today, since the more restrictive welfare policies remain largely in place. Although it is likely that large job losses in the next few months or years would lead to an upturn in the city’s public assistance caseload, IBO expects the welfare reform policies that began in the mid-1990s to limit their effect. Any increase in the city’s welfare caseload would likely lead to further increases in the Medicaid and Food Stamp rolls, since eligibility for public assistance generally makes an individual eligible for both of these programs.