Featured Resources
Fiscal Brief
September 202
Getting a Read on Library Subsidies:
City Support for the Library Systems Has Grown,
Did Public Use Rise Too?
PDF version available here.
Summary
For years, the city’s three independent public library systems—New York (serving Manhattan, the Bronx, and Staten Island), Brooklyn, and Queens—often faced annual swings in the level of their subsidies from the city. Over the past decade that changed, and even with large cuts to many services in the city’s most recent budget, the fiscal year 2021 subsidy for the three library systems has so far remained largely unaffected and totals $426 million.
In 2016, when the Mayor and City Council last increased the library subsidy by a substantial amount, there were several explicit goals, including ensuring that all library branches were open at least six days a week. IBO has examined whether branch libraries met goals for increasing hours, circulation, programming and other indicators, comparing usage in 2015 with 2017. Among our findings:
With branches only just beginning to reopen on a limited basis since the onset of the Covid-19 pandemic and the city continuing to face steep budget shortfalls, it is unclear if current subsidy levels for the libraries will be sustained.
Subsidies Rise
The coronavirus pandemic and resulting economic fallout has wreaked havoc on New York City’s budget, costing billions in lost revenue and leading the de Blasio Administration to present a Citywide Savings Program that included a combined $3.1 billion in budget savings for 2021 between the Executive and Adopted Budgets.1 Yet the 2021 budget continued a decade-long pattern of avoiding reductions in the subsidy payments to the city’s three library systems.
Although most agencies experienced some cuts, the Citywide Savings Program did not affect the subsidies given to the city’s three library systems for 2020 or 2021—even though all of their branches were shuttered for months and are now only gradually reopening. It is unclear when full in-person services and programming may resume. Not only have the libraries not seen a cut to their subsidies since 2011, they have instead had several subsidy increases in the intervening years.
Most notably, in 2016 the City Council and the Mayor increased the libraries’ subsidies by a total of $43 million over what had been initially planned by the de Blasio Administration prior to adoption of the budget for that year, for a total subsidy across the three systems of $365 million. This $43 million was later baselined (added to the planned budget) for 2017 and beyond.2 The systems received another increase of $30 million in 2020, of which $16 million was baselined by the de Blasio Administration and $14 million was added by the City Council for 2020 only.3 This came after a smaller $8 million total subsidy increase in 2019 as well as modest increases in 2017 through 2019 that were not the result of initiatives to increase library service. Instead, they resulted from technical changes in a number of budget line items, such as collective bargaining and health insurance costs, totaling $22 million over the three years.
In the budget adopted for 2021, the Council added $11.9 million in funding for just this fiscal year, only slightly less than the $14 million in such funding that was added in June 2019 for the 2020 fiscal year. Due to additional small increases in budget line items such as those mentioned above, each system’s budget for 2021 is virtually the same as its 2020 budget.
Since several months of the 2020 fiscal year were disrupted by the coronavirus pandemic, it would be difficult, if not impossible, to assess how that year’s subsidy increase affected library services. Instead, this brief focuses on the larger 2016 increase, looking at how library service indicators changed with the provision of additional resources. One explicit goal of that funding jump was to ensure that all library branches in the city were open at least six days a week. According to the Mayor’s Management Report (MMR), the funding did result in an increase in average weekly scheduled open hours, including six-day service at all branches.
Another goal of the increased subsidy was to expand the branches’ offerings of program sessions. All three systems offer a wide variety of programming, including classes in English for Speakers of Other Languages, game nights for teenagers, art classes for older adults, early childhood literacy programs, job-training sessions, and computer-skills training, among many others. Again, according to the MMR, the number of program sessions held and attendance at these programs did increase in all three systems after the additional funding. Meanwhile, visits to the libraries and circulation of books and other materials decreased or stayed flat across all three systems.
Taking 2015 as a baseline, and comparing it with 2017, this brief goes beyond what the MMR is able to show by using data obtained from District Resource Statements (DRS) and directly from the libraries themselves on each of the systems’ 216 branch libraries, located throughout all areas of the city. The Mayor’s Office of Management and Budget collects data annually from various city agencies to create District Resource Statements to give the city’s community boards detailed information about the services provided in their areas. The resource statements for the libraries provide information on each of the city’s branches.
Using data for individual branches, this brief examines changes in the following indicators: open hours, number of program sessions, program attendance, library attendance, and circulation of library materials. We also describe how changes in these indicators varied across the systems.
Background
Systems.Public library services for New Yorkers are provided by three separate library systems that are not formally part of the city government, although they are largely funded by annual city subsidies included in the city’s adopted budget. The systems operate mainly in city-owned buildings and the city’s capital budget funds construction and major repairs for the branches.
New York Public Library (NYPL) has 88 branch libraries, including the central Mid-Manhattan Library, and four research libraries.4 Thirty-five of its branches are in the Bronx, 13 in Staten Island, and 44 in Manhattan, including all of the research libraries. NYPL also has a Children’s Center located in the Schwarzman Building in Manhattan but reports its programming, circulation, and attendance data separately. Additionally, NYPL circulates e-books and some physical materials from a centralized collection, not connected to any branch. NYPL received $19 million of the $43 million added to the libraries citywide in 2016, for a total subsidy of $161 million. Its 2021 subsidy is $187 million.
Brooklyn Public Library (BPL) has 59 branches, including a Central Library. It also offers Services for Older Adults, which puts on programming at various branches throughout Brooklyn, and a Kidsmobile, which offers programming for youth. The Kidsmobile, along with three other Bookmobiles, also circulate books. Bookmobile circulation counts towards BPL’s total circulation numbers but is not attributed to any specific branch; this is also true for e-book circulation. BPL’s $12 million increase in 2016 brought its total subsidy that year to $102 million; its subsidy for 2021 is $117 million.
Queens Public Library (QPL) has 62 branches, including a Central Library. It also has two Family Literacy Centers and a Teen Annex, each of which offer programming but do not circulate materials. Like the other two systems, QPL does not attribute e-book circulation to any specific branch. QPL received an additional $13 million in 2016, for a total subsidy that was the same as BPL’s, $102 million. However, its 2021 subsidy is slightly higher than BPL’s at $122 million.
Neighborhoods. Neighborhood Tabulation Areas (NTAs) are geographic units created by the Department of City Planning, using census tracts from the 2010 Census. They have a minimum population of 15,000 and their boundaries do not necessarily correspond exactly with the historical boundaries of city neighborhoods; however, this brief will use the term neighborhood to refer to NTAs. Some neighborhoods have no library branches, while the rest have from one to four.
Notes on Methodology. Although there are 216 branches throughout the city, some sections of the brief will discuss a somewhat different number of entities. A few special locations do not count as library branches, but sometimes we treat them as such because the libraries report data separately. Although NYPL’s Children’s Center at 42nd Street is not its own branch, data on the center’s programming, circulation, and attendance are reported separately. Similarly, BPL’s Services for Older Adults and Kidsmobile, along with QPL’s two Family Literacy Centers and its Teen Annex, all report programming data as branches do, although they are either co-located in an existing branch or not situated in a permanent location.
Each system has one large branch that provides far more services than the smaller community branches. In this brief, statistics that refer to community branches exclude the large central branches in the three systems.
At any given time, one or more branches are closed for renovations, which may mean remodeling or replacing aging equipment or structural components such as roofs. These closures can last months to years and can make year-to-year comparisons of specific branches problematic; for example, a branch that was closed for five months in the beginning of 2015 is likely to have a higher number of program sessions in 2017. This is simply due to being open for the full year, rather than due to the subsidy increase. Therefore, branches that were closed for all or part of 2015 are excluded from branch-level comparisons.5 For the more general comparisons of the three library systems, this brief will include these branches, since there were roughly comparable numbers of closures in 2015 and 2017 and branches that were closed for part of a year still contribute to the overall picture of service levels in the library systems.
IBO examined branch-level data on the following indicators: weekly hours open, number of library visits, number of program sessions, program session attendance, and number of items circulated.
Open Hours
One clear impact of the subsidy increases was a jump at all three systems in the average number of hours that branches were open. The biggest impacts were in Queens and Brooklyn; however, in 2017 Queens branches were still open the fewest hours, on average.
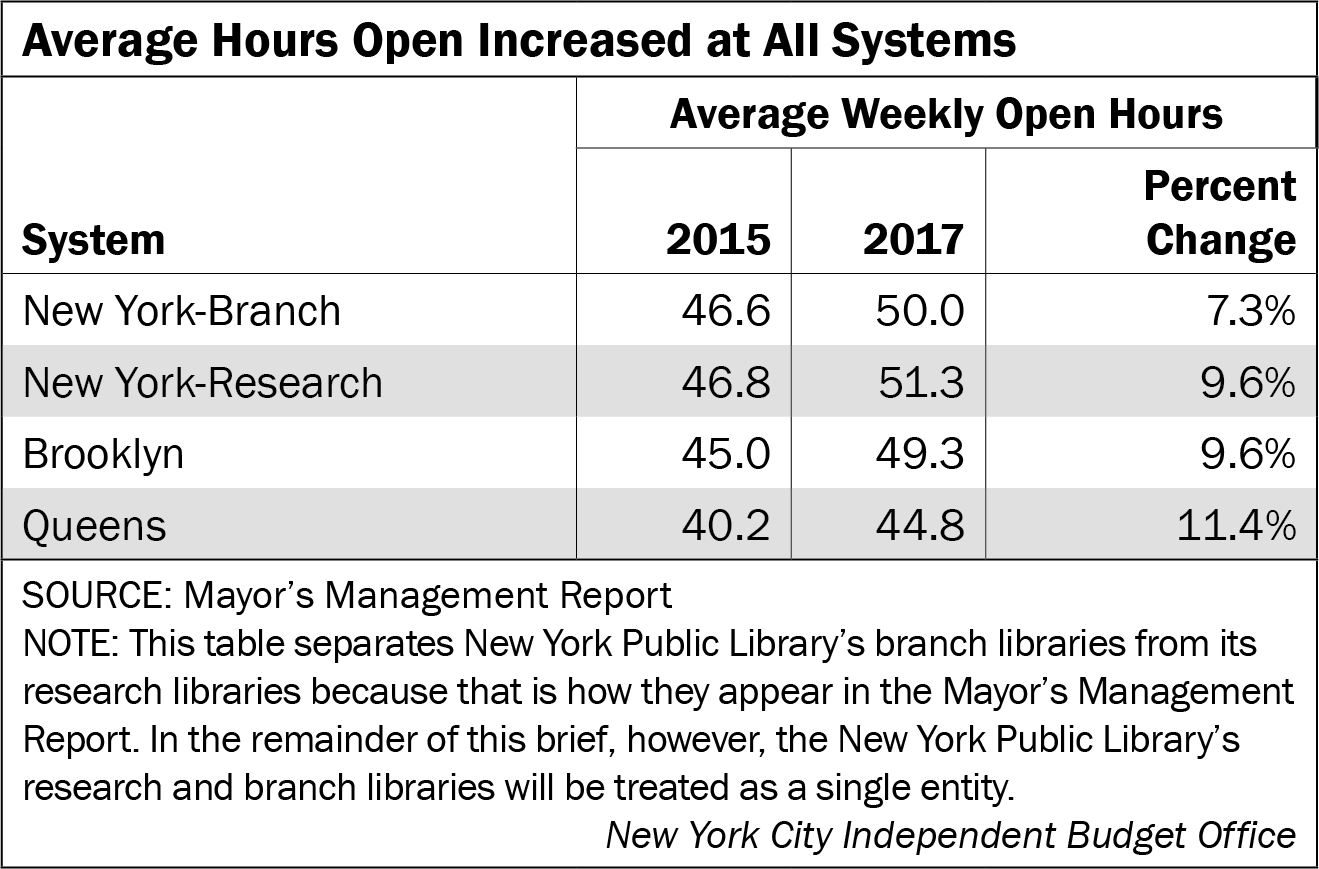
These system-level averages obscure differences in open hours among branches. For example, bigger centralized branches tend to be open for more hours than smaller community branches. District Resource Statements show each branch’s number of weekly open hours for one week in May each year (the specific week can vary from system to system), allowing us to observe whether most branches were able to increase their hours, and if so, by how much. This analysis only includes those branches open during the reporting week in both 2015 and 2017.
These system-level averages obscure differences in open hours among branches. For example, bigger centralized branches tend to be open for more hours than smaller community branches. District Resource Statements show each branch’s number of weekly open hours for one week in May each year (the specific week can vary from system to system), allowing us to observe whether most branches were able to increase their hours, and if so, by how much. This analysis only includes those branches open during the reporting week in both 2015 and 2017.
Twenty-eight branches, 13 in Brooklyn and 15 in the NYPL region, kept the same number of weekly open hours. These branches tended to have been open more hours per week in 2015 than the average in their systems. Similarly, there were 17 Queens branches that were open 47.5 hours in 2015, well above Queens’ average of 40.2 hours in 2015; all 17 of these were open 47.0 hours in 2017. The decline of half an hour of service, on average, still left these branches above the QPL average in 2017. Notably, Queens neighborhoods with two or more branches were more likely to have a branch that went from 47.5 to 47.0 open hours than were neighborhoods with only one branch.
The distribution of weekly open hours is much more concentrated in 2017 than in 2015, with most branches clustering in the 43-53 hour range. A few outliers in both years are notable: Mid-Manhattan was open 80 hours in 2015 and 85 in 2017; Bronx Library went from 72 hours to 78 hours; Brooklyn Central was open 70 hours both years; and Queens Central and Flushing were both open 69 hours in 2015 and 70 hours in 2017.
Programming
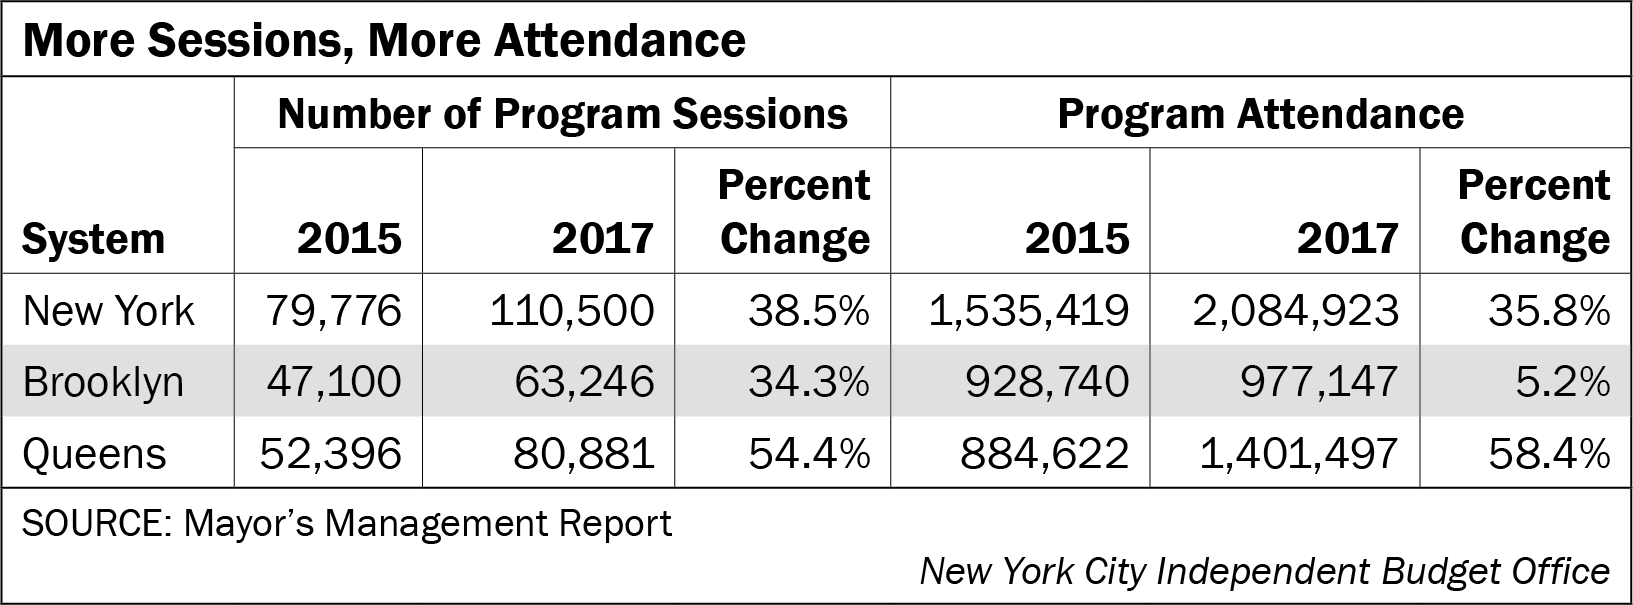
Increasing the amount of programming at branches and participation by library users had been one of the goals of advocates for the increase in funding in 2016. And indeed, the number of program sessions and attendance at programs both rose from 2015 to 2017 in all three systems, with the biggest increases seen in Queens, which had a 54 percent increase in program sessions and a 58 percent increase in program attendance. In both years, NYPL still had by far the most sessions and program attendance of the three systems. Notably, the percentage increase in program attendance for Brooklyn (5.2 percent) was much lower than the percentage increase in the number of program sessions (34.3 percent), leading to a decline in average attendance per session. Due to its more rapid increase in program attendance, Queens had more program attendees than Brooklyn in 2017 even though it had had fewer in 2015.6
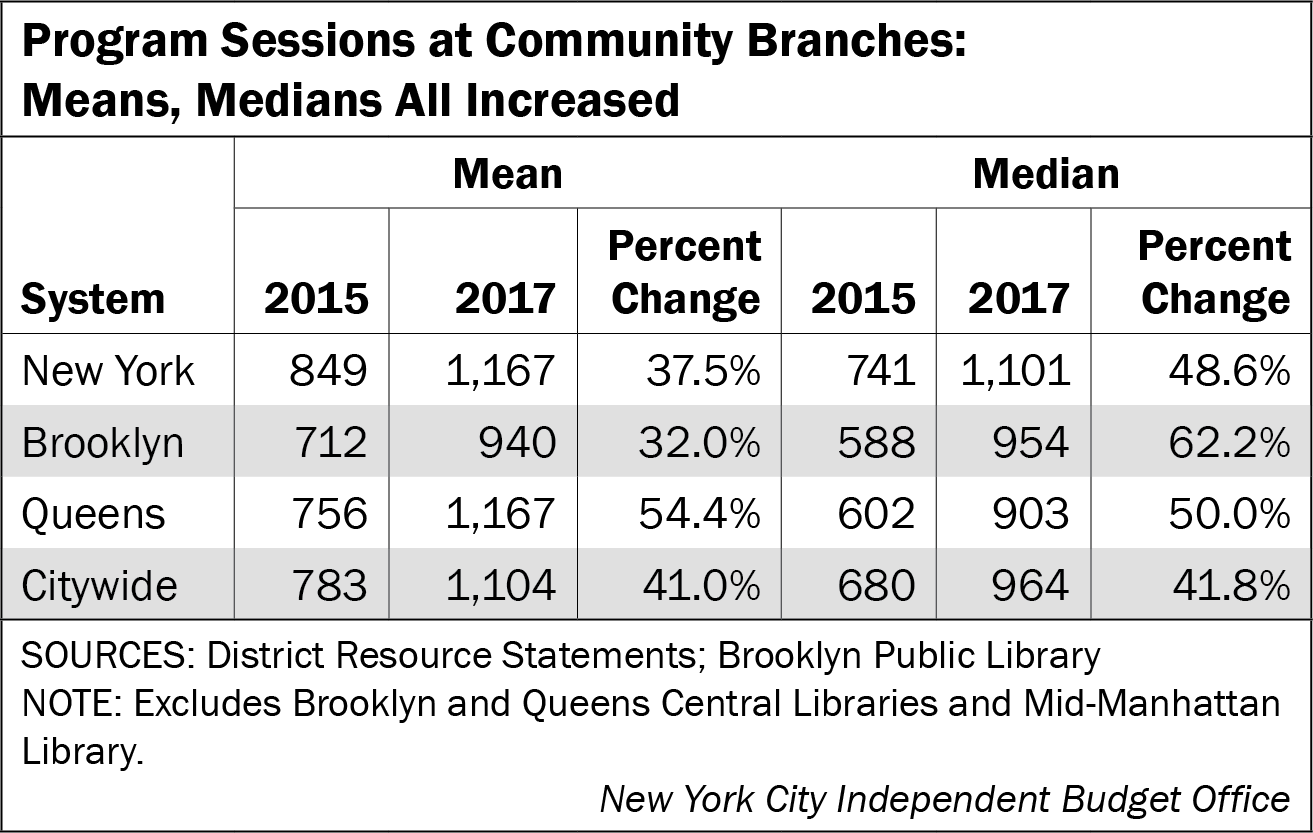
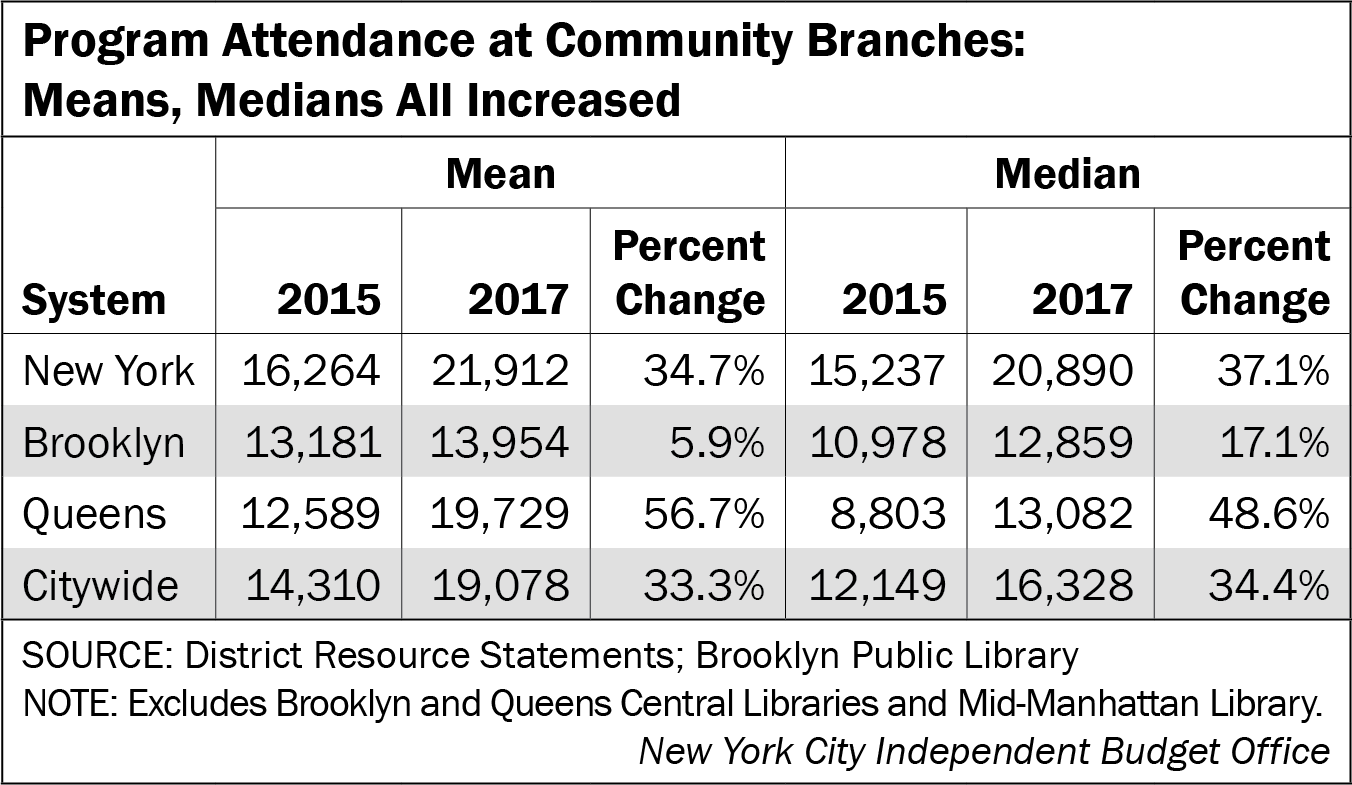
For the most part, the median number of program sessions and median program attendance at branches were lower than the means in both years, indicating that even with the Central Branches excluded, enough community branches offered large numbers of program sessions and attracted large numbers of program attendees to drive the means up.7 For example, NYPL had the highest mean of both indicators for both years, due in part to the fact that of the nine community branches across the city that held over 2,000 program sessions in 2015, four were in the NYPL system: Bronx Library Center, Parkchester (Bronx), St. George Library Center (Staten Island), and Wakefield (Bronx).8
As with total program attendance, median program attendance per branch was lower in Queens than in Brooklyn in 2015, but higher in 2017. This indicates that QPL’s increases in total sessions and total attendance were spread across the system, rather than concentrated in just a few branches.
Across all three systems, 173 branches, or 84 percent of the branches that were open all year in 2015, held more program sessions in 2017 than 2015, while 156 branches (76 percent) of the branches open in 2015 saw more people attend programs in 2017. Among branches that increased program sessions, the average increase was 70 percent, and among those that increased program attendance, the average increase was 67 percent. Thirty-four branches—10 in the NYPL region and 12 each in Brooklyn and Queens—more than doubled the number of program sessions they held, and 25 branches, 17 of which were in Queens, more than doubled their attendance at programs.
Looking at the distribution of program sessions at branches in each year studied we see that fewer branches in 2017 fell into the lowest two ranges of the number of sessions (less than 1,000 programs) than in 2015, and conversely, more fell into the ranges with the higher numbers of sessions in 2017.
Visits
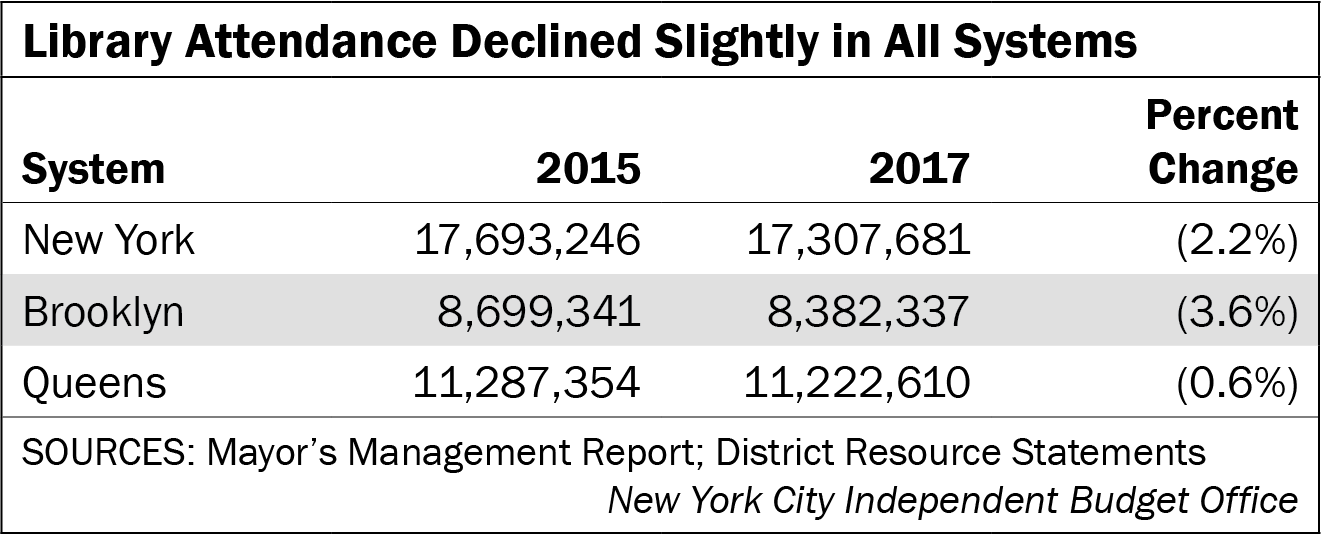
Even while open hours and attendance at programs were increasing, the overall attendance at library branches declined somewhat across all three systems—though the decline in Queens was very slight. NYPL, with the largest number of branches, once again ranked first in the number of visits.
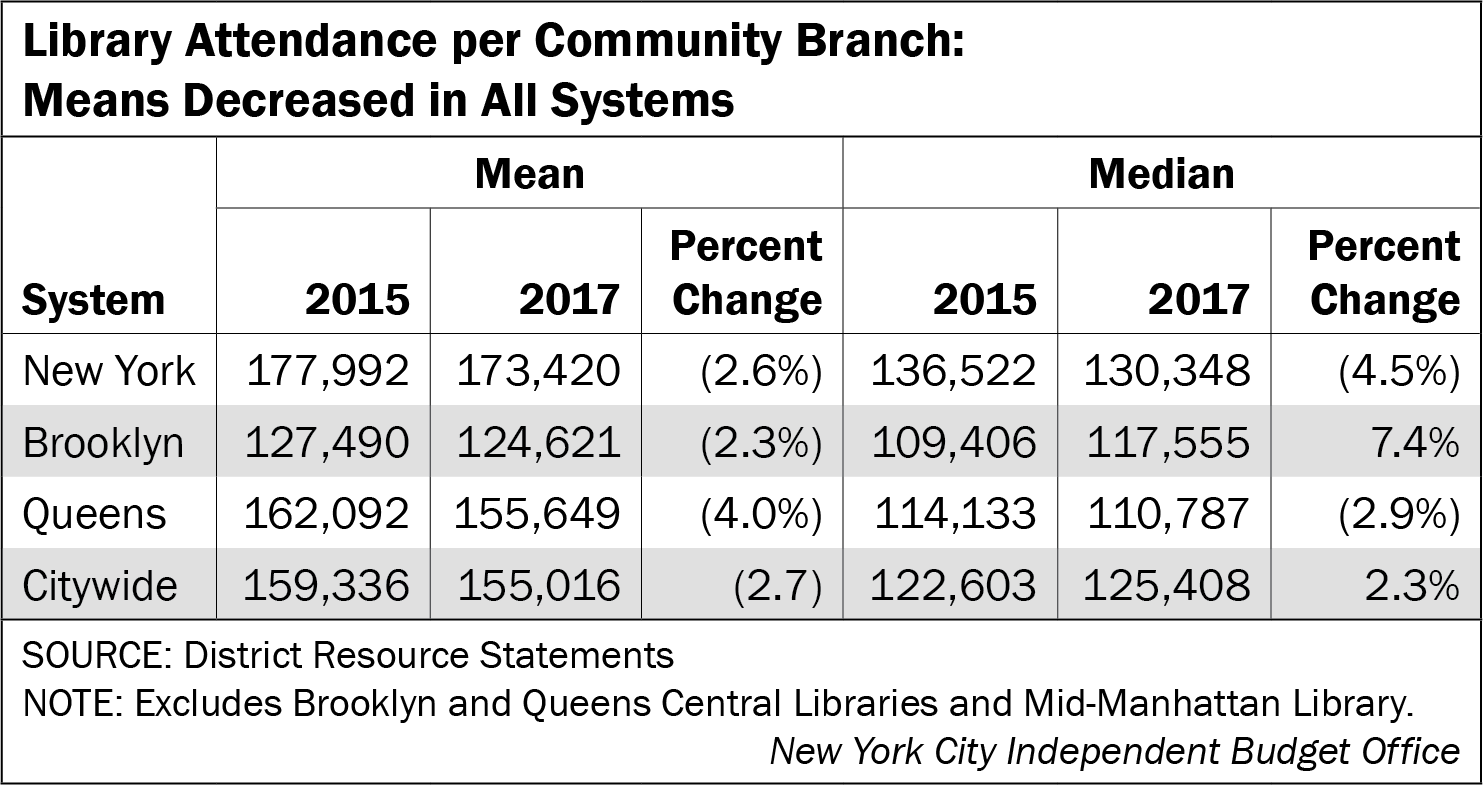
As with programming, the median number of library visits per branch was lower than the mean in all three systems and in both years, suggesting that high attendance at some community branches pulls up the overall means. Examples of branches with high attendance include Flushing and Jackson Heights in Queens, Kings Highway and McKinley Park in Brooklyn, and Schwarzman Research and the Bronx Library Center in the NYPL region. BPL’s median attendance increased from 2015 to 2017 even though it had the steepest decline in total attendance among the three systems.
Only 87 branches (44 percent of branches that were open for all of 2015) had more visitors in 2017 than 2015. The average increase in visits among those branches that did see increases was 12 percent, ranging from under 1 percent to 51 percent at the Soundview branch in the Bronx. With just over half of Brooklyn branches welcoming more visitors in 2017 than 2015, this system’s branches were the most likely to have an increase in attendance. However, the declines among Brooklyn branches that lost visitors were large enough that the system still had the largest percentage drop in attendance over the two years.
Looking at the distribution of the number of visits per branch in each year, we found little difference between the two years, as most branches saw relatively little decline in the total number of visitors.
Circulation
Circulation of library materials, as defined by the number of materials either checked out or renewed, declined or barely increased across the systems in 2017 compared with 2015. However, digital circulation such as e-books, e-audio, and e-video—counted among system-level circulation numbers, but not attributed to individual branches—did increase in all three systems. This is a possible explanation for why library attendance declined: patrons were increasingly likely to check out digital materials, which do not require physically going to a branch.
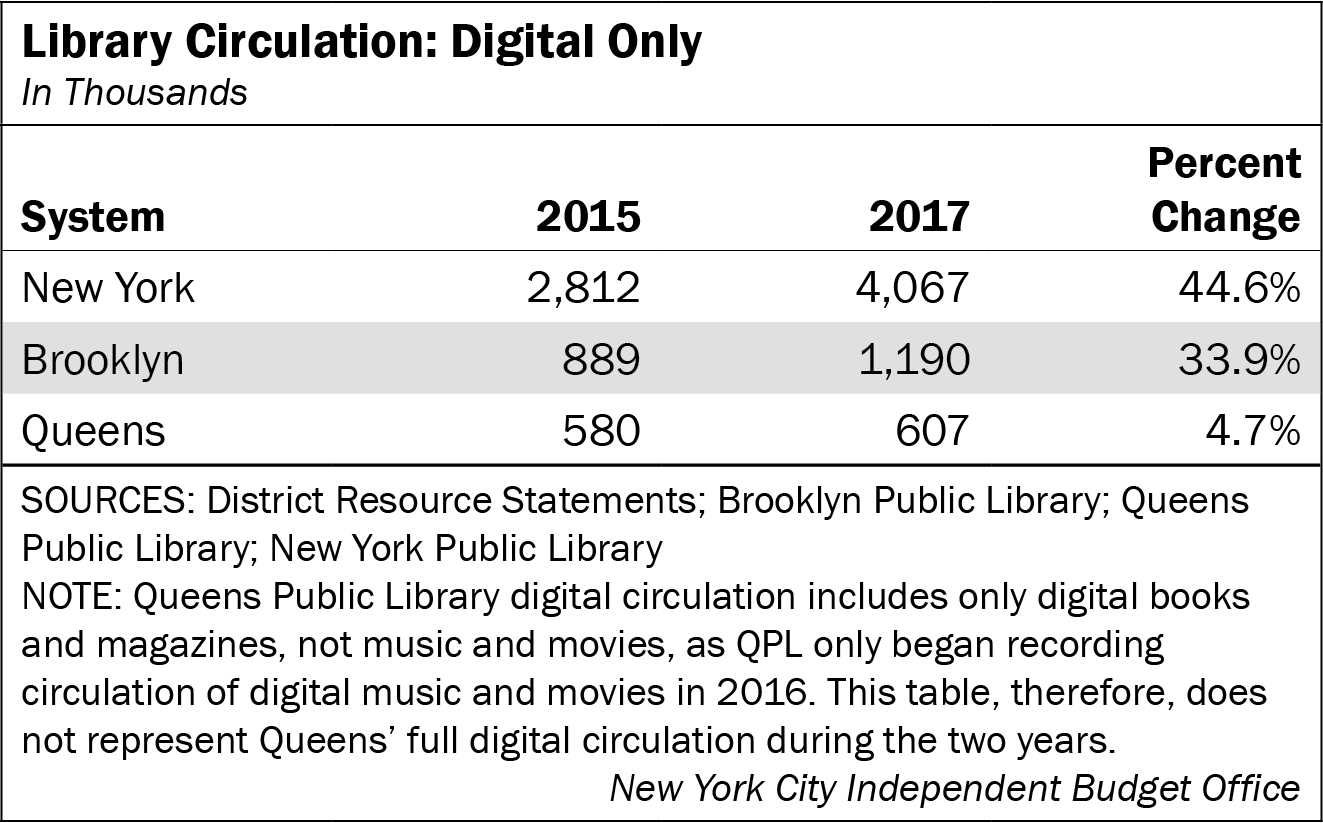
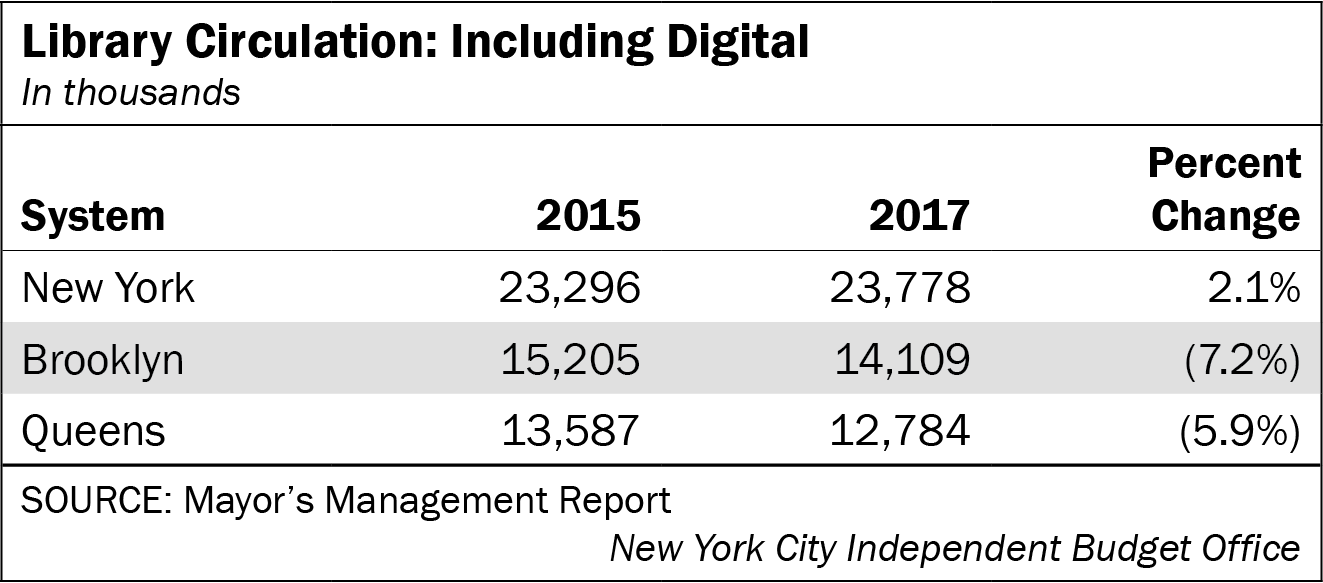
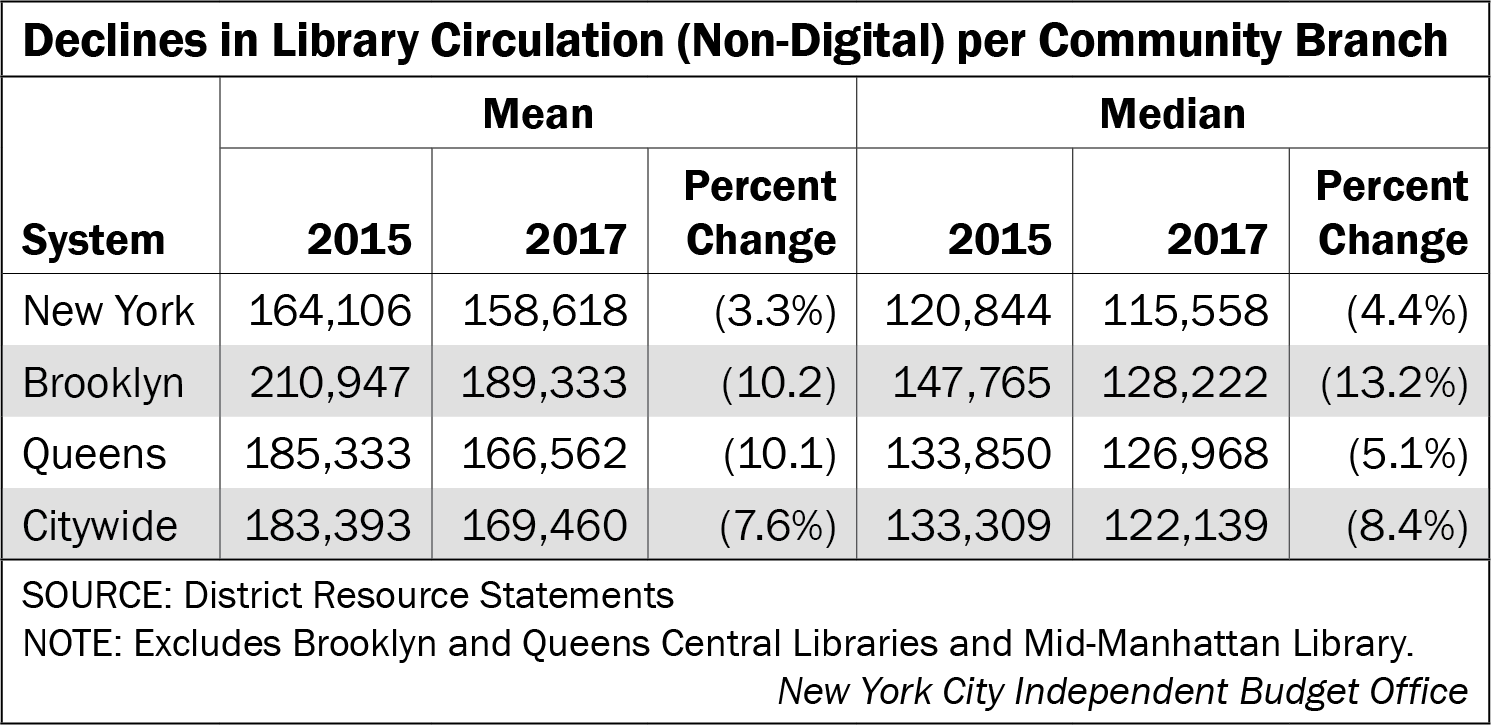
Total circulation, including digital items, in the NYPL region rose from 2015 to 2017. When digital items are excluded from the total, however, both mean and median circulation declined for NYPL. In contrast, total circulation in both the Brooklyn and Queens systems fell over the period, even when digital circulation is included.
Excluding branches closed for all or part of 2015, only 66 branches increased circulation over the two years—as noted above, branch-level circulation data excludes digital items. In each system, roughly a third of the branches open all year in 2015 increased their circulation in 2017, with the increases ranging from less than 1 percent up to a high of 39 percent (Baisley Park, in Queens). The average increase among those that saw a gain was 12 percent.
The distribution of branch circulation totals, which excludes digital circulation, changed only slightly from 2015 to 2017. The number of branches in the lowest range (less than 125,000 items circulated) was somewhat higher in 2017 than in 2015, and the number in the second-lowest range (125,000-374,999 items) was somewhat lower. Otherwise, there were not many changes in the distribution of items circulated. Booking the Changes
Booking the Changes
There were differences among branches in all systems in terms of open hours, the number of programs, program attendance, visitors, and circulation in both years studied. Given a substantial increase in their subsidies in 2016, almost all branches increased open hours from 2015 to 2017, with branches in Queens open fewer hours on average than branches in the NYPL and BPL systems for both years. However, Queens branches in particular were able to increase programming and attendance at programs over the two years. Although circulation in general declined along with declines in visitors, digital circulation increased. Funding for the libraries has thus far remained largely unaffected even as the adopted budget cut spending for some other agencies and programs in the face of shortfalls due to the Covid-19 pandemic, but it is possible that this could change with future budget plans
Report prepared by Katie Hanna
PDF version available here.
Endnotes
1All years refer to city fiscal years.
2Because the libraries’ budgets for 2016 were originally set to be somewhat lower than 2015 spending, before the subsidy increase, the total adopted 2016 budget for the three systems was actually only $34 million more than spending in 2015.
3Similar to 2016, because the libraries’ budgets for 2020 were set to be somewhat lower than the 2019 budget before the increase last spring, the total budget for the three systems was only $22 million more in 2020 than in 2019.
4The Mid-Manhattan Library recently reopened after renovation as the Stavros Niarchos Foundation Library, but this brief refers to the branch as the Mid-Manhattan Library as this was its name during the years studied.
5NYPL’s 53rd Street branch, which opened in fiscal year 2016, is also not included in these comparisons.
6Brooklyn Public Library officials suggest that there might be some undercount for program sessions and program attendance for 2015. If so, the increase from 2015 to 2017 would be overstated.
7The median indicates the midpoint of the distribution between lowest and highest values; i.e. the point where half of the observations are above and half are below.
8The three Central Branches also each held more than 2,000 program sessions in 2015.
PDF version available here.