
Featured Resources
Fiscal Brief
July 2021
A Full Accounting
How Much Does New York City Spend On Its Criminal Justice System
PDF version available here
Summary
Over the past year, much attention has focused on how much the city spends on policing. But the police department is only one part of a larger system responsible for law enforcement, including adjudication, and, when deemed appropriate, detention and other related functions. IBO has looked at the full cost of what is commonly known as the criminal justice system—from arrest to prosecution to incarceration and its alternatives—and tracked the changes in spending from 2001 through 2020. The report looks at the system as a whole as well as its component parts. Among our findings:
Throughout this report, we have used the term “criminal justice system” to represent all the agencies involved in the process. We recognize that many people involved in policy and advocacy around this system feel the term is a misnomer and conveys certain biases. While the Vera Institute of Justice has begun to use the phrase “criminal legal system,” we did not feel the phrase was widely recognized or understood as representative of the entire system.
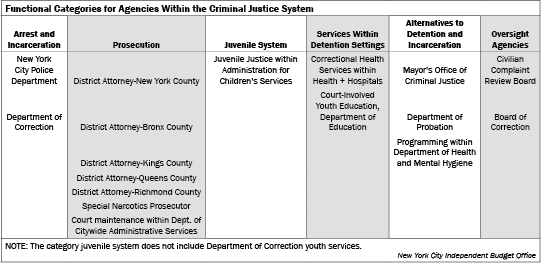
Over the last year or so, a series of highly publicized events in New York and nationwide have led many public officials and activists to focus on the substantial level of funding allocated to the New York City Police Department (NYPD). But as large as it is, the NYPD is only one part of the city’s overall system for law enforcement. In this brief, IBO examines the allocation of funding across the many different city agencies and programs involved in the various functions of the criminal justice system: arrest and incarceration, prosecution, the juvenile system, services within detention settings, alternatives to detention and incarceration, and oversight agencies.
IBO has identified agencies and programs within agencies, which together comprise New York City’s criminal justice system, and grouped them under the system’s various functions in the chart below.
The Total Cost of the Criminal Justice System, And Its Share of the Overall Budget
This brief examines changes to the budget for the criminal justice system from fiscal years 2001 through 2021. Most comparisons will be made among the benchmark years 2001, 2013, and 2020. The first two represent the final full fiscal years of the Giuliani and Bloomberg Administrations; 2020 is the most recent fiscal year completed under Mayor de Blasio. We will also separately discuss fiscal year 2021 as of the 2022 Executive Budget. For the most part, we focus on agency operating budgets and exclude costs that are budgeted centrally by the city including fringe benefits for staff, pensions, debt service, and judgements and settlements of lawsuits. However, the last section examines what the fully loaded budget for criminal justice services would be in 2021 if these additional costs were included in agency budgets.
In 2001, the citywide budget for criminal justice spending for all of the agencies shown in the chart below totaled about $5.1 billion in nominal terms. (Note: All dollar figures from 2001 through 2020 refer to the final modified budget for each fiscal year through 2020; dollar figures for 2021 are based on the 2022 Executive Budget.) In 2013, the total budget for the criminal justice system had increased to $7.2 billion, an increase of about 41 percent over the Bloomberg years (average annual growth of about 3 percent). By 2020, the budget had risen to about $9.2 billion, an increase of 29 percent over the first seven years of the de Blasio Administration (average annual growth of roughly 4 percent).
Overall growth in the operating budget for the criminal justice system from 2001 through 2020 was 83 percent. Adjusting spending for inflation provides a very different picture, however. Real spending on criminal justice rose 1.3 percent over the 19-year period.
Examining the budget by revenue source, the city-funded portion of the criminal justice system budget was $4.6 billion in 2001, $6.5 billion in 2013, and $8.2 billion in 2020. City dollars have consistently made up from 90 percent to 93 percent of all criminal justice system funding from 2001 through 2020, with the exception of the latter year, when the city share decreased to 89 percent. The decrease primarily resulted from the addition of Federal Emergency Management Agency funding available as a result of the Covid-19 pandemic, and reductions in city funds due to budget shortfalls.
The $5.1 billion budgeted for the criminal justice system in 2001 represented about 15 percent of the citywide total of agency operating costs in that year. By 2013 the share had decreased to 13 percent, and then 12 percent in 2020. While justice system spending increased by 83 percent from 2001 through 2020, the total citywide budget (excluding centrally budgeted items) increased by over 120 percent.
Budget Allocations by Functional Categories
While it is useful to look at trends in overall spending on the criminal justice system, we can gain further insight by looking at each of the functional components of the system separately. Spending for arrest and incarceration dominated the budget each year, making up over three-quarters of each year’s criminal justice budget. The most notable shift in spending on other categories occurred from 2013 onward, when the budget for the Department of Probation and alternatives to incarceration increased in both dollars and as a share of overall criminal justice system spending. We discuss the budgets for these and the other criminal justice agencies and initiatives in more detail below.
Arrest and Incarceration. Together, the police and correction departments made up 84 percent of the criminal justice system budget in 2001, and 79 percent in 2020. From 2001 through 2020, combined spending for these two agencies increased 73 percent. Adjusted for inflation, however, spending decreased by 4 percent.
The largest agency in the system is the New York Police Department. The NYPD budget pays for all patrol and enforcement activity, as well as traffic enforcement, transit police, and school safety officers. The police budget increased by 43 percent from 2001 through 2013, from $3.4 billion to $4.9 billion, and by another 24 percent to just over $6 billion in 2020. In total, the budget grew by 77 percent from 2001 through 2020. Adjusted for inflation, police department spending over this period was largely flat, with spending about 2 percent less in 2020 than in 2001.
Roughly 4 percent to 5 percent of the NYPD budget is for school safety agents, who are NYPD employees located in schools across the city.1 Although school safety expenses are paid with intracity funds transferred to the NYPD from the Department of Education (DOE), we have included these funds in the NYPD budget. The school safety budget increased 138 percent from $134 million in 2001 to $319 million in 2020. As part of the 2021 Adopted Budget, Mayor de Blasio reached a compromise with the City Council to move school safety agents to DOE, although this move has not yet occurred.
The Department of Correction (DOC) is the second largest agency within the criminal justice system. DOC oversees security and operations for jails on Rikers Island, as well as the city jails and court pens in each borough. In 2001, DOC’s budget was $835 million. It increased 31 percent, to $1.1 billion, in 2013 and another 19 percent, to $1.3 billion, in 2020. Over the entire 2001 through 2020 period, the DOC budget increased by 56 percent. Spending did not keep pace with inflation, however, decreasing by 13 percent since 2001 in real terms.
The 56 percent increase in spending from 2001 through 2020 occurred over a period when the jail population dropped by 60 percent. As a result, the average annual cost per person jailed (excluding fringe, pensions, debt service, and judgments and settlements) was $56,000 in 2001, compared with $$223,000 in 2020, an increase of nearly 300 percent. Even after adjusting for inflation, the cost per inmate increased 121 percent.
Prosecution: District Attorneys and Court Maintenance. In New York City, each of the five counties has an elected District Attorney (DA) and there is a citywide Office of the Special Narcotics Prosecutor, an independent prosecutor’s office that deals specifically with felony narcotics cases. The various DA offices also house some funding for alternatives to detention and other community programming. While their budgets are set by the Mayor and City Council, the DAs sometimes receive additional funds from civil asset forfeiture cases. (See here and here for more information.)
The combined budget for the DAs and Special Narcotics Prosecutor increased from $265 million in 2001 to $322 million in 2013, and $460 million in 2020. While funding increased by 74 percent over these two decades in nominal terms, in real terms funding edged down about 3.5 percent. Although the Manhattan and Brooklyn DAs consistently had the largest budgets, the Staten Island office had the largest budget increase at around 160 percent.
The Department of Citywide Administrative Services (DCAS) budget includes funds for maintaining court buildings, a duty which the city shares with the state. The court maintenance piece of the DCAS budget grew from $24 million in 2001 to $77 million in 2020. Altogether, funding for the agencies in the prosecution category has accounted for about 6 percent of the overall criminal justice system budget throughout the 2001 through 2020 period.
The Juvenile Justice System. The Department of Juvenile Justice, formerly a stand-alone city agency, was absorbed into the Administration for Children’s Services in 2011. The juvenile system includes detention centers for youth, as well as placements for adjudicated youth, alternatives to detention and placement for youth, and preventative services. The budget for juvenile system programs has increased from $110 million in 2001, to $207 million in 2013, and $285 million in 2020. From 2001 through 2020, the budget increased by about 160 percent; adjusted for inflation the increase was 44 percent.
In recent years, spending increases have been associated with major changes in policy. The Close to Home policy was a joint city-state initiative in 2013 that shifted the placement of New York City juvenile offenders from upstate institutions to facilities in or near the city. Raise the Age legislation was a statewide initiative that moved the processing of most 16- and 17-year-old offenders from the adult criminal system to the juvenile system in 2018 and 2019.
The juvenile system budget accounted for about 2 percent of overall criminal justice system spending in 2001 and 3 percent in 2020.
Services Within Detention Settings. In addition to the costs of holding individuals in detention settings in the adult jail and juvenile systems, the city pays for health care and educational services for these populations. In 2020, this category accounted for about 3 percent of total criminal justice system spending.
The budget for correctional health services is separate from that of the Department of Correction. Prior to 2015, Corizon, Inc., a for-profit company under contract with the city’s Department of Health and Mental Hygiene (DOHMH), provided these services. In 2015, the de Blasio Administration transferred responsibility for providing health care in the jails to the city’s public hospital system, NYC Health + Hospitals. Over the past two decades, the cost of providing correctional health services grew from $125 million in 2001 to $281 million in 2020, an increase of 124 percent.2 In real terms, the increase was 24 percent.
The Department of Education operates classes within both juvenile secure and non-secure facilities, as well as at Rikers Island. Passages Academy serves youth in secure and non-secure facilities, including youth facilities in or near the city. The East River Academy provides classes at Rikers Island as an option for 18- to 21-year-olds. Spending on juvenile education increased almost 50 percent from 2009 (the earliest date for which we have data) through 2020, while spending on the East River Academy decreased about 22 percent from 2005 through 2020. The decrease may be related to declines in the jail population over this period.
Alternatives to Detention and Incarceration. This category includes alternatives to incarceration and community-based violence reduction programming found within the Mayor’s Office of Criminal Justice (MOCJ), neighborhood programming and community supervision under the Department of Probation (DOP), and some programs within the Department of Health and Mental Hygiene, specifically DOHMH’s community interventions for individuals with mental illness interacting with the criminal justice system. This is not an exhaustive list and pieces of some of these programs span other agencies, but not enough detail was available to identify them. The parts of the programs that have been excluded are relatively small, however, and IBO does not expect that they would substantially change the results of this analysis.
The budget for alternatives to incarceration and community programming increased 163 percent (46 percent with inflation), from $285 million in 2001 to $752 million in 2020. As a result, spending for this category has grown from 6 percent to 8 percent of the overall criminal justice system budget over the period.
The budget for public defenders and community-based criminal justice system programming grew considerably from 2001 through 2020, with most of the increase occurring after 2017. The Mayor’s Office of Criminal Justice undertook several reforms to the system during this period in order to curb jail stays and expand alternatives to incarceration, with the intention of ultimately closing and replacing Rikers Island. This period of MOCJ’s growth was primarily driven by increased spending on contracts for community-based organizations. These contracts are for a range of services, including supervised release and other alternatives to detention and incarceration, re-entry services, victim services, and other programs. MOCJ’s budget for these services and programs grew by 67 percent from 2013 through 2017, and 151 percent from 2017 through 2020. MOCJ also funds the contracts for public defenders. These contracts grew by 157 percent from 2001 through 2020, from $141 million to $363 million
The Department of Probation is primarily a community supervision corrections program for both adults and youth who are awaiting sentencing or are already sentenced. DOP accounted for about 2 percent of all budgeted criminal justice system funds in 2001 and 1 percent in 2013 and 2020. The department’s budget increased only 9 percent from 2001 through 2020, a decrease of almost 40 percent when adjusted for inflation. DOP’s budget decreased by 20 percent from 2001 through 2013, and then increased by 37 percent through 2020. According to the Mayor’s Management Report, the number of adult pre-sentence investigations performed by the department, along with the number of supervision cases for both adults and juveniles, have declined each year over the past decade, which is consistent with the year-to-year declines in NYPD arrests.3 This likely contributed to the decreases in the DOP budget in the years prior to the de Blasio Administration.
In addition to pre-sentence investigations and post-sentence supervision, DOP delivers various services and programs including the NeON community center network, which is open to people under supervision of DOP, as well anyone else in need of the services provided there, such as nutrition, arts, and sports programming. DOP also oversees or collaborates on various mentoring programs, restorative justice efforts, and other specialized programming for both youth and adults under supervision. Spending on contractual services in these areas increased greatly during the de Blasio Administration, more than doubling from 2013 through 2020.
During the 2016 and 2017 budget cycles, the city began to fund programs to address the need for crisis prevention and response services for those with untreated serious mental illness at high probability of interacting with the criminal justice system. These community-based interventions are budgeted within DOHMH and were introduced as part of a larger community intervention program, NYC Safe. Funding for this group of programs within DOHMH grew from $12 million in 2017 to $33 million in 2020.
Oversight Agencies. The combined budget for the two criminal justice system oversight agencies, the Civilian Complaint Review Board (CCRB) and the Board of Correction (BOC), made up just a quarter of 1 percent of all criminal justice spending in both 2001 and 2020.
The budget for the CCRB, which handles citizen complaints about the actions of police officers, increased from $9 million in 2001 to $19 million in 2020—less than 1 percent of the NYPD’s budget in each year. The budget for BOC, which has oversight of the city jail system, increased from just under $1 million in 2001 to nearly $3 million in 2020; as was the case with the CCRB, this was less than 1 percent of spending at DOC, the agency it oversees. The growth in both the CCRB and BOC budgets occurred primarily from 2013 through 2020: BOC increased by 157 percent and CCRB by 67 percent.
A Modest Shift in Emphasis
Over the last two decades there has been a modest change in spending priorities within the criminal justice system. The 79 percent share of funds allocated to NYPD and DOC in 2020 was down from 84 percent in 2001. In contrast, the share of funds spent on alternatives to detention and incarceration increased from about 6 percent to 8 percent. In relative terms, more funds were also being spent on providing health care and education services to people in the city’s jails. On the other hand, in spite of the long-term decline in the number of people arrested each year, there has been no corresponding decrease in the share of the overall criminal justice system budget allocated to the prosecutors’ offices. (See this report for more details.)
Budget Reductions in 2021
Due largely to budget shortfalls caused by the Covid-19 pandemic and the public health measures taken to combat it, most city agencies saw their 2021 budgets decrease compared with 2020 levels. Despite increases and restorations to many agencies using federal or city funds, as of the 2022 Executive Budget, released in April 2021, combined funding for all criminal justice system agencies totals about $8.6 billion in 2021, down from $9.2 billion in 2020. The decrease is largely due to reductions in the NYPD budget, although most of the cuts are for only one year.
Following widespread protests against police brutality, the Mayor and City Council agreed to a number of actions to reduce police department spending in the 2021 Adopted Budget. The largest change was a one time, $295 million decrease in the budget for uniformed overtime. The budget also included one-time savings of $37 million due to reductions in civilian overtime and vacancies in the police cadet corps (the corps provides internships for college students.) The largest recurring change was the elimination of the July 2020 training academy class, which reduced the 2021 budget by $55 million and slowed the replacement of retiring officers. Other recurring changes included reductions in civilian headcount and traffic enforcement agents, as well as various contract savings. Because most of the reductions for 2021 were not recurring, the savings in the budget for 2022 and later years were relatively small, totaling about $83 million each year.
The Preliminary Budget included a reduction in NYPD uniformed overtime spending of $121 million annually for 2022 and later years. However, the NYPD budget for 2021 as of April’s Executive Budget has increased from $5.1 billion to $5.4 billion with the addition of federal funds in the Preliminary Budget and city funds in the Executive Budget. In spite of these mid-year increases, the 2021 budget remains substantially lower than the 2020 budget of $6.1 billion. Among other changes, the additional city funds will pay for a new state-mandated Police Reform and Reinvention Collaborative initiative in 2021 and later years, including 216 civilian positions. Notably, the Civilian Complaint Review Board, the police oversight agency, also received an increase in funds for the police reform initiative, adding almost $3 million and 33 positions in 2022 and the remaining years of the financial plan, for a total 2022 budget of $24.5 million.
As of the 2022 Executive Budget, the correction department budget remains lower for 2021 ($1.1 billion) than in 2020 ($1.3 billion). The 2021 Adopted Budget included reductions in personnel costs, specifically accruals due to hiring delays and uniformed overtime reductions totaling $78 million. Further savings and reductions to the 2021 budget came in the November and Preliminary Budget plans through furlough savings, hiring freezes, and other labor management initiatives. In addition, a nearly $70 million reduction in uniformed overtime has been budgeted for 2022. However, the Executive Budget increased the overall 2022 budget slightly, making use of both federal and city funds. The new city-funded initiatives for 2022 include a recruitment class of 400 correction officers, which the agency asserts is needed to maintain core services.
The 2022 Executive Budget also included increases in community-based programming for anti-violence programs, mental health initiatives, and alternatives to incarceration in both 2021 and 2022. The MOCJ budget saw an expansion of the Cure Violence program and Advance Peace Model, as well as initiatives agreed to as part of the negotiations around the City Council’s approval of the construction of borough-based jails, known as the Points of Agreement. DOHMH also received increases for several mental health initiatives, including NYC Safe.
Accounting for Fringe, Pension & Debt Service Costs, and Judgements & Settlements
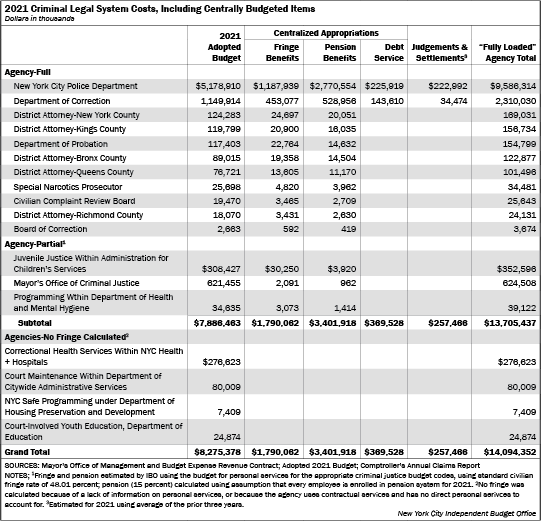
The budgets discussed above include only direct agency costs. As is true for all city agencies, the costs of fringe benefits, pensions, and debt service payments as well as judgments and settlements are funded centrally rather than as part of each agency’s budget. Accounting for additional costs associated with the criminal justice system provides a “fully loaded” cost per agency. In order to get a sense of the size of these fully loaded costs relative to direct agency costs, we have estimated these additional costs for the 2021 budget. Allocating these costs by agency increases the total citywide budget for the system by 70 percent, from $8.3 billion to $14.1 billion in 2021 (as of the 2021 Adopted Budget).
Methodology. IBO estimated the fully loaded budgets for 14 agencies. Figures on direct and centrally budgeted costs were available from the 2021 Adopted Budget for 11 of the agencies. For three agencies that only partially touch the criminal justice system, IBO estimated fringe benefits and pensions by applying the Mayor’s Office of Management and Budget’s 2020 standard fringe multipliers to the 2021 budget for personal services for the relevant budget areas; for the purposes of estimation, IBO assumed all positions were included in the pension fund for that year. We did not estimate centrally budgeted costs for four agencies included in the larger analysis because there were either no fringe benefit or debt service costs incurred by the city (these were mostly contracts and other than personal services), or there was not enough information available for a reliable estimate.
The costs of pensions and fringe benefits make up a larger share of the budgets of uniformed agencies compared with non-uniformed agencies.4 Non-uniformed agencies also tend to have a larger share of their budgets going to contractual services for criminal justice programming rather than direct costs for personal services. Taking into account fringe benefits and pensions for the city’s non-uniformed agencies (excluding the three estimated by IBO), the average costs of non-uniformed agencies is 34 percent higher than the agencies’ direct costs in 2021. In contrast, the inclusion of fringe benefits and pension cost increases the 2021 NYPD budget by 76 percent: $9.1 billion compared with $5.2 billion. DOC’s budget increases 85 percent, to $2.1 billion with the allocation of pension and fringe costs to the agency. Adding debt service, which only NYPD and DOC incur, along with fringe and pension costs, increases the NYPD budget by a total of 80 percent, and the DOC budget almost doubles.
Cost Implications for the City
The city’s decision to provide excused absence leave to employees who contracted coronavirus or had to care for a family member who had the virus had a financial impact on the city. For uniformed employees and many classes of shift- or project-based work schedules, healthy replacements must be assigned to cover for workers unable to work. In agencies with such work schedules, staffing allocations provide for covering normal levels of leave usage, but during the height of the pandemic’s first wave, leave in many of these agencies exceeded normal levels. IBO estimates the cost of all reported excused absence leave and unlimited sick leave in excess of typically observed levels for uniformed employees totaled $152.1 million from March through June 2020.5 The cost-per-hour is calculated as the excess leave used by a worker multiplied by their hourly rate of pay, where “excess” leave is the number of hours of leave used above the average leave usage in the same month of 2019. It is not surprising that the majority of the cost occurred in April, the height of the pandemic, with $27.2 million in excused absence leave granted and $62.4 million in excess uniformed sick leave.
Another central cost that we allocate to the agencies for this analysis are payments by the city resulting from judgements and settlements brought against the city. These payouts are included for only NYPD and DOC, as costs related to any other agency in this list are extremely low, so much so that they are not separately enumerated in the Comptroller’s Annual Claims Report. Based on the average of claims for the prior three years for each agency, this adds an estimated $223 million to NYPD for a total of $9.6 billion, and $34 million to DOC for a total of $2.3 billion. This brings the final “fully loaded” total of the criminal justice system budget to an estimated $14.1 billion for 2021, about 16 percent of the total citywide 2021 Adopted Budget, including costs budgeted centrally, with police and correction together making up roughly 13 percent.
Report prepared by Amanda Gallear
PDF version available here.
Endnotes
1Although they wear uniforms, school safety officers are counted as civilian employees in the headcount data included in the city budget
2ncludes funding within DOHMH. The $281 million differs from the figure IBO included in a 2020 report on correctional health services. The earlier report included the portion of DOC’s budget that goes toward health care and programming as well as hospital ward security, including personnel. For this analysis, those budget functions have been included in the DOC figures
3Department of Probation Adult Investigations by Calendar Year: NYC Open Data, https://data.cityofnewyork.us/City-Government/DOP-Adult-Investigations-by-Calendar-Year/k659-gwja Accessed 11/13/2020. Mayor’s Management Report for FY 2020. https://www1.nyc.gov/assets/operations/downloads/pdf/mmr2020/dop.pdf
4The pension and fringe rates are higher for uniformed agencies due to differences in the types of pensions for which their employees are eligible.