In May, the City of New York released its calendar year 1998 Community Development Block Grant (CDBG) Performance Report, which highlights how the city spent $240 million in CDBG funds. IBO's analysis of the report shows that New York City has once again spent the majority of this federal grant on the rehabilitation and maintenance of housing. In future years, as the city disposes of its city owned stock, more CDBG dollars will become available for the maintenance and preservation of the city's privately-owned housing stock, the construction of new housing, and for other purposes.
Background. The Community Development Block Grant program was established by Congress through the Housing and Community Development Act of 1974 to fund a wide range of activities directed toward revitalizing neighborhoods and promoting economic development. Awarded as an annual grant to municipalities by the United States Department of Housing and Urban Development (HUD), the CDBG program allows communities to develop their own funding priorities but requires that they give precedence to activities that benefit low- and moderate-income households. In general, municipalities are allowed to use the grant to fund housing rehabilitation and maintenance, public services, public facilities and infrastructure improvements, economic development activities and related planning and administrative costs.
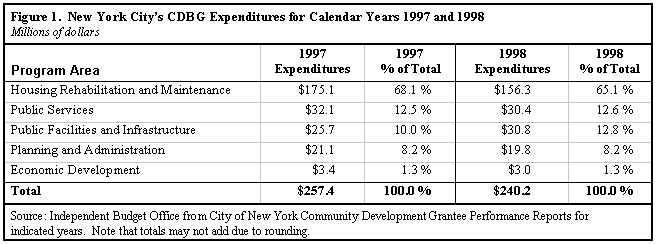
How New York City Spends its CDBG. Revenue received by New York City through the CDBG program supports activities at 19 different agencies and accounts for about 5 percent of the city's federal categorical aid. In calendar year 1998, the city spent $240 million in CDBG funds. As shown in Figure 1, IBO's analysis of the 1998 CDBG expenditures shows that $156.3 million, or 65 percent of the total, was spent on housing rehabilitation and maintenance. This was followed by expenditures on public services (12.6 percent), public facilities and infrastructure (12.8 percent), and planning and administration (8.2 percent). About 1 percent of the total was spent on economic development initiatives.

Focus on Housing. New York City spends more than twice the national average in percentage terms for CDBG-funded housing programs. This is almost entirely attributable to the city's large inventory of in rem (city owned) properties. Without the spending on in rem buildings, the city would have spent slightly below the average for housing programs.
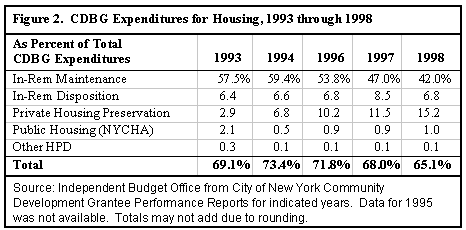
As Figure 2 shows, however, the maintenance of in rem properties is consuming a declining share of CDBG spending each year, from a peak of 59.4 percent in 1994 (when the city stopped taking new properties in rem), down to 42 percent in 1998. As a result, a larger share of funds is available for support of private housing preservation-rising from only 2.9 percent of CDBG funds in 1993 to 15.2 percent in 1998. The city meanwhile continues to use CDBG funds to rehabilitate in rem properties for eventual return to the private or not-for-profit sectors, or to tenants.

Spending for private housing preservation includes emergency repairs to private buildings ($14 million in 1998), targeted enforcement of the Housing Maintenance Code in deteriorating and low-income neighborhoods ($12.3 million), and support for the Housing Litigation Bureau (HLB), which assists tenants in prosecuting landlords for maintenance deficiencies ($4.1 million). Both HPD's code enforcement division and the HLB have struggled with budget and personnel cutbacks in recent years. The less the city must spend on maintenance of city-owned residential buildings, the more resources it can devote to maintaining and enhancing the current private stock, and to programs to help promote new affordable housing construction.
Other CDBG Spending. The following highlights the city's non-housing 1998 CDBG expenditures in greater detail:
Public Services ($30.4 million): The funding of services for the homeless accounted for $15.8 million of the city's CDBG public services expenditures in 1998, including $6.6 million for shelter operations and $5.9 million for security services at homeless shelters. Daycare center services cost $1.7 million. Administration of parks and recreation centers accounted for $4.5 million. CDBG funds were also spent for victims services programs ($2.6 million), and a neighborhood human rights program ($2.8 million). The remaining expenditures were divided among cultural affairs, senior services, youth services, and other programs.
Public Facilities and Infrastructure Improvements ($30.8 million): Of the funds expended by the city for public facilities and infrastructure improvements, $11.5 million was used for vacant lot clean-up and reclamation, and $18.3 million for day care center construction and renovations. Project Greenthumb, which provides materials and assistance for the establishment of neighborhood gardens, also received $0.7 million in CDBG funding.
Planning and Administration ($19.8 million): Of the CDBG funds spent by the city in this area, $9.3 million funded planning, policy analysis and research, mainly to support comprehensive planning activities at the Department of City Planning (DCP). Another $8.5 million supported administrative functions, predominately at the Department of Housing Preservation and Development, and the remaining $2.0 million was spent on DCP geographic information systems.
Economic Development ($3.0 million): In 1998, programs to promote the economic viability of neighborhood retail areas accounted for $1.6 million of city's CDBG economic development expenditures. Another $1.2 million funded improvements to industrial neighborhoods, while the remainder funded a program to help establish open-air markets in economically depressed parts of the city.
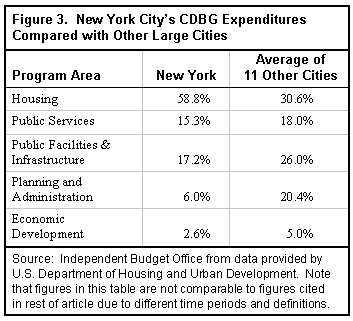
New York versus Other Large Cities. Figure 3 compares spending commitments through September 30, 1998 for New York and the average of 11 other large cities (Atlanta, Boston, Chicago, Detroit, Indianapolis, Houston, Los Angeles, Philadelphia, San Diego, San Jose, and Washington D.C.) by program area.
Besides New York's greater spending on housing-related functions, the city is also exceptional in some other respects. For example, it spends far more both absolutely and in percentage terms on the construction of facilities for children and youth (especially daycare centers) than any of the eleven other cities (16 percent of total spending commitments versus 1 percent). It spends considerably less on general program administration than most of the other cities (2 percent versus 16 percent). And because so much of New York's housing spending goes to the in rem stock, it spends very little-3 percent of total CDBG spending commitments-on rehab of privately-owned units. The other large cities spend an average of 20 percent of their total funding for this purpose.

For more information on this topic or for a more detailed breakdown of CDBG expenditures, please call Preston Niblack, a Senior Budget and Policy Analyst at IBO, at (212) 442-0220.