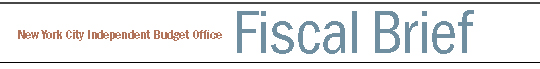
"We Are Being Held Momentarily:"
How Much Time and Money Are New York City Subway Riders Losing to Delays?
PDF version available
here.
Summary
After two days of major breakdowns upended subway service on a number of lines and left many commuters irate, Brooklyn Borough President Eric Adams asked IBO to estimate the time being lost to riders because of these disruptions and to put the lost hours into monetary terms for riders and the local economy.
That the magnitude of subway delays is getting worse is not just a matter of perception. IBO’s review of subway performance data—by line and systemwide—over a period of more than five years shows that service disruptions are taking an increasing toll. The average number of delays in a month has increased dramatically, from about 20,000 a month in 2012 to more than 67,450 in May 2017. The average number of passenger-hours lost during the morning rush grew by 45 percent to almost 35,000 hours from 2012 to the 12-month period ending in May 2017. Among our other findings:
- About one-fourth of weekday train runs have gaps in service—meaning passengers wait longer for subways to arrive than acceptable under the time frames set by the Metropolitan Transportation Authority. Riders on the G were the least likely to encounter service gaps based on monthly averages in January 2015 through May 2017, with 83 percent of train runs meeting service standards. Next best were the D (80 percent) and Q (79 percent). The lines with the largest share of service gaps were the 5 (66 percent of train runs meet standards), 6 (67 percent), and A (70 percent).
- Passenger hours lost to delays on a typical weekday during the morning rush have increased on every line by at least 24 percent from the average for 2012 as a whole through the 12-month period ending in May 2017. Hours of delay have increased most on the J/Z (up 71 percent), C (69 percent), and the 7 (62 percent). Lost hours have increased the least on the 3 (up 25 percent), G (26 percent), and 4 (31 percent).
- The dollar value of the hours lost to delays on a typical workday morning is about $1.2 million a day, or $307 million annually. While this can translate into a steep cost for individual riders, it is a very small cost relative to the size of the city’s economy.
- Much of the impact of subway delays falls on commuters themselves, shrinking the time they have for other responsibilities, such as taking children to school or caring for other family members.
IBO based its estimates on data available from the Metropolitan Transportation Authority. Shortly after we completed our work, the agency announced the introduction of new data that may better capture riders’ experience of waits on station platforms and delays on route.
A series of high-profile service disruptions in recent months have convinced the public that there has been a real and sustained decline in the quality of subway service in New York City, and that subway riders are spending an increasing amount of time in stations and on trains. Following incidents on May 8 and 9, 2017 in which a power outage and signal problems, respectively, caused extensive delays in service, Brooklyn Borough President Eric Adams asked IBO to estimate the time lost to subway delays and impact of these delays on the city’s economy.
IBO’s analysis of Metropolitan Transportation Authority (MTA) subway performance data over the past several years supports the view that delays have grown worse. The monthly number of passenger-hours of delay during the morning peak grew 45.3 percent from 2012 through May 2017, while average weekday ridership on the subway was just 8.5 percent higher.
IBO’s analysis begins with a review of MTA data on subway performance systemwide and by line. We examine how the MTA measures its delays and how the magnitude of the delays has increased over time. Using MTA ridership data we estimate the number of morning rush hour riders on each line to calculate the total number of hours lost on a typical morning to delays. The value of this lost time is estimated in terms of hourly wages. This document summarizes our findings.
The Big Picture: Systemwide On-Time Performance is Declining
The MTA uses several indicators to measure the on-time performance of the subway system. Among these are the subway wait assessment, the terminal on-time performance, and the number and cause of terminal delays. By each measure subway performance has declined in recent years—gaps in service have increased and fewer trains are arriving at their terminal on time, with overcrowding as the most significant cause of delays. At the end of September the MTA announced changes to the data it reports and makes available on the number and extent of delays. As this data was only made available after IBO had completed its research, this analysis relies on the previously described measures.
Weekday Wait Assessment. The MTA carries out its subway wait assessment by calculating the observed length of time between trains and comparing it with the scheduled interval (i.e., the published headway). Service meets the standard if the actual headway is no greater than 25 percent over the scheduled headway. Service gaps are classified as minor (between 25 and 50 percent over the scheduled headway), medium (between 50 and 100 percent), and major (more than 100 percent over the scheduled headway).
The maximum headway on individual subway lines during the morning and evening rush is 10 minutes, in which case the gap is considered minor if the interval between trains is between 12.5 minutes and 15 minutes; medium if the gap is between 15 minutes and 20 minutes; and major if the gap exceeds 20 minutes. However, most subway routes have shorter scheduled headways, and in many stations frequency of service is also greater because two or more routes share the same track or platform. The MTA computes service gaps only between 6 a.m. and midnight. The data were formerly collected through manual sampling, but are now collected electronically and publishes the results of its analyses in the monthly report of the Transit and Bus Committee, available on the MTA website.
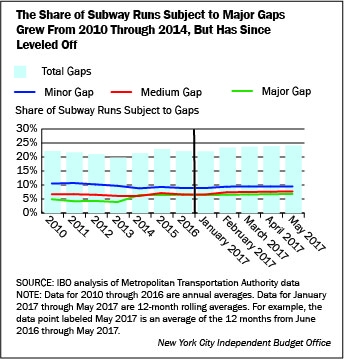
Taking an average over all subway lines in 2010, 22.1 percent of observed weekday headways failed to meet the standard of being no more than 25 percent over the scheduled length.1 The performance of the subway system improved very slightly over the next few years, and in 2013, the share of observed headways failing to meet the standard fell to 19.7 percent. The share of headways not meeting the standard then increased gradually, reaching 24.0 percent for the 12 months ending May 2017. For May 2017 alone, 25.5 percent of headways were more than 25 percent over their scheduled length.
The most recently reported data, covering the period from June 2016 through May 2017, show 6.8 percent of train runs subject to major gaps, 7.7 percent subject to medium gaps, and 9.5 percent subject to minor gaps in service, for a total of 24.0 percent of headways not meeting the wait standard. For 2016 as a whole, 6.5 percent of trains were subject to a major gap, 6.6 percent to a medium gap, and 8.9 percent to a minor gap, a total of 22.0 percent not meeting the standard. On average, “A” Division trains (the numbered lines) had greater gaps than “B” Division (lettered lines), with the 5 and 6 trains having the greatest percentage of trains subject to major gaps (both 13.7 percent).
IBO also examined the wait assessment data by subway line. For each line IBO averaged the monthly percentages of trains meeting the wait assessment standard of no more than the scheduled headway plus 25 percent from January 2015 through May 2017 and compared it with the overall systemwide average. Overall, the G train performed the best on the wait assessment indicator, with an average of 82.5 percent of train runs meeting the standard compared with the systemwide average of 77.9 percent over that period.
As previously mentioned, the amount of time between trains that qualifies as a delay depends on how frequently the trains on a particular route are scheduled.2 The maximum scheduled throughput on a given line is around 20 trains per hour, which implies headway of three minutes. This is approximately the scheduled headway for the L and 6 subway lines during the morning rush. For these lines an observed headway of more than six minutes would be considered a major gap.
The L train performs well despite its short headways, with an average of 79.2 percent of train runs meeting the wait assessment standard. The L is the only line operating with modern communications-based train control. All other lines operate with some form of the block signaling that has been used since the subway system’s inception. The L also benefits from not having to share the track with other subway lines. The 6 line, on the other hand, is particularly susceptible to train cancellations, with NYC Transit, the MTA subsidiary that runs the city’s subways, often unable to dispatch trains at the scheduled frequency.3 As a result, headways on the 6 often exceed six minutes, and the line performs relatively poorly in terms of wait assessment, with an average of 66.8 percent of train runs meeting the wait assessment standard. Overall, the Lexington Avenue lines (the 4, 5, and 6) are among the worst-performing routes.
Subway riders often have the option of using more than one train to reach their destination, particularly in Manhattan. For example, the 4 and 5 trains, as well as the 2 and 3, share track in Manhattan. There are also routes outside Manhattan that cover identical or almost identical paths, such as the E and F in parts of Queens. This redundancy can mitigate the impact of delays on one particular line, but it is frequently the case that delays on one line spill over to other lines using the same track.
Share of Subway
Trains Meeting Wait Assesment Standard, by Route
Monthly Average,
Jaunary 2015-May 2017 |
| Subway
Route |
Met Standard |
| G |
82.5% |
| D |
80.1% |
| Q |
79.4% |
| J/Z |
79.2% |
| L |
79.2% |
| N |
78.6% |
| B |
78.6% |
| 1 |
78.3% |
| M |
78.1% |
| C |
77.9% |
| Subway
System Average |
77.9% |
| R |
76.5% |
| 3 |
76.5% |
| 7 |
74.5% |
| E |
74.1% |
| F |
73.5% |
| 2 |
71.2% |
| 4 |
70.2% |
| A |
70.1% |
| 6 |
66.8% |
| 5 |
66.0% |
SOURCE: IBO analysis of Metropolitan Transportation
Authority data
NOTE: Monthly values are 12-month
rolling averages observed 29 times (from January 2015
through May 2017).
New York City Independent
Budget Office |
Terminal On-Time Performance. Another indicator used to measure the quality of subway service is terminal on-time performance, which is the percentage of scheduled subway trains that arrive at the end of their route (the terminal) no more than five minutes later than scheduled and/or trains that arrive on time at the terminal, but may have missed one or more of their scheduled stops. In contrast to the weekday wait assessments, which only cover 6 a.m. to midnight, the MTA calculates this performance measure over the entire 24-hour day. Looking at the data for the subway system as a whole, we see a marked decline in service since 2011, especially beginning in 2014. In 2011, 85.4 percent of subway trains reached the end of their route within five minutes of schedule, but in 2016 the figure was just 66.8 percent. Performance has continued to decline this year, with the terminal on-time performance in May 2017 falling to just 61.7 percent.
IBO also compared the on-time performance of individual subway lines with the systemwide average. For each subway line IBO has computed the share of trains that arrived at their terminals within five minutes of schedule, averaging out the monthly percentages from January 2015 through May 2017. Not surprisingly, the two subway lines with the best terminal on-time performance are the L and the 7, the two lines that have an exclusive right-of-way.
Similar to the results from our analysis of the wait assessment data, the lines with the worst terminal on-time performance are the crowded Lexington Avenue lines (4, 5, and 6) as well as the 2. In general, terminal on-time performance of individual subway lines declined over the period January 2015-May 2017, following the overall pattern. One notable exception is the G line, the only non-shuttle line that does not enter Manhattan.
Terminal On-Time
Performance by Subway Line
Monthly Average, Jaunary
2015-May 2017 |
| Subway Route |
Met Standard |
| L |
91.8% |
| 7 |
81.5% |
| C |
75.9% |
| 1 |
75.1% |
| G |
74.2% |
| B |
72.5% |
| J/Z |
72.1% |
| D |
71.0% |
| Q |
70.9% |
| M |
69.6% |
| E |
69.0% |
| Subway System
Average |
67.3% |
| A |
65.8% |
| N |
65.1% |
| R |
63.5% |
| 3 |
63.0% |
| F |
57.4% |
| 6 |
48.6% |
| 4 |
41.9% |
| 2 |
41.5% |
| 5 |
39.5% |
SOURCE: IBO
analysis of Metropolitan Transportation Authority data
NOTE: Monthly values are 12-month rolling
averages observed 29 times (from January 2015 through May 2017).
New York City Independent Budget Office |
Numbers and Causes of Delays. NYC Transit also provides the total number of subway delays in its monthly reports of subway and bus operations. A delayed train is defined as one that fails to meet the terminal on-time criterion described above. The average monthly number of delays has increased dramatically in recent years, from numbers typically in the low-20,000s in early 2012, to 67,452 in May 2017.
Each train that arrives more than five minutes late to its terminal is assigned a reason for the delay. While individual trains may be delayed for multiple reasons, the MTA assigns just one cause for each delay. The category “overcrowding” is typically the greatest source of delays. Overcrowding results in delays because it takes longer for passengers to exit overcrowded cars and for boarding passengers to squeeze onto the train. The conductor often has to close and open the doors several times before all doors are fully closed. All of this extends the time a train is in the station, often longer than the scheduled dwell time, resulting in delays. While the MTA does not provide information on the average length of delays by type, it is likely that delays due to overcrowding are generally relatively short, compared with delays related to track, signal, or equipment malfunctions.
Delays due to overcrowding have grown dramatically over time, and since March 2014, overcrowding has been the top reported cause of subway delay every single month. In January 2012, NYC Transit reported 4,222 weekday delays reaching the terminal due to overcrowding, about 19 percent of the 22,240 total weekday delays. In March 2014, 9,391 weekday delays due to overcrowding were reported, 22.2 percent of the 42,392 total. By May 2017 total weekday delays had ballooned to 67,452, with 26,990 (40 percent) due to overcrowding.
The MTA does not have separate categories for signal problems or rail conditions. These are included under “Right of Way Delays,” which typically vie with “Track Gangs” (work teams doing scheduled or unscheduled repairs) as the second most-frequent cause of delays after overcrowding. Right of way delays include signal and rail conditions that slow down trains. From January 2012 through May 2017 overcrowding, right of way delays, and track gangs were consistently listed as the top three causes of delay. The only exceptions were January 2014 and February 2015, when inclement weather overtook track gangs for third-place. Other less important, but still noteworthy causes of delays include the presence of work equipment or car equipment on the track and sick customers.
The more than five-fold increase in the number of delays the MTA attributes to overcrowding in recent years far outpaces increases in ridership. Average weekday subway ridership increased a total of only about 5.1 percent from 2012 through 2016. Average daily ridership in May 2017, the endpoint for this study, was 8.5 percent higher than the average for 2012.4 These increases are modest compared with the annual growth in total ridership of 6 percent to 7 percent in the years following the introduction of unlimited-ride MetroCards in 1998, and of 2 percent to 4 percent during the period 2004 through 2008. It is a well-established result, however, that transportation networks can function reasonably well with a certain amount of congestion, but as congestion (crowding in the case of subways) increases, there comes a point at which there is an abrupt jump in delays.
The Role of the Subway Fleet Age in Delays. There is a general expectation that as subway cars age, they are prone to more-frequent breakdowns.5 The chart below indicates the mean distance between failure (MDBF) for the five subway car models with the greatest number of vehicles in NYC Transit’s fleet for calendar years 2010, 2012, 2014, and 2016, as well as the 12 months ending in May 2017. These data are from the monthly reports of the MTA’s Transit and Bus Committee, available on the MTA website.
From oldest to newest, the models in the chart are the R46 (752 cars; around 40 years old in 2017), the R62A (824 cars; around 32 years old), the R68 (425 cars; around 30 years old), the R142 (1,030 cars; around 16 years old), and the R160 (1,662 cars; around 10 years old). As of May 2017, these five models made up just over 73 percent of the total subway fleet. Just over 40 percent of the total cars in the fleet (including the R46, R62A, and R68) were at least 30 years old.6
While the mean distance between failures has declined for all five of the subway car models in the above chart, the decline is most dramatic for the R160 cars, which were built by Kawasaki and Alstom from 2005 through 2010. These cars are still the best-performing of the five models featured in the chart, but their MDBF has declined by more than 50 percent since 2012.
Quantifying Hours Lost to Delays for Individual Subway Lines
Using data for the subway system as a whole, it is clear that on-time performance has declined.
- Gaps in service have been increasing.
- Fewer trains are arriving at their terminal on time.
- The number of delays is increasing, with overcrowding as the most frequently reported cause.
- Subway car breakdowns vary considerably by model, with older cars generally more susceptible to breakdowns than newer models.
In order to estimate the number of hours that riders lose during the morning commute on an average weekday, we now shift focus from systemwide delays to delays on specific subway lines during the morning commute. The estimated total time lost due to delays can be interpreted as the time lost on a typical weekday in which the subway experiences a routine number of delays due to causes such as switching problems, overcrowding, sick passengers, and trains with mechanical difficulties. There will be events such as power outages and derailments that cause more severe systemwide delays, as well as days on which the system runs very smoothly and the total time lost to delays is less than the average we have estimated.
As described above, the MTA has three main measures of delay by line: wait assessment, terminal on-time performance and the number of terminal delays. Because terminal on-time performance and number of terminal delays give no information regarding the magnitude of the delay, they cannot be used to quantify the amount of time that passengers lose when trains are late. Of the measures used by the MTA to assess delays, only wait assessment allows us to estimate the total length of delay experienced by passengers on individual lines.
For each subway line, the MTA indicates the share of trains subject to minor, medium, and major gaps in service. IBO assigns an average value in minutes for the three types of gaps, based on the scheduled headway for each line during the morning peak travel period of 7-10 a.m.7 The number of passenger-hours of delay for an individual subway line during a typical morning rush requires summing values for minor, medium, and major delays. The number of passenger hours lost due to minor delays is calculated as:
(share of trains subject to minor delay) x (the total number of passengers traveling on that line) x (average delay in minutes for each train subject to minor delays)
The same procedure is used to calculate medium and major delays for each individual subway line. Total delay in passenger-hours is the sum of minor, medium, and major delays.
Passenger Counts. The MTA releases limited data on the number of passengers riding individual subway lines. The most extensive sources of information on subway ridership are cordon counts, an estimate of subway passengers entering Manhattan below 60th Street on a given day, made by actually counting (or attempting to count) the number of passengers on each train entering the area. The most recent cordon counts were conducted on a weekday in October 2015. These data, however, are limited to subway lines and passengers that travel into the central business district. In order to get a fuller picture of subway ridership, IBO augmented these data with the number of entries into the subway system, as calculated by MetroCard swipes. Neither measure can give a precise measurement of ridership on individual subway lines, but IBO has combined the data from these sources to produce an estimate of the ridership during the morning peak period (7 a.m. to 10 a.m.) on a typical weekday in October 2015. Because there is no reasonable way to account for transfers between lines once riders are inside the subway system, IBO assigned each passenger to a single subway line based on the rider’s initial point of entrance.
IBO estimates that there were just over 1.5 million subway trips in a typical morning peak in 2015, distributed between 20 subway lines. (The J and Z lines are combined in this analysis, and the three shuttle lines—Grand Central-Times Square, Franklin Avenue, and Rockaway—are not included.) Overall weekday subway ridership has increased modestly over the past several years. In response, IBO has adjusted estimated passenger totals for the morning peak in other years to reflect variations from the 2015 total. Hourly ridership is assumed constant throughout the morning peak, and delays relative to scheduled headways are assumed to follow the same pattern as reported for the entire 6 a.m.-midnight period in the wait assessment data.
Estimating the Duration of Delays. To estimate the average headway between trains during a typical rush-hour morning commute, IBO mainly relied on the cordon counts, which contain data on the number of trains entering Manhattan below 60th Street at various entry points from 7 a.m. to 10 a.m. These data were supplemented when necessary by archived MTA train schedules. We then used the average headway for each subway line to estimate the length of delays for each of the three wait assessment categories: minor, medium, and major delays.
In the absence of more detailed information on the arrival of trains and passengers at subway stations, IBO has assumed that passengers subject to minor gap delays wait for their train an additional 37.5 percent (halfway between 25 percent and 50 percent) of the scheduled time between trains. Passengers experiencing medium gaps in service wait on average an additional 75 percent which is halfway between the 50 percent to 100 percent increase over scheduled headway that defines a medium delay). Finally, passengers subject to major gaps wait an additional average of 150 percent of the scheduled headway. While the definition of major gap is open-ended (anything more than 100 percent of the scheduled headway), we have assumed that on average a major delay is in fact 150 percent of the scheduled headway.
As an example of the duration of delays under IBO’s assumptions, suppose a scheduled headway of eight minutes. A minor gap would add between two minutes and four minutes to this headway, giving an average delay of three minutes. Note that this methodology is a simplification that only considers the impact on the passengers who would normally have taken the train that is delayed. In reality, when a particular train is delayed, some passengers arriving randomly at the station may benefit from shorter than expected headways by taking a train that is arriving later than scheduled, but before the next scheduled train. On the other hand, late trains in rush hour may be so full that not all passengers waiting at a particular station can board, delaying them until a less crowded train arrives.
Continuing with our example, a medium gap in service with a scheduled headway of eight minutes would add between four minutes and eight minutes, or an average of six minutes to the wait time. Finally, based on our assumption that a major delay would increase the time between trains by 1.5 times the scheduled headway, a major gap would add 12 minutes of delay.
Time Lost to Subway Delays Has Increased. The results of IBO’s analysis confirm what recent media reports and anecdotal accounts by riders suggest: the impact on riders of subway delays has been increasing over time. The number of passenger-hours of delay during the morning rush on a typical weekday grew to roughly 34,900 in May 2017, up 45.3 percent from the average of about 24,023 hours for the year 2012. In part these delays are due to an increase in ridership. IBO estimates that morning peak ridership on the subway was 8.5 percent higher in May 2017 than the average for all of 2012. The increase in passenger-hours of delay is far greater than the increase in ridership over the period. There was an increase in passenger-hours of delay on all lines, ranging from a low of 24.7 percent on the 3 line, to a high of 71.4 percent on the J/Z line. The lines with greatest number of passenger-hours of delay have consistently been the A, F, 4, and 5.
Estimate of Passenger
Hours of Delay by Subway Line
Morning Rush Hour During a
Typical Weekday |
| |
Hours of Delay in the Morning Rush |
Increase From 2012
Through May 2071 |
| 2012 |
2013 |
2014 |
2015 |
2016 |
January
2017 |
February
2017 |
March
2017 |
April
2017 |
May
2017 |
| 1 |
773 |
858 |
1,050 |
1,106 |
1,161 |
1,106 |
1,168 |
1,168 |
1,172 |
1,218 |
57.5% |
| 2 |
1,493 |
1,600 |
1,827 |
1,807 |
2,033 |
1,975 |
2,041 |
2,105 |
2,128 |
2,234 |
49.6% |
| 3 |
1,389 |
1,224 |
1,327 |
1,308 |
1,565 |
1,524 |
1,588 |
1,637 |
1.661 |
1,732 |
24.7% |
| 4 |
1,867 |
1,734 |
2,038 |
2,127 |
2,279 |
2,198 |
2,234 |
2,300 |
2,330 |
2,439 |
30.6% |
| 5 |
2,040 |
1,964 |
2,349 |
2,463 |
2,580 |
2,495 |
2,569 |
2,666 |
2,703 |
2,809 |
37.7% |
| 6 |
1,429 |
1,263 |
1,880 |
1,993 |
2,037 |
1,936 |
1,959 |
2,007 |
2,009 |
2,078 |
45.4% |
| 7 |
696 |
735 |
1,041 |
1,010 |
1,031 |
977 |
1,009 |
1,045 |
1,080 |
1,125 |
61.6% |
| A |
2,011 |
1,890 |
2,665 |
2,915 |
2,469 |
2,404 |
2,485 |
2,593 |
2,653 |
2,775 |
38.0% |
| B |
1,017 |
1,075 |
1,274 |
1,335 |
1,268 |
1,228 |
1,477 |
1,530 |
1,548 |
1,633 |
60.7% |
| C |
918 |
733 |
1,059 |
1,224 |
1,305 |
1,273 |
1,408 |
1,429 |
1,462 |
1,548 |
68.6% |
| D |
1,355 |
1,214 |
1,325 |
1,607 |
1,292 |
1,288 |
1,565 |
1,635 |
1,705 |
1,833 |
35.3% |
| E |
1,214 |
1,259 |
1,566 |
1,507 |
1,730 |
1,673 |
1,622 |
1,672 |
1,705 |
1,816 |
49.6% |
| F |
1,708 |
1,728 |
2,621 |
2,310 |
1,965 |
1,829 |
2,257 |
2,323 |
2,373 |
2,524 |
47.8% |
| G |
218 |
252 |
305 |
290 |
230 |
220 |
254 |
257 |
261 |
274 |
25.9% |
| J/Z |
560 |
638 |
694 |
954 |
808 |
794 |
884 |
909 |
934 |
960 |
71.4% |
| L |
822 |
767 |
917 |
1,137 |
1,204 |
1,105 |
1,134 |
1,135 |
1,137 |
1,172 |
42.6% |
| M |
1,170 |
1,125 |
1,372 |
1,537 |
1,363 |
1,310 |
1,610 |
1,647 |
1,709 |
1,799 |
53.7% |
| N |
1,223 |
1,196 |
1,355 |
1,489 |
1,680 |
1,472 |
1,538 |
1,622 |
1,693 |
1,787 |
46.1% |
| Q |
1,095 |
1,142 |
1,361 |
1,409 |
1,407 |
1,336 |
1,527 |
1,594 |
1,637 |
1,715 |
56.7% |
| R |
1,204 |
830 |
976 |
1,526 |
1,352 |
1,276 |
1,317 |
1,347 |
1,378 |
1,431 |
39.7% |
| TOTAL |
24,023 |
23,227 |
28,982 |
31,054 |
30,757 |
29,420 |
31,648 |
32,620 |
33,278 |
34,900 |
45.5% |
SOURCES: IBO calculations using
data from the Metropolitan Transportation Authority and the Hub
Travel Survey
NOTE: Figures for 2012 through 2016 show |
Subway Ridership and the Cost of Delays
Ridership on the New York City subway far exceeds that of any other rail transit system in the United States, and is the seventh-highest of any subway system in the world. Total ridership on the city’s subway was around 1.76 billion in both 2015 and 2016, the highest levels since the years immediately following World War II. Average weekday ridership in 2016 was around 5.66 million.
IBO used the U.S. Census Bureau’s American Community Survey (ACS) to determine the primary commuting mode for people traveling to work in New York City. Using the ACS sample data for the period 2011-2015, we estimate that 1.66 million employed city residents use the subway as their primary commuting mode. This is equivalent to about 43 percent of all city residents who work in the five boroughs, again based on the ACS.8 Assuming that each resident subway commuter travels to and from work by subway on a typical weekday, this gives a total of 1.66 x 2 = 3.32 million daily work trips on the subway by city residents, roughly equivalent to 59 percent of total weekday subway ridership. In addition to this total there are city residents for whom the subway is a secondary commuting mode, and suburban residents who enter the city for work by commuter rail or bus, and then transfer to the subway.9 All of this suggests that well over 59 percent of weekday subway ridership is work-related. While subway delays are an inconvenience no matter the purpose of the trip, they are especially burdensome for individuals traveling to work.
Among city residents, the mean income of subway commuters was practically identical to that of nonsubway commuters over the 2011- 2015 period ($58,329 vs. $57,932), while the median income was about 4.3 percent higher for subway users ($38,958 compared with $37,335). Subway commuters were more likely than other commuters (74 percent vs. 63 percent) to work in the private, for-profit sector of the economy. They were considerably less likely (7 percent vs. 11 percent) to work in local government.10
Consequences. With an increase in the number of delays and in the total hours lost to delays by commuters each day, it follows that the economic cost of delays has also grown. But assessing the magnitude of these costs and their significance is a particularly challenging exercise. With about 1.5 million riders during the morning rush, the time lost to delays quickly adds up to a large number, but the New York City economy is also very large, so that even large increases in the time lost to delays appear relatively small in terms of the overall economy.
When subway commuters are delayed they cannot start their work day at the scheduled time, costing the economy the value of at least some of that work time. We can begin to value the time lost by considering the hourly pay of commuters. According to the Census Bureau’s 2015 ACS five-year file, average annual earnings for city residents who use the subway as their primary means of getting to work was $58,329, or $34.72 per hour, assuming 240 days worked and 7 hours per day.11
Data from the ACS indicate that around two-thirds of city residents who have the subway as their primary commuting mode make their trip to work during the morning peak of 7-10 a.m. This is equivalent to 1.08 million individuals, or 71.3 percent, of total subway ridership during the morning peak. In addition, there are city commuters for whom the subway is a secondary travel mode, and commuters from outside the city who transfer to the subway from commuter trains and buses. We do not have precise data on the size of these groups of subway commuters. However, travel survey data from 2015 indicate that on a typical fall day 131,000 people came into the Manhattan hub by bus and 197,000 by commuter rail during the morning peak. Most bus commuters come from outside the city, although a sizeable share—IBO estimates around one-fourth—come from within the five boroughs. Commuter rail passengers come overwhelmingly from outside the city.
Frequently city residents who take buses to Manhattan do so in part to avoid transfers to the subway. Many bus riders from the suburbs, on the other hand, do have to transfer once they arrive at the Manhattan terminal. Although many commuter rail passengers can walk to their workplace from their terminal, others must transfer to the subway. IBO has assumed that half of passengers arriving in Manhattan by bus or commuter rail during the morning peak are commuters who transfer to the subway. Furthermore, we make the simplifying assumption that all of these commuters live outside the city. The result is an addition of 164,000 nonresident subway commuters during the morning rush, giving a revised total of 1.24 million commuters.12 Suburban commuters generally have higher incomes than city residents who commute. From ACS data, IBO has calculated an hourly wage of $68.08 for nonresident commuters.13
As noted above, IBO estimates that 34,900 passenger-hours are lost due to subway delays during the morning rush hour on an average work day. Of this total, 24,874 hours (71.3 percent) correspond to city residents who are traveling to work, and 3,775 hours (10.8 percent) to nonresidents who are traveling to work. IBO assumes that the remaining 6,251 hours (17.9 percent) correspond to individuals who are making nonwork trips—mostly residents, but some visitors as well. We use the average hourly wage data to value commuters’ time ($34.72 per hour for residents and $68.08 per hour for nonresidents). Economists differ on how much value to ascribe to nonwork time, but one common approach, and the one used for noncommuters above, is to assume that workers value an hour of leisure at roughly half what they could earn by working that hour instead. Applying this standard we value noncommuters’ time at half the resident wage ($17.36 per hour).
The resulting value of the time lost each morning rush hour due to delays is $864,000 for city commuters, $257,000 for noncity commuters, and $109,000 for subway riders making nonwork trips, for a total daily cost of $1.23 million. Multiplying this figure by 250 nonholiday weekdays in a year gives a total annual cost of delays of $307 million for delays during the 7 a.m. to 10 a.m. morning rush: $216 million for city resident commuters, $64 million for nonresident commuters, and $27 million for people not traveling to work. Given the trends of the past several years, the amount and therefore the cost of delays are likely to increase in the future.
While a $307 million annual cost of delays is a large amount, it is actually dwarfed by the size of the local economy. Total personal income for city residents, which includes other types of income along with wages and salaries, is $540 billion—nearly 1,800 times greater. And gross city product, a measure of the value of goods and services produced within the city, is even larger, $910 billion.14
Moreover, IBO’s estimate of $307 million lost each year overstates the value of the time lost to businesses and offices in the city. The $27 million cost of delays in nonwork trips (including trips from work to home) primarily represents foregone nonwork or leisure time, not a reduction in the output of the economy. In addition, while some firms and offices depend on groups working on a tight schedule that can be disrupted if employees arrive late, such work organization accounts for a much smaller share of city output than it once did. In offices with greater flexibility in organizing and scheduling the day’s work, employees who are late due to subway delays may, for example, simply stay later to finish the day’s tasks or bring work home. This means that at least some of the $280 million commuter-related loss is not at the expense of firms’ output.15
It is likely that much of the cost of the time lost to subway delays actually falls on the commuters rather than their employers. This happens in two ways. As previously noted, in many offices, workers may just stay later, in order to make up the time lost in the morning. As long as the necessary work is completed, the employer has lost little, if anything. But employees have given up some of their nonwork time, usually without compensation. The second way that the cost is shifted to commuters is when delays become so frequent that people routinely leave for work earlier in the morning in order to increase their chances of arriving on time. This also consumes some of commuters’ nonwork time, including leisure time. While this extra commuting time has value to the individuals giving up their time, it does not extract a cost from employers or curtail economic output.16
If all delays incurred by commuters resulted in an equivalent loss of nonwork time instead of work time, workers who are city residents would be giving up time worth $108 million per year, and nonresident commuters would be losing leisure time worth $32 million, for a total loss of $140 million per year.
Conclusion
Data from the MTA confirm what many commuters already feel: subway performance has declined in recent years, with more frequent gaps in service and fewer trains arriving at their terminals on time. Train overcrowding is the most common cause of delays and has been growing over time. IBO estimates that there were 34,900 passenger hours of delay during the morning rush on a typical weekday in May of this year, a 45.3 percent increase since 2012. Using census data on the average income of subway commuters, IBO calculated this lost time is worth as much as $280 million a year. While this is a substantial number, it is around one-thirtieth of 1 percent of the city’s annual gross domestic product. It is also likely that this is not a total loss to their employers’ output as many workers may be able to adjust their schedules to make up for lost time due to interruptions in subway service. In that case, much of the cost of the time lost may actually fall on commuters, in the form of reduced time for nonwork activities, rather than on their employers. Notwithstanding how this loss in time is valued, it is clear that subway delays are a growing burden on New York City commuters and a disruption to their employers.
Report prepared by Alan Treffeisen
ENDNOTES
1The wait assessment data are published monthly by the MTA in 12-month rolling averages. IBO used the annual rolling average (from January through December) for each completed year in our analysis. For 2017, we have provided the 12-month rolling average for each month that is available. The last month in the series is May 2017, which is a rolling average for the period June 2016-May 2017.
2The MTA defines longer than scheduled waits for trains as a wait assessment failure and a delay as a scheduled train trip that is cancelled or reaches the arrival terminal more than five minute late. IBO uses the word delay to for both the wait assessment measure and the terminal arrival measure.
3Fessender, Ford, et.al. “New York’s subways are not just delayed. Some trains don’t run at all.” The New York Times, August 7, 2017. Accessed August 7, 2017.
4Ridership subsequently declined in June and July 2017.
5While newer cars generally perform better than older ones, NYC Transit has found that some newer model cars initially travel fewer miles between breakdowns than older vehicles. In some cases this is due to manufacturing defects that are subsequently corrected, eventually leading to improved performance Rivoli, Dan. “Newer MTA trains taking a beating, performance even lagging behind older cars.” New York Daily News, May 22, 2017. Accessed July 5, 2017.
6Individual subway models are typically produced for a period of several years. The ages reported here represent an approximate average age for the cars of a particular model.
7While the MTA’s numbers are calculated for the period 6 a.m. to midnight, IBO’s analysis is restricted to the morning rush period of 7 a.m. to 10 a.m., when most trips are for work or school, and the destination of most passengers is Manhattan’s central business district.
8Around 27 percent of city residents with work income reported commuting by automobile, truck, or van, 11 percent by bus, and 10 percent by walking. An additional 4 percent worked from home. We include the 4 percent in the category “nonsubway commuters,” even though strictly speaking these workers are not commuters.
9Students commuting to school are another large component of the morning rush ridership.
10While it is true that some city workers need access to a vehicle to carry out their duties, certain categories of city employees (particularly police, fire, and education staff) have traditionally had greater access to free parking than many private sector workers, and hence less reason to use the subway to commute.
11While individual workers are assumed to work 240 days per year, annual delays are based on 250 work days. It is assumed that workers’ vacation and sick days are spread out over the year, and are accounted for in calculations of average daily ridership.
12This calculation leaves out some small number of commuters for whom the subway is a secondary mode. The 17.9 percent of subway riders in the morning peak who are not classified as commuters are overwhelmingly making nonwork trips, including school, shopping, and medical appointments. Our calculations assume that all subway commuters are affected equally by delays, when in fact commuters who make longer trips face longer expected delays on average.
13The mean income for suburban commuters is pushed up by a relatively small number of very high-income workers.
14IBO estimates based on data from Moody’s Inc.
15In 1980 researchers at the Federal Reserve Bank of New York examined similar questions about the impact of subway delays at a time when performance was also falling, “The Economic Costs of Subway Deterioration,” Federal Reserve Bank of New York Quarterly Review, Spring 1981. They generally found greater impacts than we do. One notable reason is that as bad as subway performance has been in recent months, it is still far about the abysmal levels observed in the 1979-1981 period, which was the nadir of service. Mean distance between mechanical failures fell to under 10,000 miles in 1980, whereas, the system today averages 133,209 miles. Methodological differences presumably account for the remaining difference in estimated cost. Notably, the Fed researchers assume that all riders experienced a five minute increase in commute time each day, although our analysis suggests that is too high, with delays on a typical day affecting a smaller share of riders.
16However, if delays were to become so burdensome that workers demanded higher wages to compensate for their frustrating commutes, those costs would largely fall on employers.
PDF version available
here.
Receive
notification of free reports by e-mail
Facebook
Twitter
RSS