August 2017
Ten Years Aftert:
Assessing Progress on the City’s Solid Waste Management Plan
PDF version available here.
Summary
In 2006 the city adopted its current Solid Waste Management Plan, a 20-year strategy for how New York would deal with the roughly 12,000 tons of waste handled daily by the Department of Sanitation. The plan lays out the city’s approach for reducing and disposing of its solid waste with three overarching themes: equitably distributing sanitation infrastructure, minimizing environmental effects, and keeping costs manageable.
With the city halfway through the period covered by the plan, IBO has looked at the progress made on meeting the plan’s goals as well as pitfalls encountered along the way. Among our key findings:
- The plan anticipated that the tonnage of solid waste would grow over the 20-year period. In fact, tonnage has decreased for a variety of reasons outside the city’s control. While the decline in waste tonnage has led to a reduction in truck miles for disposing of the waste and an overall drop in costs, it has also constrained the sanitation department’s ability to divert more recyclables from the refuse stream.
- While the city’s diversion rate (the share of materials diverted from the waste stream to recycling) has declined, largely due to the declining share of paper and metals in the waste stream, the city’s capture rate (the share of recyclable material that is ultimately recycled) has improved.
- The sanitation department has implemented rail-based transport for disposing of the waste it collects and entered into long-term contracts to guarantee landfill space and maintain cost certainty, but it is not clear this has actually saved the city money.
- The construction of marine transfer stations in Queens, Brooklyn, and Manhattan to ship waste collected in the city for disposal elsewhere is behind schedule. But when all of them are open it will improve geographic equity in the distribution of sanitation infrastructure and will contribute to reducing truck miles associated with waste export within the city.
- In the years since the implementation of the Solid Waste Management Plan, the de Blasio Administration set a goal of “zero waste” by 2030. If the city were to achieve such a dramatic reduction in the amount of refuse it exports by 2030, then much of the infrastructure built to facilitate the Solid Waste Management Plan could need to be retooled for recycling and organics export—or risk becoming obsolete.
During the final 10 years of the plan, further adjustments will be required to continue making progress on efficiency, equity, and environmental goals, particularly as the size and composition of the city’s waste stream continues to evolve and less waste is sent to landfills.
Introduction
New York City’s Department of Sanitation (DSNY) handles around 12,000 tons of waste per day, about 50 percent of the city’s total waste. It disposes of residential and institutional waste, while commercial waste is handled through private carters. It may not be readily apparent to the casual observer as the city’s sanitation trucks continue their usual circuits, but New York City’s waste management system is in the midst of a major overhaul, as the city’s truck-based waste export system transitions to a system that relies more heavily on barges and rail, helping to fulfill a variety of environmental and equity goals for the city. The guiding document behind this transition is the Solid Waste Management Plan (SWMP). The city adopted the SWMP in 2006 to establish a sustainable waste management system for the next 20 years. Now, 10 years after its adoption, IBO takes stock of the city’s progress so far in achieving its goals.
For decades, New York City primarily disposed of the city’s refuse at Fresh Kills landfill in Staten Island, creating what was once the world’s largest landfill. Plans by the city to close the site were first announced in the late 1960s, but Fresh Kills did not receive its last barge of refuse until 2001. The landfill was replaced by an interim waste export program where private haulers trucked the city’s garbage to landfills or waste-to-energy plants in other states. The interim system successfully diverted the city’s refuse away from Staten Island, but was criticized as inequitable, expensive, and environmentally unsustainable. A few communities shouldered a disproportionate share of the city’s waste infrastructure and truck traffic, worsening congestion and air quality. Meanwhile, the contracts used to pay private haulers to move waste to nearby landfills were fiscally uncertain in the long run as these sites were at risk of filling up or deciding to no longer accept New York City waste. The SWMP was intended to respond to these challenges.
The city is required to adopt a Solid Waste Management Plan for at least a 10-year period under New York State Environmental Conservation Law. The current plan, which is in effect through October 2025, is divided into three major areas of sanitation operations: waste prevention, waste export, and commercial waste. Each section is devoted to addressing the three overarching themes of the plan: equitably distributing sanitation infrastructure, minimizing environmental impacts, and setting a manageable economic trajectory for the future. In this report, IBO examines the city’s progress in meeting several key goals included in the SWMP’s many initiatives. We limit our analysis to DSNY operations, including waste prevention and waste export, but excluding commercial waste. Specifically we examine progress on the SWMP goals to: 1) improve the city’s recycling diversion rate; 2) enter into long-term waste export contracts; and 3) reduce impacts on overburdened neighborhoods by shifting from a truck-based system to a citywide multimodal system of waste export, largely through the construction of marine transfer stations (MTSs). We also examine how the city’s waste stream has changed since adoption of the SWMP and how this has affected the plan’s goals.
Overview of DSNY Waste Disposal. Currently there are three major streams of waste eligible for curbside pickup by DSNY: refuse; metals, glass, and plastic (MGP); and paper. The refuse stream includes all nonrecyclable material, while the MGP and paper streams handle recyclables. Expanding acceptance of a wider array of material into the recycling stream was one of the goals of the SWMP. Accordingly, since 2012 DSNY has accepted a new class of rigid plastics for recycling, which includes single use plastic dishware, plastic appliances, and rigid containers. Refuse is picked up via single bin trucks while the recycling streams are collected using either single bin trucks or dual bin trucks that can collect the two different recycling streams in separate compartments. (IBO previously investigated the efficiency differences between these two collection truck options in a 2012 report.)
Refuse is moved by DSNY trucks to transfer stations that are run by private entities under contracts with the city. These transfer stations, or “tip points,” are located variously within city limits, on Long Island, in Westchester County, and in New Jersey. From these transfer stations, the private contractors move the majority of DSNY refuse to landfills throughout the eastern United States via rail, while about 23 percent of the city’s refuse goes to waste-to-energy facilities largely in New Jersey. Recycling is trucked by DSNY to separate MGP and paper processors, located within the city limits or in Jersey City, which sort each load and sell the resulting scrap material on recycled commodities markets. The size and composition of the waste stream managed by DSNY is an important factor that helps explain why the city has met some goals outlined in the SWMP and not others.
Less Waste Than SWMP Projected
A key assumption underpinning the SWMP was that the city’s waste production would increase as the city’s population grew over the 20-year plan period. The SWMP projected that the curbside and containerized waste handled by DSNY, including both refuse and recycling, would grow from an average of 13,456 tons per day in 2007 to 14,622 tons per day in 2015 and finally to 16,339 tons per day at the end of the SWMP period in 2026. (All years refer to fiscal years unless otherwise specified). Despite the city’s rising population, New York’s refuse and recycling tonnage have both declined since the SWMP was adopted. This mirrors shifts that are happening across the country as packaging gets lighter, consumption habits change, and paper use is reduced. In contrast to the SWMP projections, in 2015 DSNY collected, on average, 11,817 curbside and containerized tons per day—19 percent less than what was projected in the SWMP for that year and 11 percent less than the tonnage collected when the plan was adopted in 2006.1 While total curbside and containerized waste has rebounded slightly to 12,246 tons per day in 2016, tonnage is still well below its projected growth. If these environmentally favorable trends continue through the end of the SWMP period in 2026, the gap between projections and actual waste generation could grow even larger, prompting revisions to New York’s waste management strategy and planned infrastructure.
Recyclable & Refuse: Projections vs. Reality. The gap between the actual tonnage collected over the past decade and what was projected in the SWMP is primarily attributable to a waste stream composition that had lower-than-expected recycling tonnage. In 2016 the city collected an average of 2,010 tons per day in the curbside/containerized recycling stream. This is only about half of what the SWMP projected for 2016, according to its growth model. Overall, the recycling tonnage collected by DSNY fell by an average of 3 percent each year from 2006 through 2013 when it hit a low of 1,770 tons per day. Over the past three years, however, recycling collections have increased, with the most rapid growth occurring in 2016, when recycling collections rose by 8 percent. Despite this more recent growth, recycling collections are still 5 percent below the average 2,122 tons per day they were when the SWMP was adopted in 2006.
In terms of the curbside/containerized refuse stream, in 2006 DSNY collected on average 11,131 tons per day. This declined by 8 percent over the past 11 years to an average of 10,236 tons per day in 2016, about 2 percent less than the projections used in the SWMP. Similar to recycling, refuse tonnage largely fell every year since the SWMP was adopted until 2016, with the decline averaging 1 percent per year. Like the recycling tonnage, refuse collections reversed course in 2016, rising 3 percent compared with 2015.
IBO used the sanitation department’s two most recent residential waste characterization studies to obtain more detail on how the city’s waste stream has changed since the SWMP was adopted. The first waste characterization study was completed in 2005, a year prior to the SWMP’s adoption and the most recent was completed in 2013. While the collection totals provided above measure the amount of waste that is collected in the recycling and refuse streams, the waste characterization studies provide details on what is actually contained in each stream.
According to these studies, the tonnage of recyclable material in the city’s waste declined by 17 percent in 2013 compared with 2005; nonrecyclable waste declined by 6 percent, after accounting for the expansion of recycling to materials that were previously counted as refuse, such as rigid (RR2) plastics. Despite effectively reclassifying some refuse as recycling, the share of recyclable material in the waste stream has plummeted. If the categories of materials eligible for recycling had not been expanded, recyclable tonnage would have declined by 27 percent while refuse would have only declined by 1 percent. Therefore, nearly the entire decline in refuse tonnage is due to DSNY’s expanded acceptance of recyclable material and not due to a decline in nonrecyclable waste.
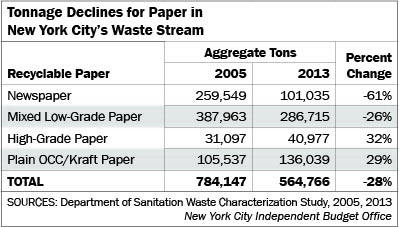
Among categories of recyclable materials, the greatest rate of tonnage decline is from metals, which fell by 44 percent, from 195,201 tons in 2005 to 109,288 tons in 2013. However, in absolute terms the biggest decline is from paper, as it makes up a much larger share of the waste stream. The total tonnage of paper in the waste stream fell from 784,147 tons in 2005 to 564,766 tons in 2013. In particular, two categories of paper, newspaper and mixed low-grade paper (junk mail, phone books, and magazines), account for most of the decline in recyclable material. Tonnage of newspaper in the city’s waste stream fell by 61 percent and mixed low grade paper declined by 26 percent.
In recent years the aggregate tonnage of other types of paper—including high grade paper and Plain OCC/Kraft Paper (cardboard boxes)—has increased, but not by enough to offset the steep decline in newspaper. These numbers are broadly consistent with national trends of declining physical newspaper readership and increased online commerce, resulting in more packaging paper and less newspaper and physical mail. This “missing newspaper” in the waste stream is the major driver of the decline in the tonnage of recyclable material and of the total waste stream.
Recycling Diversion Rate Below SWMP Projections
The greater relative decline in recyclable material in the city’s waste stream is important because it impacts the city’s diversion rate, which is the percentage of the total waste stream that is processed for recycling and how the city set its target for recycling in the SWMP. A diversion rate is a common gauge of recycling progress, although it can be misleading as a measure of recycling effectiveness when the underlying waste composition is changing—as is occurring now in New York City. Using its waste growth projections, the SWMP set aggressive recycling targets. It projected that the city’s curbside and containerized diversion rate would grow from 17 percent in 2005 to 25 percent in 2007, 28 percent in 2015, and finally reach 35 percent in 2026. Given the sharp decline in recyclable material in the waste stream, however, DSNY is not close to reaching any of these goals, nor are they on track to do so in the future as efforts to date have barely been able to keep the diversion rate steady in the face of the unfavorable and unforeseen trends in the composition of the city’s waste.
New York’s voluntary recycling program started in 1986 and became mandatory in 1989. As recycling gained popularity, the diversion rate rose, reaching 20 percent in 2002. In 2003, however, then-Mayor Michael Bloomberg canceled the glass and plastics portion of the program as part of citywide budget cuts. With only paper and metal being recycled, the diversion rate plunged to 11 percent. City Council legislation adopted over the next two years restored the program, made recycling mandatory, and set flat, tonnage-based goals for the city’s recycling program. The diversion rate recovered, but never to the levels achieved in the late 1990s and early 2000s.
The SWMP, issued in 2006, sought to restore the diversion rate to its 2002 level by emphasizing recycling programs and setting what it characterized as “ambitious but realistic” diversion targets. The SWMP also included the recommendation that the city amend the 2004 legislation to set percentage-based—as opposed to tonnage based—recycling goals patterned on those outlined in the SWMP. In 2010 the New York City Council passed Local Law 40 that instituted a number of changes to the city’s recycling program, including a return to measuring the city’s recycling goals using diversion rates. The Council set recycling goals at levels lower than were projected in the SWMP: 16 percent of curbside/containerized waste by 2011, rising to 33 percent by 2020.
Diversion rates have failed to increase in line with city goals, both those stated in the SWMP and later set by the City Council. In 2016 the actual diversion rate for curbside and containerized waste was 16 percent, trailing the SWMP projection by about 12 percentage points and the Local Law 40 goal for 2016 by about 5 percentage points. In fact, the diversion rate actually declined slightly from 2006 through 2013, going from 16 percent to just under 15 percent before bouncing back up to 16 percent after RR2 plastics acceptance was introduced.
Overall, the SWMP expected a much greater share of the waste stream would be processed for recycling. Actions such as expanding plastics recycling and investments in public education in recent years have been insufficient to increase the diversion rate to target levels, although they may have helped arrest a decline in diversion.
Recycling: More Contaminated, Improved Capture Rate
Tonnages and diversion rates do not tell the whole story of how well the city is recycling, only how large the deliveries are to recycling processors and landfills. For example, the diversion rate would increase if households simply threw more refuse into recycling collections. Recycling productivity can also be measured by examining what is inside the deliveries made to processors using contamination and capture rates. The contamination rate measures how much nonrecyclable material, also known as “nondesignated material,” ends up in the city’s recycling collections. Contamination of the recycling stream is problematic for the city because processors must separate nondesignated materials and send them to landfills. Their presence lowers the market value of the city’s recyclables and increases the city’s processing costs. Contamination also distorts the diversion rate, making it appear artificially higher. The second—and perhaps the more precise—measure of recycling productivity is the capture rate, the percentage of a type of recyclable material that is ultimately recycled.
Again using the waste characterization studies, IBO compared contamination and capture rates in 2005 and 2013. The city’s contamination rate has worsened since the SWMP was adopted. For example, in 2005, 5 percent of what was collected in the paper recycling stream was nondesignated material (refuse or MGP). In 2013 that share increased to 7 percent. For the MGP stream, the picture is a bit more complicated. Nondesignated materials have declined from 20 percent in 2005 to 17 percent in 2013. However, because the city began accepting more types of plastic for recycling, this moved these plastics from the “nondesignated” category to the “recyclable” category. If the city accepted as many types of plastic in 2005 as they do today, only 13 percent of the stream would have been nondesignated in 2005 compared with the 17 percent in 2013.
Despite the increase in contamination, the capture rate improved in 2013 versus 2005. This means that while more nondesignated materials are making their way into the recycling stream, an increasing share of recyclables are as well, and a higher percentage of the city’s recyclable material is actually being sent to processors. Because the types of materials accepted for recycling by DSNY changed over this time period, the capture rate can be difficult to directly compare, but counting only materials that were recycled in 2005, the overall capture rate increased from 45 percent to 47 percent, and using the current mix of recycled materials, the capture rate increased from 41 percent to 44 percent.
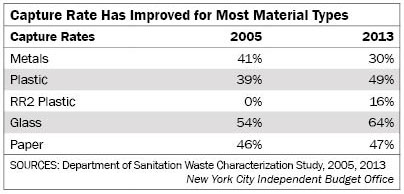
With the exception of metals, every major category of recycling was being captured into the recycling stream at a higher rate in 2013 than in 2005. The capture rate for glass increased from 54 percent in 2005 to 64 percent in 2013. Paper’s capture rate increased only slightly from 46 percent to 47 percent. The capture rate for plastic increased from 39 percent to 49 percent. These figures exclude rigid (RR2) plastic, which was added to the city’s recycling program in 2013—the year of the waste characterization study. Its capture rate, which at 16 percent is the lowest of all material types, would be expected to increase as the public becomes more accustomed to the program. The decline in the metals capture rate, which went from 41 percent in 2005 to 30 percent in 2013, can be explained by high commodity prices encouraging scavenging and increased aluminum can redemption. These activities generally take the materials out of the city’s recycling stream but leave them in the refuse stream, having a negative effect on capture rate, but they still result in the material being recycled privately. As commodity prices decline, scavenging may become less attractive, resulting in more recyclable material entering the DSNY waste stream. Changes in redemption rates would also affect plastic and glass capture, but would be less clear in the data as bottles make up a smaller share of the total in these categories than aluminum cans in the metals category.
Per Ton Cost Differential Between Recycling and Refuse Increases
IBO has found that the cost of collecting and exporting 1 ton of the city’s recycling is more expensive than collecting and exporting 1 ton of the city’s refuse. Learn why here.
Overall, New Yorkers are producing less waste in 2016 than when the SWMP was adopted despite projections that the amount of waste would increase. Capture rate is a better way to measure recycling progress, and by that measure, the city and the public have improved recycling rates since the SWMP was adopted. The decline in waste tonnage over the period is disproportionately recyclable material, thereby depressing the diversion rate even as the capture rate improved. Although the recycling streams have become more contaminated, DSNY and the public continue to get better at capturing what recyclable material remains in the waste stream.
Long-Term Contracts Largely Implemented, Cost-Savings Unclear
One of the most achievable goals of the SWMP was to end the practice of using short-term waste export contracts to handle the city’s refuse and MGP recycling, replacing them with long-term contracts that were expected to provide cost certainty and savings. By their nature, short-term contracts have higher price volatility than long-term contacts. On the refuse side, the city was concerned that as nearby landfill space used by the contractors became scarcer, the price per ton of the short-term contracts would increase sharply. For recycling, the city had already entered into a long-term contract for paper processing before the SWMP and wanted to ensure the MGP program was cost-effective and less vulnerable to budget cuts like those that had previously suspended the program in the early 2000s.
Since 2007 the city has replaced many but not all of its short-term export contracts with long-term ones. Short-term contracts typically provide for moving waste to landfills relatively close to the city using trucks. In contrast, the city’s long-term contracts make greater use of rail and barges to transport waste to landfills that are farther away and guarantee refuse acceptance for the duration of the contract.
Long-term DSNY contracts currently in place include one contract that handles all of the city’s MGP processing and six refuse contracts that handled 62 percent of the city’s refuse in 2016. DSNY has already implemented rail-based transfer stations under long-term contracts in Staten Island, the Bronx, and parts of Brooklyn and Queens. Part of Manhattan is currently served by a truck based long-term contract with a waste-to-energy facility in New Jersey. The short-term refuse contracts that remain are generally smaller or in areas that are transitioning to using long-term contracts via the new marine transfer stations, which use barges to transport waste to rail transfers in Staten Island or Elizabeth, New Jersey. Thus, as more of the marine transfer stations open, IBO expects the share of the city’s refuse exported through long-term contracts to increase.
Refuse Long-Term Contracts More Expensive. Despite expectations that the new refuse export contracts would stabilize costs, since 2007 long-term contract costs have increased, while the cost per ton of short-term refuse contracts have declined. For example, the average cost per ton of refuse exported through long-term contracts in 2016 was $122, compared with an average cost of $87 per ton for short-term contacts. In 2007 long-term contracts cost on average $80 per ton, while short-term contracts cost on average $105 per ton (all costs are in 2016 dollars).
Examining the contracts by borough, none of them have led to a decline from the cost of waste export per ton in effect at the time they were enacted. This pattern has held from when the first contracts were enacted in the Bronx and Staten Island in 2007, to the latest non-MTS linked contract entered into for Queens in 2015. Despite these trends, it is unclear whether long-term contracts have actually been less cost effective. By signing long-term contracts and sending refuse to sites that do not directly compete with local landfills, the city may have contributed to a softening in the demand for nearby landfill space, affecting the local waste disposal market. Landfill space is limited, and if the city attempted to make more extensive use of local sites, it could again boost demand and therefore costs.
As long-term contracts were phased in over the period from 2007 through 2016, DSNY’s total refuse export budget (all amounts in 2016 dollars) slowly increased from $354 million in 2006 to $362 million in 2008, despite a decline in export tonnage. Since 2008 the export budget declined to a low point of $315 million in 2014 before rapidly increasing to $351 million in 2016 due in part to high export costs while ramping up operation of the North Shore Marine Transfer Station. (When the North Shore MTS opened, it did not immediately begin handling a full load of refuse export and as the station’s fixed costs were spread over a relatively low refuse tonnage, per ton costs were high. At the same time, despite paying the MTS fixed costs, the city still had to pay to export some of the refuse via another method that increased export costs during this ramping up period.)
During years where the refuse export budget declined, static export costs and reductions in refuse tonnage have combined for modest decreases. In recent years, though, newer, more expensive long-term contracts and the very high cost of export from the North Shore MTS as it ramps up have combined to produce larger increases in the refuse export budget.
Long-Term Contract for MGP Also Expensive. The SWMP also called for a new long term MGP acceptance contract, which the city entered into during 2009 with Sims Hugo Neu Corporation (now Sims Municipal Recycling). The SWMP projected that the long-term contract and a new privately financed acceptance facility in Brooklyn would lower the cost for processing MGP to an average price of $53 per ton from $107 per ton when MGP collection was suspended. In 2006, while still operating under a short-term interim contract, per ton processing costs reached $70 per ton in 2016 dollars ($54 in 2006 dollars). But when the long-term contract was put into place in 2009, MGP processing costs rose to $78 per ton, before leveling off at around $75 per ton in 2016. In total, DSNY’s MGP processing cost has risen from $17 million in 2006 (2016 dollars) to $20 million in 2016, although some years have seen small declines when recyclable tonnage fell enough to offset the increase in cost per ton.
Some Progress on Sustainability and Equity
As outlined in the SWMP, changes to the city’s waste collection and export systems were driven not only by fiscal concerns, but also by considerations of environmental sustainability and the equitable distribution of sanitation infrastructure throughout the city. After the closure of Fresh Kills, one of the main concerns has been the burden that truck traffic has on communities that host sanitation infrastructure, including lower air quality, traffic congestion, odors, and even commandeering local parking spaces. The SWMP contained plans for marine transfer stations to be constructed in Queens, Brooklyn, and Manhattan to address these concerns and disperse the burden more evenly among boroughs. The plan also sought to transfer waste for export at locations closer to where it is collected and export it via barge and rail instead of by truck to reduce the impacts of frequent sanitation truck traffic on affected communities.
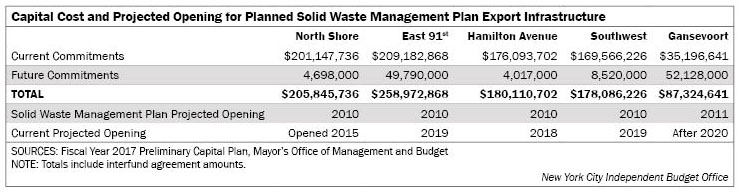
Marine Transfer Stations Behind Schedule. Four marine transfer stations for waste export were planned as part of the SWMP and were projected to be operational by 2010. Brooklyn hosts two facilities, one at Hamilton Avenue and the Southwest facility located on Shore Parkway. Manhattan and Queens have one marine transfer station each, at East 91st Street on the Upper East Side and the North Shore station in College Point. The SWMP also called for constructing a new facility for accepting recyclables, envisioning replacing the West 59th Street MTS (which is currently a transfer site for mixed paper) with a commercial waste marine transfer station and creating a new facility to accept recyclables at a former DSNY MTS at Gansevoort on Pier 52 (West 12th Street) in Manhattan. The commercial MTS at West 59th is outside the scope of this analysis, but the proposed acceptance facility at Gansevoort is included. Recognizing that several issues related to Hudson River Park had to be resolved before construction could begin, the SWMP set a milestone of opening Gansevoort by 2011.
The four waste marine transfer stations—many of which faced intense community opposition—did not open by 2010 as originally envisioned, but are now either currently open or on track to open in the next few years. The North Shore MTS opened in 2015. Although the Hamilton Ave MTS was finished in 2016, it did not have an export contract until 2017 and it is currently scheduled to begin export early in 2018. The final two stations, Southwest Brooklyn and East 91st, are projected to open in fiscal year 2019, according to DSNY. Capital commitments for the two MTSs currently in operation (North Shore in Queens and Hamilton Avenue in Brooklyn) total $201 million and $176 million, respectively, with some additional capital spending planned for the North Shore MTS ($4.7 million) and Hamilton Avenue ($4.0 million) through 2018.
For the MTS at East 91st, capital costs are expected to total $259 million—$209 million that was already committed through the end of 2016 and another nearly $50 million planned through 2019, with $30 million of that allocated for the construction of a second entrance ramp in response to local residents’ concerns about street congestion.
The Southwest station is also nearing completion with nearly $170 million committed through the end of 2016 and an additional $9 million in planned capital expenditures through 2019 for a total projected cost of $178 million.
Construction has not yet begun on the Gansevoort facility to accept recyclables. The project still has not received all the required approvals from the state government, preventing the city from moving forward.2 The project is currently budgeted to cost $87 million, with $35 million already committed for design and construction through 2016. The remaining $52 million of capital spending is mostly expected to occur in 2020.
DSNY Truck Mileage Declines. To assess whether DSNY has made progress towards reducing the adverse impacts of truck traffic in the city due to waste collection and export, IBO calculated the trend in the mileage sanitation trucks travel per year. This includes miles driven by DSNY trucks and those driven by private transfer station trucks within the city that are exporting DSNY refuse.3 This captures the changes in the mode of refuse export from the city—moving to long-term contracts for rail and barge transport—as well declining tonnages and shifts in DSNY operations that impact city residents.
DSNY’s waste transfer system is complex in the aggregate, consisting of a network of garages, sanitation districts, transfer stations both within and outside city limits, private companies, and different truck types that move waste within and outside the city. IBO has data on individual DSNY truck trips, which includes time in and out and tonnage collected, but it does not provide direct access to actual truck mileage measured by odometer readings. Therefore, for the DSNY trucks, we estimate the mileage based on the known distances between garages/storage facilities, collection zones, and tipping locations where the waste is unloaded for private transfer, and assume trucks use the fastest route given the number of driving segments for the trip. IBO’s methodology for calculating sanitation truck mileage includes DSNY trucks and the distance they drive on their way to and from the collection zone. IBO assumes that each truck’s collection route within the district is static, and that trucks must traverse each street to collect refuse and recycling no matter what modifications are made to the overall system. This travel within the collection district is omitted from IBO’s calculation of DSNY truck mileage. In contrast, mileage that is driven outside the district, such as to marine transfer stations or garages is more likely to change in response to changes to the structure of the waste collection system.
Using data from the state Department of Environmental Conservation (DEC), IBO then estimated the mileage driven by the private transfer station trucks that transport DSNY waste from the transfer station (where the waste is tipped by city sanitation trucks) to landfills. For these trips, however, IBO only calculated the mileage driven from the transfer station until it leaves city limits. For each private transfer station, the DEC data includes the share of the tonnage that is transported by road, rail, water, or other mode of transport. It also includes the names and locations of landfills where the waste is transported. IBO estimated the shortest route from the location of the transfer station to the nearest exit point from the city in the direction of the landfill to which it was headed. For example, DSNY waste at a transfer station in the Bronx that is headed towards a landfill in Pennsylvania or Western New York would be assumed to exit the city at the George Washington Bridge. This mileage was added each year to the estimates of DSNY mileage.
IBO’s analysis shows considerable year to year variability in individual truck routes as particular transfer stations or garages are shifted to locations closer to their district or as transfer stations switch from truck to rail export. However, the sum of miles traveled by all DSNY collection trucks and private transfer trucks has generally declined over time. Using the methodology described above, truck mileage has decreased by 19 percent since the SWMP was adopted, going from 17.7 million miles traveled in 2006 to 14.3 million miles in 2016. Overall, truck mileage fell on average 2 percent per year. It is unclear to what extent DSNY actions such as shifting collection arrangements or shifting waste export to rail and barge are responsible for this decline or if macro trends such as declining citywide waste tonnage that are outside the city’s control are larger factors. Regardless, the declining mileage has substantial benefits—including reduced traffic and air pollution—for the communities that are on common truck routes.
In order to specifically evaluate the impact of the new marine transfer stations on truck mileage, IBO examined how truck mileage has changed in the areas served by the North Shore MTS. In 2016—the first full year that the North Shore MTS was open—refuse truck mileage decreased by an average of 27 percent in districts that shifted some deliveries to the North Shore MTS from other interim transfer stations that largely relied on trucks. (Not all waste in districts served by the North Shore MTS is tipped at the MTS.) Mileage driven by DSNY trucks from the districts served by the North Shore MTS increased by an average of 27 percent because some truck routes, particularly from southeast Queens, now involve a longer drive to tip their refuse in northern Queens. However, replacing private truck waste transport out of the district with barges from the new MTS or rail led to steep declines in private export truck mileage and more than offset the increases in DSNY truck mileage.
Even though DSNY truck mileage increased in the North Shore districts, with the attendant rise in fuel usage and maintenance, the overall mileage decline still greatly benefits the city through reduced emissions, congestion, and noise. It is also unclear whether the observed increase in DSNY truck mileage from the North Shore MTS will be repeated as the other marine transfer stations open. The other marine transfer stations are generally located closer to the districts they serve than the current facilities. For example, in its 2014 estimate of the cost of the East 91st Street MTS, IBO projected that the opening of the MTS would reduce DSNY truck mileage in the sanitation districts served by that MTS by 76 percent compared with the status quo. (This estimate does not take into account the impact on private transfer station truck mileage.) Therefore, further declines in truck mileage across the city would be expected as the MTS system continues to come online.
Broader Implications
Despite major differences in the size and makeup of the city’s waste stream from what was envisioned when the SWMP was adopted, DSNY has made progress on some of the goals in the plan, while other goals remain far from met. In response to some of these challenges, the city has announced policy changes that have the potential to help the city meet goals outlined in the SWMP. These newer policies also have the potential to dramatically change the outlook for the city’s future sanitation operations and, along with shifts in the composition of the waste stream, could render some changes made to sanitation infrastructure under the SWMP obsolete.
Improving Recycling Rates. Declining waste tonnage citywide, which is outside the department’s control, has led to overall cost and truck mileage declines, but has also constrained DSNY’s effort to increase the diversion rate. This has had the effect of making recycling less economical compared with refuse collection. In particular, the declines in paper tonnage have made it particularly difficult for DSNY to meet the goals of the SWMP: holding down the diversion rate, reducing recycling revenues, and making recycling collection less efficient. The city, however, is far enough away from its very ambitious recycling targets set in the SWMP that even accounting for the headwinds of a less favorable waste stream would not bring them much closer to the targets outlined in the plan. Conversely, gains in the DSNY’s capture rates provide some evidence that DSNY’s efforts to improve recycling efficiency and the public’s recycling habits are having an impact.
To address some of these issues, DSNY recently announced it is pursuing implementation of single stream recycling by 2020, when paper, metal, glass, and plastic would all be collected in the same bin. Switching to this system would likely increase capture rates and recycling tonnage and make recycling collection more efficient in future years. Still, retooling the entire collection and processing system to switch from two streams (paper and metals/glass/plastic) to one is a complex undertaking and may require more than a few years to implement.
Lowering Export Costs and Improving Equity. DSNY has achieved more success in other areas, such as implementing rail-based export and long-term contracts for waste disposal as planned and guaranteeing landfill space. Although these contracts have provided cost certainty, it is not clear that they have actually saved the city money compared with continuing to operate under short-term contracts. Furthermore, the long-term per ton costs that have been locked in at the North Shore marine transfer station have so far been higher than those under long-term contracts relying exclusively on export by rail, suggesting that the cost of exporting refuse could continue to rise. Other trends, such as declining refuse tonnage are also likely to push per ton costs higher. One proposal to contain costs, suggested in the SWMP, is to have commercial waste carters use future excess capacity at the marine transfer stations. The more recent proposal of a franchise zoned commercial collection system could also offer the city more control over where commercial carters tip. Boosting the tonnage of waste exported by the marine transfer stations could bring down per ton costs for the city, although it could increase costs for the commercial carters compared with their existing waste export arrangements.
Construction of the marine transfer stations has been slower than planned, but—with the exception of the planned recycling facility at Gansevoort—those that are not yet in use are scheduled to open within the next several years. Once these stations open, they will improve geographic equity in the distribution of city sanitation infrastructure and will contribute to reducing truck miles associated with waste export in the city—two goals of the SWMP.
Progressing Towards Zero Waste. As part of its OneNYC vision announced in April 2015, the city set a goal of sending zero waste to landfills by 2030. In order to achieve this ambitious goal, DSNY would have to find a way to divert from the refuse stream the remaining types of nonrecyclable waste, the largest share of which is composed of organics such as food scraps and food-soiled paper. While the city does not yet have a plan for diverting all types of refuse from landfills, DSNY is currently piloting a voluntary curbside organics collection program in select city neighborhoods.
If organics recycling were implemented as a mandatory program citywide, it could, together with single stream recycling, greatly improve the diversion rate in the future and upend the current status quo where refuse tonnage is vastly greater than recycling tonnage. In the long term, this would have broad implications for DSNY operations and costs, as large increases in the collection efficiency of recyclables from the increased tonnage could make recycling far less expensive for DSNY, relegating refuse to a rump program for the remaining nonrecyclable waste.
Moreover, if the city is successful in dramatically reducing exported refuse by 2030, then much of the infrastructure built to facilitate the SWMP would have to be repurposed for organics and recycling export or risk being rendered obsolete. Currently DSNY has plans to continue expanding organics collection, with the eventual goal of running the program citywide, but organics processing capacity in the region is still too limited for the entire city and even after capacity expands, it would take time and a concerted public education campaign to increase public participation.
Over the final 10 years of the SWMP, as the remainder of the plan is phased in, further planning and adjustments will be required to continue making progress towards efficiency, equity, and environmental goals, particularly as the size and composition of the city’s waste stream continues to evolve and less waste is transported to landfills.
Prepared by Daniel Huber
NOTE: This report was updated on August 25, 2017 to reflect new information on waste-to-energy export contracts.
Endnotes
1Refuse and recycling data before 2006 are from DSNY’s Solid Waste Management Plan while refuse and recycling data from 2006 and after are from other DSNY truck run collection data. IBO’s methodology sought to minimize the difference between these data sets to create a continuous and consistent series. Therefore collection numbers here may differ slightly from DSNY published reports.
2DSNY must still sign a memorandum of understanding with New York State before construction can begin on the recyclables facility. The MTS will occupy part of the Hudson River Park, which means the construction is considered an alienation of parkland for which the city must compensate the Hudson River Park Trust.
3IBO’s calculations of DSNY truck miles include a small amount of mileage outside city limits when DSNY trucks tip at a transfer station in New Jersey or on Long Island. Calculations for private trucks exporting DSNY waste only include mileage driven within city limits.
PDF version available here.
Receive
notification of free reports by e-mail