 |
The Independent Budget Office 110 William Street - 14th Floor, New York, NY 10038 |
|
The Independent Budget Office 110 William Street - 14th Floor, New York, NY 10038 |
February 14, 1997
The New York City Charter requires the Independent Budget Office (IBO) to publish a report each February discussing the amount of revenues and expenditures anticipated for the City in the coming fiscal year. This publication, entitled New York City's Fiscal Outlook, is IBO's first such report. We report findings from our newly developed current services budget baseline including an independent revenue estimate and forecast of City spending through 2001.
Coming so closely on the heels of the Mayor's preliminary budget released just two weeks ago, it must be emphasized up front that our Fiscal Outlook report is not an analysis of the Mayor's budget proposal. It is not a prediction of future policy and budget decisions to be made by the Mayor and the City Council, nor is it a recommended course of action. Instead, it is an independent projection of baseline revenues and expenditures for fiscal year 1998 and beyond assuming that current spending policies and tax laws remain unchanged.
The report's primary purpose is to serve as an objective, long-term planning tool for City officials responsible for adoption of the City's annual budget. It should be viewed as a starting point for consideration of the Mayor's budgetary proposals and a benchmark against which to measure the costs of policy initiatives. From a longer-term perspective, it is an early warning indicator capable of identifying future fiscal difficulties for the City.
The report begins with an overview, followed by our national and local economic outlook, a forecast of City revenues along with a discussion of long-term tax policy, our baseline spending projections, and alternative budget outcomes that could result under certain circumstances. It should be noted that our analysis of the Mayor's preliminary budget is underway and will be issued next month as required by the Charter.
All IBO staff worked tremendously long and hard to make this report a reality. It was completed under the supervision of Ronnie Lowenstein who heads IBO's Economic Analysis Division and C. Spencer Nelms, Jr. who leads our Budget Analysis Division. The revenue forecast chapter was principally written by George Sweeting and Michael Jacobs, and the long-term revenue issues chapter by David Belkin and George Sweeting. Our current services spending projections were coordinated by Frank Posillico. The expenditure forecast and alternative budget outcomes chapters were principally written by Paul Lopatto, Sophia Quintero, Terri Matthews, Patrick Killacky, Nancy Penksa, Ian Brown, and Martha Prinz. A list of IBO contributors and their respective areas of responsibilities follows at the end of the report.
| Douglas A. Criscitello Director |
TWO APPROACHES TO PROJECTING AND ANALYZING THE BUDGET
DEBT LIMIT, DEBT SERVICE, AND THE CAPITAL BUDGET
Overview
Partly in response to the fiscal crisis of the 1970s, a number of fiscal monitors closely review the City’s financial condition. These monitors assess risks, identify one-shots, and project gaps. Since the conventional analysis of the budget focuses primarily on the margins of the budget and not the baseline, it does not strip all subjective elements from the City’s core financial plan. While risks can be identified and assumptions disagreed with, until now there has never been an independent look at the budget with projections of expected revenues and expenditures based on current tax laws and spending policies. As required by the New York City Charter, IBO has prepared this report to provide such a forecast.
The current services baseline contained in this Fiscal Outlook provides a meaningful alternative reference point for elected officials and the public to consider the Mayor’s preliminary budget as the annual budget process begins. This baseline projection provides a policy-neutral benchmark against which competing budget proposals can be compared and serves as an early warning system capable of identifying future fiscal difficulties. While new to New York City, current services budgeting has been a useful planning tool for the federal government for many years—used extensively by both the Congressional Budget Office and the White House budget office. It must be emphasized, however, that this report is not an analysis of the Mayor’s preliminary budget. Such an analysis by IBO is underway and will be completed in March as required by the Charter.
This chapter provides an overview of IBO’s budget outlook for 1998 through 2001 assuming continuation of current expenditure policies and tax laws.
Economic and Revenue Forecasts
The New York City budget is profoundly affected by the strength of the U.S. and City economies. As the U.S. economic expansion heads into its seventh straight year, IBO expects the pace of economic activity to moderate and inflation to remain under control (see Chapter 2). Slower growth in the national economy—coupled with more moderate increases in securities industry profits—is projected to cause economic growth in New York City to decelerate over the next several years, in turn slowing the rate of increase in the City's cyclically-sensitive sources of revenue.
As detailed in Chapter 3, IBO has developed its own forecasts of nine major taxes (property, commercial rent, mortgage recording, real property transfer, personal income, general corporation, unincorporated business, banking corporation, and sales). For all other taxes, we have adopted the Office of Management and Budget’s (OMB) forecasts as contained in the Mayor’s preliminary budget for 1998.
Fueled by record earnings on Wall Street, tax revenues have grown briskly in 1997, particularly collections from personal and business income taxes. Although 1998 tax revenue growth is expected to be somewhat less robust as Wall Street returns to a normal level of profits, continued economic expansion at a more moderate rate will sustain revenue growth through 2001. IBO projects that tax revenues will grow by an average of 2.7 percent each year from 1997, reaching $20.9 billion in 2001.
| Figure 1-1. Baseline Tax Revenue Forecast (By fiscal year, in millions of dollars) | |
| 1996 | 18,129 |
| 1997 | 18,806 |
| 1998 | 18,937 |
| 1999 | 19,542 |
| 2000 | 20,247 |
| 2001 | 20,894 |
| SOURCE: Independent Budget Office. | |
Structural Tax Gaps
A critical issue for the City’s long-term fiscal health is highlighted in Chapter 4. Based on new research which re-creates the history of tax policy changes and tax revenues, IBO finds that New York City baseline revenue growth has lagged economic growth over most of the past two decades. Our research shows that this structural lag has played a much larger role than changing tax policies in influencing the overall size of the City revenue burden and the mix of City revenue sources. This finding raises serious concerns about the ability of the City’s current tax structure to reliably generate sufficient revenue to meet ever increasing spending needs.
IBO has explored one of the possible explanations for this long-term lag in revenues: constraints limiting the City’s ability to capture market value growth which are built into the structure of the property tax. We found that among certain residential properties, these limits have cost the City nearly half of the value growth which has occurred since the system was created in 1983. Given the property tax system’s complex process for shifting tax burdens, some of this revenue has been made up, although at the cost of increasing the disparities in relative burdens.
Expenditure Forecast
Chapter 5 displays IBO’s current services spending estimates. We project total spending to increase an average of about 2.9 percent each year, from $33.5 billion in 1997 to $37.5 billion in 2001.
| Figure 1-2. Baseline Expenditure Forecast (By fiscal year, in millions of dollars) | |
| 1996 | 32,067 |
| 1997 | 33,522 |
| 1998 | 33,728 |
| 1999 | 35,511 |
| 2000 | 36,719 |
| 2001 | 37,529 |
| SOURCE: Independent Budget Office; Net of intra-City and inter-fund agreements. | |
For most City agencies and programs, we projected future costs by adjusting current spending levels for expected changes in the cost of goods and services in New York City. These discretionary programs are driven principally by the annual appropriations process and are largely in the direct control of the City. The costs of non-discretionary programs, which are driven principally by factors beyond the immediate control of the City, such as welfare assistance, were estimated based on IBO’s projections of future costs.
Two Approaches to Projecting and Analyzing the Budget
IBO will maintain two distinct projections of the City’s budget—a baseline (the focus of this report) and a re-estimate of the Mayor’s budget (under development for our forthcoming March report). While both are forecasts of projected expenditures and revenues, they are very different measures—used for fundamentally different purposes—and should not be viewed as competing estimates.
Current Services Baseline Projections
IBO’s work products include analyses of annual budgets, fiscal impact statements, and other economic and budget projections. Such work calls for a benchmark against which to measure the effects of policy or economic changes on the City’s budget. This benchmark, or baseline, is designed to project spending and revenues into the future assuming continuation of inflation-adjusted current spending levels and no changes to existing tax laws.
It must be stressed that our current services baseline estimates are not predictions of future policy and budget decisions by the Mayor and the City Council, nor are they recommendations. Instead, these estimates represent a mechanical computation of what the City’s budget would look like if put on "auto-pilot" with all existing spending and taxing policies running their course into the future. Such estimates should not be interpreted as constraining policymakers in any way.
A policy-neutral baseline provides a meaningful starting point for analysis of the City’s fiscal condition as the annual budget process gets underway. It also provides a benchmark against which competing budget proposals can be compared and serves as an early warning system capable of identifying potential fiscal difficulties in the future. Further, for tax and certain spending programs driven by factors beyond the direct control of the City government, it is a valuable tool for considering changes in policy, rather than basing such analyses on changes from prior year funding levels.
We have developed a set of procedures to construct our baseline. Among the most significant:
Policy Projections (coming in March)
Our baseline projections serve as the starting point for re-estimating the Mayor’s budget. The baseline is altered to reflect the fiscal effect of proposals contained in the budget, including all spending priorities, out-year gap closing initiatives, and changes to tax policy. Resulting budgetary implications, however, are not identical to those contained in the Mayor’s plan because IBO uses different assumptions to derive its estimates.
Policy differences result from varying assumptions about anticipated actions of governmental entities beyond the control of the City, such as the judiciary and federal and State governments.
Economic differences can be traced to a number of key variables that drive the City’s budget—principally economic growth, wages, sales, and interest rates. These variables have a profound impact on revenues accruing from taxes on personal income, property values, business profitability, and retail sales activity.
Technical differences comprise the remainder of the variance between IBO and mayoral projections.
Highlights of our spending projections include the following:
Alternative Budget Outcomes
Chapter 6 discusses a number of factors that could cause IBO’s baseline spending and revenue forecast to be significantly different.
Economic Forecast
The Economic Outlook
The New York City budget is profoundly affected by the strength of the U.S. and City economies. When economic growth accelerates, the City takes in more revenue from personal income, business, and sales taxes. The impact of the economy on the budget is not just confined to revenues—expenditures are affected as well. For example, welfare caseloads generally fall when economic growth accelerates, causing City spending for public assistance to decline.
IBO expects the rate of growth of both the U.S. and the New York City economies to moderate over the next several years, in turn slowing the rate of increase in the City’s cyclically-sensitive sources of revenue.
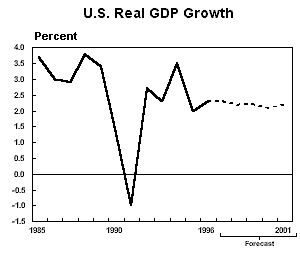
U.S. Economic Forecast
As the U.S. economic expansion heads into its seventh straight year, IBO expects continued growth at a moderate and sustainable rate (see Figure 2-1). Real gross domestic product is forecast to increase at the same 2.3 percent annual rate in calendar year 1997 as in 1996, followed by a slightly lower rate of growth in 1998 and beyond.1,2 This moderate rate of growth, close to the long-run average sustainable rate of growth for the U.S. economy, is expected to keep inflation in check. If inflationary pressures remain under control, the Federal Reserve is unlikely to tighten monetary policy in the near term. Conversely, if the economy continues to grow, there is little reason for the Federal Reserve to ease monetary policy. The IBO forecast includes the following key features:
IBO’s longer-term economic projections for 2000 and 2001 are based on potential growth of the U.S. economy. At the national level, potential growth is determined by factors such as increases in the labor force, growth of the capital stock, improvements in productivity, and technological progress. Real U.S. output is projected to rise 2.1 percent in 2000 and 2.2 percent in 2001—just slightly slower than the economy’s current rate of growth.
| Figure 2-1. U.S. Economic Outlook by Calendar Year | ||||||
| Actual | Forecast | |||||
| 1996 | 1997 | 1998 | 1999 | 2000 | 2001 | |
| Real GDP | ||||||
| Billions of 1992 dollars | 6,901P | 7,057 | 7,214 | 7,375 | 7,517 | 7,684 |
| Percent change, year over year | 2.3P | 2.3 | 2.2 | 2.2 | 2.1 | 2.2 |
| Personal Income | ||||||
| Percent change, year over year | 5.5P | 4.8 | 4.9 | 5.1 | 4.9 | 4.7 |
| Payroll Employment | ||||||
| Millions of jobs | 119.5 | 121.5 | 123.2 | 125.0 | 126.7 | 128.2 |
| Percent change, year over year | 2.0 | 1.7 | 1.4 | 1.4 | 1.3 | 1.2 |
| Civilian Unemployment Rate | ||||||
| Percent | 5.4 | 5.5 | 5.7 | 5.7 | 5.7 | 5.8 |
| Consumer Price Indexa | ||||||
| Percent change, year over year | 2.9 | 2.7 | 2.8 | 2.8 | 2.8 | 2.8 |
| Thiry-year Treasury Bond Rate | ||||||
| Percent | 6.7 | 6.5 | 6.3 | 6.2 | 6.0 | 5.9 |
| Ten-Year Treasury Bond Rate | ||||||
| Percent | 6.4 | 6.1 | 5.9 | 5.9 | 5.6 | 5.5 |

| SOURCES: | Independent Budget Office; Department of Labor, Bureau of Labor Statistics, Department of Commerce Bureau of Economic Analysis; WEFA Group. |
| NOTES: | P. Preliminary 1996 figures. All data are annual values; growth rates are year over year. a. Consumer price index for all urban consumers (CPI-U). |
New York City Economic Forecast
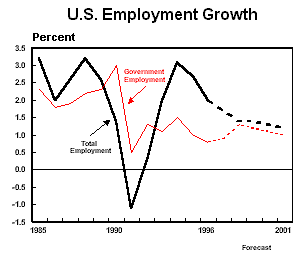
Although New York City’s economic fortunes are strongly influenced by the nation’s, the City’s economy generally grows more slowly.3 As a mature economy with a relatively stable population, employment growth in New York City tends to be roughly one percentage point below employment growth nationwide. Even during the boom years of the 1980s, City employment growth was less robust than for the U.S. as a whole.
IBO expects that slower growth in the U.S. economy, coupled with more moderate increases in securities industry profits, will cause growth in New York City’s economy to decelerate over the next few years (see Figure 2-2). Key features of the forecast include:
| Figure 2-2. New York City Economic Outlook by Calendar Year | ||||||
| Actual | Forecast | |||||
| 1996 | 1997 | 1998 | 1999 | 2000 | 2001 | |
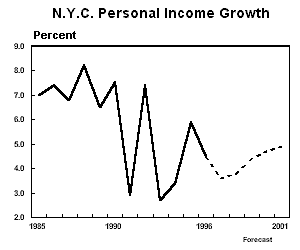
| Personal Income | ||||||
| Percent change, year over year | 4.5P | 3.6 | 3.8 | 4.4 | 4.7 | 4.9 |
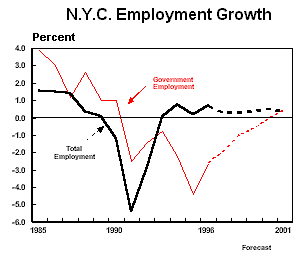
| Total Payroll Employment | ||||||
| Thousands of jobs | 3,341.5 | 3,351.6 | 3,362.8 | 3,376.5 | 3,393.9 | 3,408.3 |
| Percent change, year over year | 0.7 | 0.3 | 0.3 | 0.4 | 0.5 | 0.4 |
| Government Sector Employment | ||||||
| Thousands of jobs | 522.0 | 515.0 | 510.8 | 508.3 | 508.4 | 510.9 |
| Percent change, year over year | -2.6 | -1.9 | -1.0 | -0.6 | 0.0 | 0.5 |
| Retail Sales | ||||||
| Percent change, year over year | 3.3P | 1.7 | 2.2 | 2.2 | 2.2 | 2.2 |
| Civilian Unemployment Rate | ||||||
| Percent | 8.7 | 8.9 | 9.0 | 9.1 | 9.1 | 9.2 |
| Consumer Price Indexa | ||||||
| Percent change, year over year | 2.9 | 2.5 | 2.9 | 3.0 | 3.1 | 3.1 |
| SOURCES: | Independent Budget Office; Department of Labor, Bureau of Labor Statistics, Department of Commerce Bureau of Economic Analysis; WEFA Group. |
| NOTES: | P. Preliminary 1996 figures. All data are annual values; growth rates are year over year. a. CPI-U for the New York-Northern New Jersey region. |
Revenue Forecast
Total revenues are divided into three categories: tax revenues, which are expected to account for $18.8 billion in 1997 (56 percent of the total revenue budget); intergovernmental aid and grants, which account for $11.4 billion (34 percent); and miscellaneous revenues, which account for $3.5 billion (10 percent). The outlook for each revenue stream varies, with tax revenue showing the strongest growth through 2001.
To project tax revenues, IBO has developed its own forecasts of nine major taxes—property, commercial rent, mortgage recording, real property transfer, personal income, general corporation, unincorporated business, sales, and banking corporation. For all other taxes, tax-related PEG initiatives, and audit revenues, we have adopted the Office of Management and Budget’s (OMB) forecasts from the January 1997 Financial Plan.
Fueled by record earnings on Wall Street, total tax revenues are growing briskly in 1997, led by collections from personal and business income taxes. Although 1998 tax revenue growth is expected to be somewhat less robust as Wall Street returns to a more normal level of profits, continued economic expansion at a more moderate rate will sustain revenue growth through 2001. For the forecast period, IBO projects that tax revenues will grow by an average of 2.7 percent per year, reaching $20.9 billion in 2001.4 Figure 3-1 summarizes IBO’s annual forecasts for tax revenues.
Throughout the forecast period, personal income and sales taxes show the strongest growth. Although earnings and profits from Wall Street are key contributors, even after 1998, the growth in these economically sensitive taxes reflects expansion in other sectors of the City’s economy as well as the continuing shift in the City’s employment mix from low to high wage jobs. While the City’s real estate markets are forecast to register moderate growth, the property tax, the City’s largest single revenue source, is expected to show virtually no growth until 1999, at which time it will grow at less than half the rate of other taxes.
IBO’s tax revenue projections are very similar to those of OMB. Our forecast is slightly more optimistic through 1999, with $76 million of additional revenue in 1997, $34 million in 1998, and $62 million in 1999. In contrast, IBO’s projection is $23 million lower than OMB’s in 2000 and $232 million lower in 2001.
The following sections contain IBO’s projections for those taxes we independently forecast.
| Figure 3-1. Baseline Tax Revenue Forecast through 2001 (By fiscal year, in millions of dollars) | ||||||
| Actual | Forecast | |||||
| 1996 | 1997 | 1998 | 1999 | 2000 | 2001 | |
| Property Tax | 7,100 | 7,133 | 7,163 | 7,324 | 7,524 | 7,719 |
| Property Related | 902 | 779 | 816 | 853 | 894 | 933 |
| Property Tax | 3,964 | 4,210 | 4,359 | 4,557 | 4,782 | 4,933 |
| Personal Income Taxes | 2,742 | 2,849 | 2,956 | 3,083 | 3,223 | 3,369 |
| General Sales Tax | 2,742 | 2,849 | 2,956 | 3,083 | 3,223 | 3,369 |
| Business Income Taxes | 2,064 | 2,323 | 2,089 | 2,179 | 2,266 | 2,359 |
| Other Taxes w/PEGS & Audits | 1,357 | 1,512 | 1,554 | 1,546 | 1,558 | 1,581 |
| Total Tax Revenue | 18,129 | 18,806 | 18,937 | 19,542 | 20,247 | 20,894 |
| SOURCES: | Independent Budget Office; Department of Labor, Bureau of Labor Statistics, Department of Commerce Bureau of Economic Analysis; WEFA Group. |
| NOTES: | P. Preliminary 1996 figures. All data are annual values; growth rates are year over year. a. CPI-U for the New York-Northern New Jersey region. |
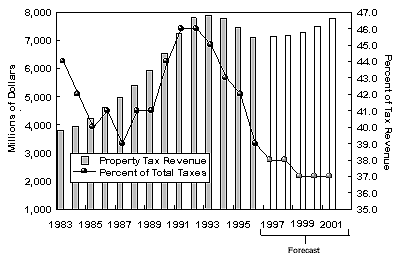
Real Property Tax
The real property tax (RPT) is the City’s largest single revenue source, accounting for 38 percent of projected 1997 tax receipts, although its share has slowly been declining over time. In 1983, when the current system was put into place, it brought in 44 percent of total tax collections. The bars in Figure 3-2 show property tax collections over the past 15 years, while the line indicates the percentage of total city tax revenues attributable to the tax. For the forecast period, collections are expected to grow by only 0.4 percent in 1998, and an average of 2.5 percent per year in 1999 through 2001.
Background
Since 1983, the City’s property tax system has been based on four tax classes: Class 1, largely made up of one-, two-, and three-family homes; Class 2, composed of apartment buildings with more than three units, including cooperatives and condominiums; Class 3, made up of the real property of utility companies; and Class 4, composed of all other property. Property valuation methods and tax burdens differ from class to class. Shifts in the relative shares of the total levy are limited under the property tax law’s complex class share system.
| Figure 3-2. Real Property Tax Revenues |
 |
| SOURCE: Independent Budget Office. |
The different treatment of the classes is shown in the pie charts in Figures 3-3 and 3-4. Figure 3-3 shows the market value. The share of market value for Class 2 is 22 percent, although this an artifact of a distortion built into the property tax law.5
| Figure 3-3. Market Value, by Class |
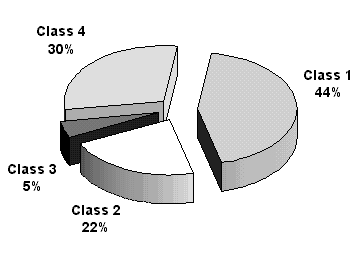 |
| SOURCES: Independent Budget Office; 1997 Assessment Roll. | NOTE: Numbers may not total due to rounding. |
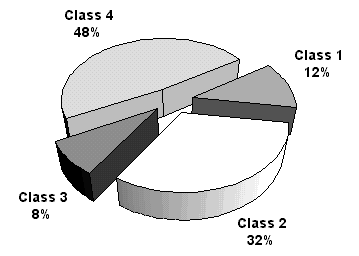
Figure 3-4 shows the amount of billable assessed value in each class. Billable assessed value, which is net of exemptions and—for Classes 2, 3, and 4—of phase-ins of prior assessment changes, is the basis for tax liability. The ratio of billable assessed value to market value varies by tax classes, with Class 1 having the lowest ratio at 6.9 percent. As a result of these differences, the shares of assessed value shown in Figure 3-4 are significantly different from the shares of market value shown in Figure 3-3. Class 1, which had the largest share in Figure 3-3, falls to third, with 11 percent of the total. Class 4’s share is the largest at 48 percent.
Although the property tax is considered a locally administered tax most of the key structural aspects of the system, including the make-up and treatment of the classes, the methods and measures used to determine each class’ share of the levy, and the determination of what types of properties receive exemptions, are all set by State law. The only important feature entirely under the City’s control is the size of the levy, or total liability, that it sets for the fiscal year.
| Figure 3-4. Billable Assessed Value, by Class |
 |
| SOURCES: Independent Budget Office. 1997 Assessment Roll. |
The amount of tax that each property owner is liable for is based on the size of the levy the City chooses to set and the assessed value assigned to each piece of property. Properties are reviewed each year by the Department of Finance to determine their assessed value.6 In June, as part of budget adoption for the coming fiscal year, the City Council sets the tax rates. There is a different tax rate for each of the four tax classes, with the rates set at the level necessary to bring in each class’ share of the desired levy. By agreement between the City Council and former Mayor Dinkins and continuing under Mayor Guiliani, the overall average tax rate has been frozen since 1992.7 Although the rate has been frozen, there have been small shifts between tax classes reflecting changes in the relative shares of market values. In 1997, the rates are $10.785 per $100 of assessed value for Class 1; $11.056 per $100 for Class 2; $7.84 per $100 for Class 3; and $10.252 per $100 for Class 4.
Forecast
Property tax collections are made up of payments for liabilities determined by the current year’s levy and payments from prior years for liabilities which were previously unpaid. Current year payments account for the vast bulk of collections. The first step in forecasting collections for each year of the financial plan is to estimate what the levy will be in that particular year. Estimates are then made for the amount of delinquencies, other reserve components, and prior year collections which will occur in the same fiscal year.
The tentative assessment roll which will serve as the basis for the 1998 levy was released by the Department of Finance in January. The billable assessed value was $76.3 billion, a modest increase of 1.1 percent over the prior year. It is expected that by the time the final 1998 roll is published in June, adjustments by the Department of Finance and the Tax Commission will lower the billable value to $75.5 billion, virtually unchanged from 1997. Assuming that the tax rates remain frozen, the levy will also remain virtually constant at $7.8 billion.
Forecasts for the levy in the remaining years of the financial plan period are based upon forecasts of assessed value for each of the tax classes. Overall, the levy is projected to grow at an average annual rate of 2.5 percent from 1999 through 2001.
Assessed value in Tax Class 1 showed growth of 2.15 percent on the 1998 tentative roll. Based on sales reports from the Department of Finance, it appears that the long decline in sales prices which began in 1988 has finally slowed, although in real terms, prices continued to edge down slowly in calendar year 1996.
IBO has developed an econometric model to forecast future sales prices with local employment as the key explanatory variable. Based upon this model, IBO projects that growth in median Class 1 sales prices, in real terms, will begin to recover, with growth averaging 1.3 percent per year in calendar years 1997 through 2001. The trend in sales prices is then used to develop the projected market values and assessed values for the class. For fiscal years 1999 to 2001, assessed value growth averages 1.5 percent per year.
Tax Class 2 had the strongest growth of the four classes on the 1998 tentative roll, with billable assessed value growing by 2.45 percent. Rental buildings, reflecting the improving rental market showed very strong growth, particularly in Manhattan, where billable value grew by 4.3 percent. The value of condominiums, especially in Manhattan, grew at an even faster rate. This probably reflects the sharp increase in rents in newer market rent buildings, which often serve as comparables when assessing condominiums. In contrast, cooperatives, which are usually older and therefore more likely to be valued using rent-regulated buildings as comparables, show virtually no growth in assessed value.
Class 2 properties are assessed based upon the building’s projected (or imputed) income. Thus projected assessed values are determined largely by estimates of future rents. IBO’s forecast takes into account the diverse rental markets within the City. For the Manhattan rental market, rent increases are expected to continue, yielding higher market values and assessments. Annual growth in the years 1999 to 2001 is expected to average 3.7 percent. Manhattan condominiums are expected to show a similar trend. For Class 2 properties outside of Manhattan, current market pressures are only slowly beginning to be felt, the improvement in rental income is expected to be slower, yielding annual assessment growth averaging 2.9 percent from 1999 to 2001. Overall, assessed value in Class 2 is forecast to grow by 2.8 percent in the years after 1998.
Tax Class 3 consists of real property owned by utility companies. The 1998 Tentative Roll indicates that there was virtually no change in value over the prior year. For 1999 to 2001, assessed values in the class are projected to grow at the same rate as the overall City economy.
Tax Class 4 consists of all other commercial property, ranging from small retail buildings to office skyscrapers. Manhattan office buildings account for slightly more than half of the assessed value in this class. On the 1998 Tentative Roll, the class’ billable assessed value fell slightly, with a 2.4 percent decline in Manhattan office buildings outweighing gains in other areas, particularly hotel and retail buildings. In forecasting assessed values for Class 4, IBO divides the class into two segments: Manhattan offices and all others.
The Manhattan office market appears to have stabilized, with real asking rents in primary midtown buildings beginning to recover from their long decline. Even the downtown market, which is still troubled by high vacancy rates, remained relatively stable in calendar year 1996. Driven by slow but steady private sector job growth, the vacancy rate in primary buildings fell to 12 percent last year. IBO estimates that it will continue to fall, reaching just under 10 percent by calendar year 2001. The lower vacancy rate results in higher asking rents, with growth in real terms averaging nearly 1 percent per year from calendar year 1997 through 2001. This modest improvement in income from new leases will slowly work its way into future assessed values. In the forecast period, net incomes of Manhattan office buildings are expected to continue to decline as older 1980s leases, which usually had rents above current market levels, expire and are renewed or replaced with leases based on current market rents.
In other sectors of Class 4, assessment growth is expected to be fairly robust, averaging 3.2 percent a year from 1999 to 2001. This forecast reflects the historical relationship of the values of these properties with the rate of growth in the overall City economy.
For Tax Class 4 as a whole, billable assessed values are projected to recover from their decline in 1998, and then grow at an average rate of nearly 2.5 percent per year from 1999 to 2001.
To complete the property tax revenue forecast, a reserve for uncollectables is estimated. The reserve has several components including estimates of revenue lost for various economic development programs, cancellations of liability due to Tax Commission or Court decisions, and delinquencies. In 1997, an abatement program for cooperative and condominium owners was added to the reserve, with a cost of $70 million in 1998, reaching $130 million by 2001. The most recent OMB forecast has lowered the estimated cost in the reserve for the lower Manhattan revitalization program, reflecting fewer applications than anticipated.
One of the more volatile components of the reserve is the amount of the fiscal year’s levy which remains unpaid, or delinquent, at the end of the year. Delinquency rates reflect—at least in part—the state of the local economy and individuals’ ability to pay their taxes. However, in recent years, changes in the City’s policy for handling delinquent properties have increased the importance of other factors in forecasting the delinquency rate.
In 1996 the City began a widely publicized initiative to sell tax liens on delinquent properties. The City intends to continue these sales throughout the financial plan period. A side effect of these sales has been to discourage taxpayers from falling into delinquency and risk having their properties included in the pool of liens to be sold. Thus, the delinquency component of the reserve is projected to fall. At the same time, the lower delinquency rate reduces the estimate of the collections from prior years. In sum, in each fiscal year collections from the current levy are expected to comprise a bigger share of total revenue.
Overall, the reserve grows on a net basis from $577 million in 1998 to $645 million in 2001. After accounting for the smaller prior year collections, refunds of taxes paid after actions by the tax commission, and the proceeds of the new lien sales, total property tax revenue grows from $7,163 billion in 1998 to $7,719 billion in 2001, an average growth rate of 2 percent per year.
| Figure 3-5. Real Property Tax Levy and Revenue Through 2001 (By fiscal year, in millions of dollars) | ||||||
| Actual | Forecast | |||||
| 1996 | 1997 | 1998 | 1999 | 2000 | 2001 | |
| Property Tax Levy | 7,871.4 | 7,835.2a | 7,830.0 | 8,044.8 | 8,231.8 | 8,435.8 |
| Property Tax Revenues | 7,100.4 | 7,132.5 | 7,162.9 | 7,323.7 | 7,523.5 | 7,719.3 |
| SOURCE: | Independent Budget Office. |
| NOTE: | a. The 1997 levy is an actual figure. |
The Commercial Rent Tax
The commercial rent tax (CRT), which in recent years has been eliminated from all parts of the City except for Manhattan south of 96th Street, is paid by commercial tenants based upon their rent. For those who remain subject to the tax, the amount of rent exempt from taxation has been increased to $40,000, with a sliding credit exempting portions up to $60,000. Additionally, beginning in the last month of fiscal year 1996, the amount of rent subject to the tax is reduced by 25 percent. The current fiscal year is the first full year with all of the new reductions in place. The 1997 CRT forecast of $398 million shows a decline of $133 million from 1996, after adjusting for the base change. OMB projects that CRT receipts increase by 1.5 percent.
IBO’s initial forecast year is 1998, in which the CRT is expected to grow to $410 million, reaching $472 million by 2001, with an average annual growth of 4.4 percent. The forecast is based on projections of office and retail rents in Manhattan. The office rent forecast assumes that a declining vacancy rate will yield increasing market rents in the coming years. Retail rents, which account for a smaller portion of the tax base, are projected to grow faster than office rents, fueled by the increasing demand for retail space in midtown Manhattan.
Real Property Transfer and Mortgage Recording Taxes
The real property transfer tax (RPT) is paid when a deed for real property is transferred between two parties. The tax rate depends on the type of property and the amount of the sale. For residential properties with a sale price of $500,000 or less, the rate is 1 percent of the sale price. For residential properties with prices over $500,000, the rate is 1.425 percent. Transfers of commercial property are taxed at either 1.425 percent or 2.625 percent, depending on whether the sale price is over or under $500,000. There is a separate New York State tax of 0.4 percent on all transactions. In most cases, the seller pays the tax.
The mortgage recording tax (MRT) is charged when a mortgage on real property is recorded with the City. The basis of the tax is the value of the mortgage. The rate is 1 percent for all mortgages under $500,000. For larger mortgages on residential property, the rate is 1.125 percent. For commercial mortgages over $500,000, the rate is 1.25 percent with an additional charge of 0.65 percent dedicated to transit operations. New York State has separate recording taxes totaling 1 percent which are collected at the same time, bringing the total rates to 2 percent, 2.125 percent, and 2.7 percent. In general, the buyer in a property transaction needs a mortgage and therefore is liable for the tax.
The two transfer-based taxes have shown considerable fluctuations in the past, usually in conjunction with the state of the City’s real estate market. For 1997, collections for both taxes are running ahead of initial projections.
OMB projects that revenue for 1997 from the RPTT will be $206 million. In the IBO forecast, collections are projected to be $219 million in 1998 and reach $248 million in 2001. Annual growth averages 4.6 percent for the forecast period. The MRT is projected to bring in $175 million in 1997. IBO projects that growth will average over 5.1 percent in the following years. The forecast is based upon projections of the pace of transactions, and in the case of the MRT, of interest rates. The projected pace of transactions is largely determined by the overall economic outlook for the City.
| Figure 3-6. Property Related Tax Revenues Through 2001 (By fiscal year, in millions of dollars) | ||||||
| Actual | Forecast | |||||
| 1996 | 1997 | 1998 | 1999 | 2000 | 2001 | |
| Commercial Rent Tax | 531.2 | 398.0 | 409.8 | 426.7 | 448.3 | 472.6 |
| Real Property Transfer Tax | 175.4 | 206.0 | 219.4 | 230.4 | 239.6 | 246.8 |
| Mortgage Recording Tax | 147.2 | 175.0 | 186.4 | 195.7 | 206.5 | 213.7 |
| SOURCE: | Independent Budget Office. |
Personal Income Tax
Second in size only to the tax on real property, New York City’s personal income tax (PIT) accounted for $3,908 million or 22.4 percent of total net tax collections in 1996. The tax is paid by City residents, estates, and trusts on taxable income. Taxable income is based on the federal definition of adjusted gross income, modified for State law, less State-defined deductions and exemptions. The tax is generally progressive, meaning those with higher incomes pay at a higher rate. The current top marginal tax rate is 4.46 percent, which includes a 12.5 percent surcharge that has been in effect since 1990. In addition, commuters are taxed on wages earned in the City at a rate of 0.45 percent and on City earnings from self-employment at 0.65 percent.
Withholding payments, quarterly estimated payments of the self-employed and others, and payments accompanying final returns together account for the bulk of gross PIT revenue, 94 percent in fiscal year 1996. The IBO forecast of the PIT is based on separate econometric models and collection analyses of these components, as well as a projection of refunds. For all of these major components of the tax, collections to date in the current fiscal year have been strong relative to 1996, and IBO projects that total net receipts of the PIT will increase 7.7 percent in 1997, to $4,210 million. In 1998, the growth rate of net PIT revenue is expected to slow to 3.5 percent. IBO forecasts $4,359 million in PIT collections in 1998, a $148 million increase over the previous year.
Local economic expansion and increasing wage income have fueled employers’ withholding payments throughout the year. In particular, the large annual bonuses paid by securities firms following the industry’s record profits in calendar year 1996 led to a 13 percent increase over last January’s withholding payments. The IBO projects 1997 withholding collections will equal $3,344 million, an 8.2 percent increase over last year. With expectations of slower local economic growth, a decline in the profits of the securities industry, and a decrease in wage growth, 1998 withholding is expected to stabilize at a 5.3 percent rate of growth. Specifically, IBO projects withholding collections to be $3,522 million in 1998.
IBO forecasts a 7.0 percent growth of the estimated payments component of the PIT for 1997. Investors’ capital gains realized in the booming stock market have generated a 19 percent increase in estimated payments to date in the current fiscal year, but this rate of growth will not be maintained for the remainder of the fiscal year. Collections this January, a month which typically accounts for at least 22 percent of annual estimated payments, were roughly equal to January 1996 collections. Increases in stock market prices, capital gains realizations, and the growth of personal income are expected to level off in calendar year 1997, and taxpayers’ liabilities are projected to decline. As a result, IBO forecasts that estimated payments collections will decrease 2 percent to $721 million in 1998.
Similarly, using an econometric model which incorporates its forecasts of withholding and estimated payments, IBO projects final returns payments to increase significantly this fiscal year, by 11.9 percent to $296 million, and then fall by 3.5 percent in 1998. Receipts are strong so far in 1997, though on average nearly 80 percent of annual collections are received in March and April. Because the liabilities of taxpayers in calendar year 1997 are expected to fall, IBO forecasts a $10 million drop in final returns receipts in 1998, to $285 million.
In the out-years of the financial plan period, IBO forecasts a slightly slower growth of withholding and slow but steady growth of the estimated payments and final returns portions of the PIT. As a result, net PIT revenues are expected to increase at a moderate 4.2 percent average annual rate from 1999 to 2001. The projections assume that the 12.5 percent PIT surcharge, the revenues of which have been partly dedicated to criminal justice programs since 1993, will be renewed and continued by the New York State legislature. IBO has made this assumption because most observers believe there will soon be a legislative agreement regarding the use of surcharge revenues which will lead to formal renewal.8 The surcharge expired at the end of 1996, and thus only PIT collections reflecting taxpayers' liabilities in calendar year 1997 and beyond would be diminished by the failure to reauthorize the surcharge. With the forecasts of net PIT revenue presented here, IBO's revised estimates of the revenue loss from failure to renew the surcharge are $183 million in the current fiscal year and $503 million on average in each of the four subsequent years.
| Figure 3-7. Personal Income Tax Revenue through 2001 (By fiscal year, in millions of dollars) | ||||||
| Actual | Forecast | |||||
| 1996 | 1997 | 1998 | 1999 | 2000 | 2001 | |
| Withholding | 3,090 | 3,343 | 3,522 | 3,705 | 3,889 | 4,000 |
| Estimated Payments | 688 | 736 | 721 | 746 | 771 | 797 |
| Final Returns | 264 | 295 | 285 | 291 | 299 | 309 |
| Other | 274 | 257 | 268 | 276 | 293 | 299 |
| Refunds | -408 | -423 | -438 | -461 | -471 | -473 |
| Net PIT Revenue | 3,908 | 4,210 | 4,359 | 4,557 | 4,782 | 4,933 |
| SOURCE: | Independent Budget Office. | NOTE: | Forecasts assume extension of the 12.5 percent PIT surcharge, which expired December 31, 1996. |
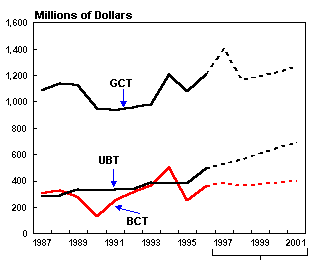
Business Income Taxes
Generating over $2 billion in revenue in 1996, New York City’s three major business income taxes—the general corporation tax (GCT), the unincorporated business tax (UBT), and the banking corporation tax (BCT)—comprise a significant share of City budget revenues. The amount of revenue collected from business income taxes has varied greatly over the past six years, though combined revenue from these sources has consistently accounted for between 11 percent and 14 percent of the City’s annual tax receipts. These taxes, especially the GCT, are highly sensitive to specific developments in financial markets and the financial services industry as well as to general economic conditions. The fluctuations over time of receipts from the major business income taxes have challenged forecasters and at times created unexpected revenue shortfalls and windfalls for the City budget.
Annual growth of combined GCT, UBT, and BCT receipts has averaged 3.2 percent over the last ten years, but year to year changes have been dramatic. Revenues fell nearly 19 percent in 1995 and subsequently increased by over 21 percent in the following fiscal year. Under the baseline economic forecast of moderate expansion in the national and local economies, IBO projects continued solid growth in business tax collections in 1997: net receipts are expected to increase by $259 million or 12.5 percent, to $2,323 million. The IBO forecasts a 10.1 percent drop in business tax receipts in the following fiscal year, which would lead to a $235 million revenue reduction in 1998. For the following three fiscal years, IBO anticipates a resumption of moderate revenue growth, 4.1 percent per year on average for the 1999 to 2001 period.
The specific forecasts for each of the major business income taxes are summarized in Figure 3-8. These forecasts do not reflect the anticipated revenue impact of the proposed tax reduction program presented in the Mayor’s preliminary budget.
| Figure 3-8. Business Income Tax Revenues |
 |
| SOURCE: Independent Budget Office. |
General Corporation Tax
The general corporation tax is imposed on all corporations, domestic or foreign, that employ capital, own or lease property, maintain an office or otherwise conduct business in the City, with the exception of banking corporations which are subject to the BCT.10 The bulk of business tax receipts come from the GCT, which generated over $1,200 million in 1996. GCT receipts in the current year will be even stronger, though IBO forecasts a significant decline in 1998.
Fueled by record-high levels of revenues and profits among securities firms in recent quarters and continued economic expansion on both the national and local levels, GCT receipts through December of this fiscal year are over 30 percent greater than in the comparable period in 1996. Based on an analysis of collections to date in the current fiscal year and an econometric model of historical receipts, IBO projects 16.6 percent growth in GCT revenues to $1,409 million in 1997.
With revenue in the securities industry expected to return to more moderate levels as well as projections of slower economic growth, IBO expects corporate tax liabilities in calendar year 1997 to decrease greatly, dropping to $1,163 million in 1998, a 17.5 percent decline. In the out-years of the financial plan, GCT revenue will increase modestly, by an average 3.0 percent annual rate, from $1,196 million in 1999 to $1,271 million in 2001.
The econometric model used by IBO to forecast changes in GCT receipts features a number of measures including corporate profits, employment in key sectors, and revenues in the securities industry as explanatory variables. The time series of GCT revenue used in the econometric estimation was adjusted for historical changes in the tax rate and the definition of the tax base, while the generated forecasts were re-adjusted to account for the projected impact of recently enacted policies.11 In sum, these policies will reduce GCT revenue below what they would have been in the absence of policy changes, thus dampening the growth of GCT tax revenues over time. When the underlying growth of GCT revenues is considered, absent of policy changes, IBO projects an 11.6 percent decline from 1997 to 1998, and an average 5.4 percent annual increase in the out-years.
Unincorporated Business Tax
Non-corporate businesses in New York City, whether partnerships or sole proprietorships, are subject to the unincorporated business tax and not the GCT. In the past decade, net receipts of the UBT have grown significantly, and in 1996 the tax accounted for a record-high $495 million of the City’s revenue. The significant upturn in the UBT in that year followed two years of decline, yet the revenue swings of the tax have generally been smaller than for the GCT or BCT.
IBO forecasts UBT revenues to be $528 million in 1997, or 6.6 percent greater than the previous year. Continued local economic expansion, personal income growth, and the profits of financial service firms—a large number of which are partnerships—all have contributed to the increase in collections. For 1998, IBO projects $561 million in UBT revenues, 6.4 percent more than the 1997 forecast. In the out-years of the financial plan, UBT revenue is expected to grow from $607 million in 1999 to $689 million in 2001.
As with the GCT, IBO bases its forecasts of UBT revenue on an analysis of collections to date in the current fiscal year and an econometric model. The model utilizes projections of employment, personal income, and before-tax profits to predict net tax receipts, adjusted for rate and base changes. Some of the reforms enacted in calendar years 1995 and 1996, including an increase in the credit against tax liability allowed small business owners, will reduce or eliminate liability for many taxpayers and in turn dampen UBT collections in the coming years. However, the availability in New York State of the limited liability company (LLC) form of business organization since 1995 will greatly boost revenues, because many new firms that previously would have formed as corporations will now become non-corporate companies, subject to UBT and not GCT liabilities. On balance, the projected growth of actual UBT revenues is greater than what would have been expected in the absence of policy changes.
Adjusting the forecasts for the expected contribution of LLCs and other policy effects, the underlying growth of UBT receipts in 1998 would be a more modest 5.5 percent. The projected declines in business profits and personal income will further inhibit UBT growth in the out-years of the financial plan. Specifically, IBO projects the underlying growth of UBT revenues, absent any policy effects, to average 5.2 percent annually from 1999 to 2001.
Banking Corporation Tax
Banking corporations in New York City, including commercial banks, savings banks, savings and loan associations, foreign banks, and bank holding companies are subject to the banking corporation tax. Of all the business income taxes, the banking corporation tax (BCT) has exhibited the largest swings as a percent of its total revenue from year to year. During the last decade, net BCT collections have increased by as much as 45 percent, or have fallen by as much as 50 percent, in any one fiscal year. These large fluctuations are due in part to the fact that a handful of the largest commercial banks account for up to a half of BCT liability in some years, making overall revenues largely dependent on the profitability of a small number of institutions. Furthermore, many of these and other banks make estimated payments with the expectation that their tax liabilities will ultimately be determined through audits. A very large proportion of BCT revenue in any single year comes from bank audits (28 percent of revenue, net of audit collections in 1996), adding another relatively unpredictable element.
With instability of this magnitude, it has been very difficult to predict with much certainty the ups and downs of the BCT. Using an econometric model and analysis of collections trends, IBO’s forecasts have been generated with the goal of predicting the total amount of BCT revenue over the financial plan period.
To date in the current fiscal year, BCT collections are 27 percent greater than in the comparable 1996 period, and the reported earnings of banks in calendar year 1996 suggest that tax liabilities for the year will be relatively high. Specifically, IBO projects BCT receipts will increase by 7.2 percent in 1997, to $387 million. For 1998, the forecast calls for a slight decrease in collections to $371 million, and then small increases for each subsequent year of the financial plan period, to a high of $395 million in 2001. The future of BCT revenues in the near future, however, is likely to be much less stable than these forecasts indicate.
| Figure 3-9. Net Revenue from Major Business Income Taxes (By fiscal year, in millions of dollars) | ||||||
| Actual | Forecast | |||||
| 1996 | 1997 | 1998 | 1999 | 2000 | 2001 | |
| General Corporation Tax | 1,209 | 1,409 | 1,163 | 1,196 | 1,226 | 1,272 |
| Unincorporated Business Tax | 495 | 528 | 562 | 607 | 653 | 689 |
| Banking Corporation Tax | 361 | 387 | 365 | 377 | 388 | 399 |
| Total | 2,064 | 2,323 | 2,089 | 2,179 | 2,268 | 2,359 |
| SOURCE: | Independent Budget Office. | NOTE: | Forecasts exclude audit receipts and do not reflect the anticipated revenue impact of the proposed tax reduction program presented in the Mayor’s preliminary budget. |
General Sales Tax
In New York City, purchases subject to the general sales tax include tangible personal property and services; gas, electricity and steam; restaurant food and beverages; hotel occupancies; some entertainment admission charges; and club dues. Purchases of food, rent, drugs, newspapers, and public transportation are generally exempt. The City tax rate is 4 percent, and, with a few exceptions, is applied in addition to New York State’s own 4 percent sales tax and the 0.25 percent sales tax of the Metropolitan Commuter Transportation District. While the City’s tax rate has been in effect since 1974, there have been many small changes in the definition of goods and services subject to the tax.
The general sales tax accounted for $2,713 million in fiscal year 1996, or 15.0 percent of all net tax revenues excluding audits. While sales tax revenue fell during the last recession, since 1993 it has increased by 3 to 5.6 percent annually. For the financial plan period, IBO anticipates continued growth of sales tax collections within this range—under the forecast scenario of moderate national and local economic expansion.
The projections of net general sales tax receipts are presented in Figure 3-10. Specifically, IBO forecasts general sales tax receipts to increase by 5 percent or
$136 million in 1997, to $2,849 million. Collections to date in this fiscal year have been strong, reflecting continued local economic expansion, the influx of tourists, and injections of spending into the local economy by recent record-high profits on Wall Street.
With the projected decline in securities industry profits, IBO expects sales tax revenue growth to moderate in the coming year. For 1998, IBO projects $2,955 million in receipts, a 3.7 percent increase over the previous year. For the out-years of the financial plan, the expected annual growth rate is 4.5 percent on average and net sales tax revenue is expected to equal $3,369 million by 2001.
To forecast general sales tax revenue, IBO considers the expected growth of personal income and retail sales, inflation, growth of leading sectors of the local economy, and seasonal factors. The time series of tax receipts analyzed and used in an econometric model was adjusted for changes in the tax base, such as the 1996 repeal of the tax on interior decorating services, and for one-shot events such as the one-week sales tax exemption for purchases of clothing under $500 that took place in January of 1997. The forecasts presented here do not reflect the anticipated revenue loss of the proposal in the Mayor’s preliminary budget to permanently eliminate the sales tax on such clothing.
| Figure 3-10. General Sales Tax Revenue through 2001 (By fiscal year, in millions of dollars) | ||||||
| Actual | Forecast | |||||
| 1996 | 1997 | 1998 | 1999 | 2000 | 2001 | |
| Net Revenue | 2,713 | 2,849 | 2,956 | 3,083 | 3,223 | 3,369 |
| SOURCE: | Independent Budget Office. | NOTE: | Forecasts do not reflect the impact of sales tax reductions proposed in the Mayor’s preliminary budget. |
Other Taxes and Tax Audits
Unlike the other independently constructed projections of revenues and expenditures in this report, IBO has based its projections of other taxes on estimates published in the Mayor’s preliminary budget. The largest of these other taxes are the utility and hotel occupancy taxes, though numerous smaller revenue streams, such as the vault and commercial vehicle taxes, are also included. Similarly, IBO uses OMB’s projections of revenue from tax audits and Department of Finance PEGs.12 For 1997, $665 million in audit revenue is forecast, and $677 million is expected for each of the remaining years in the forecast period. Almost 70 percent of the audit receipts are GCT and BCT payments, a significant addition to the forecasted amounts of net collections reported above.
For 1997, $1,512 million in other tax receipts and tax audit collections are expected, 11.4 percent more than in the previous year. Slower growth in 1998 is projected to yield $1,554 million in combined revenues. While the 1999 revenue projection is flat, combined revenues from these sources are expected to grow an average of 3.4 percent per year in the final years of the forecast period, generating $1,581 million in 2001.
Miscellaneous Revenues
New York City derives a significant share of its own-source receipts from so-called miscellaneous revenues, which consist of nearly 300 different non-tax revenue sources. Miscellaneous revenues include licenses, permits, franchises, service charges, water and sewer charges, rental income, interest, fines, forfeitures, and proceeds from asset sales and other non-recurring receipts. Together these sources are expected to provide $3,453 million in 1997.
IBO has reviewed the projections for many of the largest of these receipts for the 1998 to 2001 period. While there are many uncertainties as to the amount of revenue that can be expected and the timing of non-recurring payments, IBO has re-estimated only two major components of miscellaneous revenues. In these two cases, IBO believes that there is considerable risk both as to the size and the timing of these revenues.
The first is the rental income that the City can reasonably expect to receive from the Port Authority for LaGuardia and Kennedy airports. The City has questioned several aspects of how the Port Authority computes the airport revenues which serve as the basis for the Authority’s rental payment to the City.13 In dollar terms, one of the largest points of contention between the City and the Port Authority concerns the Authority’s portion of the revenue from a $3 airline ticket surcharge. The City contends that it should be considered part of airport income and thus should be included in the rent calculation.
Besides seeking a portion of future proceeds from the surcharge, the City asserts that it is entitled to a retroactive adjustment covering the years since the surcharge was first imposed. The Port Authority has rejected the City’s claims and the issue is now before a private arbitration panel. The General Counsel of the Federal Aviation Administration (FAA) has advised the arbitrators that the surcharge was intended to provide funds dedicated to airport improvements and should not be considered part of the general revenue stream generated by the airports.
Although the FAA General Counsel has indicated that his agency’s opinion is not binding on the arbitrators, IBO believes that there is significant uncertainty as to whether the City will receive a large retroactive adjustment for surcharge proceeds. Thus, airport rent payments are expected to total $40 million in 1997 and $70 million for each subsequent year. This is a $270 million downward adjustment for 1998 and $215 million for 1999.
In addition to re-estimating expected airport rents, IBO has removed the preliminary budget’s projection of $20 million per year for revenue from new collections initiatives beginning in 1998. This item refers to a long-delayed program to consolidate activities from various agencies within a single unit in the Department of Finance. Legislation in Albany needed to make the program fully effective has failed in each of the last three sessions, and there is little reason to believe the legislative outcome will change in the near future. Even if the legislation is ultimately enacted, IBO expects that it will take several years for its potential to be realized given the need to modify a number of computer systems.
With these re-estimates, IBO estimates that miscellaneous revenues will equal $3,453 million in 1997 and subsequently fall throughout the forecast period. By 2001, miscellaneous revenues are expected to total $2,223 million. This fall off in miscellaneous revenues in the last years of the financial plan is partially attributable to the non-recurring nature of many of the larger items in this group. For example, the 1998 forecast appears to include as much as $380 million in asset sales. The financial plan does not appear to contain any asset sales for the out years. It is entirely possible that additional assets will be identified for sale in later years which will bring miscellaneous revenues closer to their levels in the recent past.
Intergovernmental Grants and Aid
This category of revenue includes unrestricted intergovernmental aid, mostly in the form of state revenue sharing; private categorical grants; and federal and State categorical grants. Revenues in this area of the budget totaled $11.4 billion in 1997.
IBO’s baseline estimate follows OMB’s projections for unrestricted intergovernmental aid and other (private) categorical grants. These two categories account for slightly less than $1 billion per year during the forecast period.
There is substantial uncertainty facing the City regarding the amount of State and federal categorical grants received each year. State categorical grants, which totaled $6.29 billion in 1997, would increase to $6.35 billion in 1998 if adjusted by IBO’s deflator. Similarly, federal categorical grants, which totaled $4.16 billion in 1997, would increase to $4.21 billion.
Long-Term Revenue Issues
Revenue Structure and Policy
This chapter highlights a few of the critical structural factors underlying IBO’s revenue forecast for the next four years. A review of revenue budget trends and tax program impacts over the past several decades shows that New York City’s current and projected slow revenue growth is not simply the result of the City’s moderate recovery and expansion following the recent deep recession. Rather, it is the result of lagging tax revenue growth relative to the performance of the City economy.
New York City’s revenue growth has lagged its economic growth over most of the past two decades. Our analysis suggests that this structural lag has played a much larger role than changing tax policies in influencing the overall size of the City revenue burden and the mix of City revenue sources. In both respects, structural factors will continue to dominate tax programs in the coming years.
The overview concludes with a brief discussion of the policy implications of slow structural revenue growth. In the second half of the chapter, we take a closer look at New York City’s property tax—the single factor most responsible for the City’s weak tax revenue growth.
Sources of Funds Over Time
New York City draws about two-thirds of its $33 billion revenue budget for 1997 from local taxes, charges, and fees. The other third comes in the forms of grants and aid from the federal and State governments.
Almost all of this is categorical aid, meaning that it is tied to specific mandated program outlays (notably public assistance, education, and health). In addition, a relatively small share of intergovernmental aid—currently around $585 million, less than two percent of the total revenue budget—is unrestricted aid, funds that the City can use as it sees fit.
Most of the City’s local funds come from a handful of taxes: the real property tax ($7.1 billion in 1997); the personal income tax ($4.2 billion); the general sales and use tax ($2.9 billion); and the business income taxes (general corporation tax, banking corporation tax, and unincorporated business tax, total $2.8 billion). Together these taxes generate $17 billion, accounting for over three-quarters of all own-source City revenues, and over half of the entire revenue budget. Smaller but also significant local funding sources are water and sewer charges ($635 million in 1997), the commercial rent tax ($490 million), motor vehicle and parking fines ($425 million), real estate transaction taxes ($390 million), and utility taxes ($210 million).
Over the past ten years, New York City has shifted to rely less on property and sales taxes and more on personal and business income taxes as its major sources of revenue growth. This actually continues a trend that goes back at least four decades. Real property and general sales taxes generated over 60 percent of all City revenues in 1956; this share dropped to 49 percent in 1966, 36 percent in 1976, 33 percent in 1986, and 31 percent in 1996. There were no personal or business income taxes before 1967;14 these taxes accounted for under 12 percent of total revenues in 1976, over 16 percent in 1986, and 20 percent in 1996.
There are three other important differences between the pre-1976 (that is, pre-fiscal crisis) period and the post-1976 period:
Figure 4-1 shows how dramatically New York City has shifted from rising taxes and intergovernmental revenues as a share of personal income to falling taxes and intergovernmental revenues as a share of income. Because tax burdens here are still quite high relative to other major U.S. cities, New York City has not received very much credit for this turnaround. Nevertheless, the extent to which revenue growth has slowed and tax burdens have fallen in the City is striking. While the relatively slow revenue budget growth of the past twenty years has not entirely negated the effects of the very fast pre-1976 budget growth, it has made very significant inroads. The 1996 City tax burden of $8.33 per $100 personal income (PI) was just 5.7 percent higher than the 1966 burden of $7.90 and over 20 percent lower than the 1976 burden of $10.46.
Even more remarkable—and even less remarked—is the source of this sea change. As just noted, in the period when City tax revenues were rapidly growing as a share of personal income, this was almost entirely the result of a series of expansionary tax programs. Largely because of these tax programs, the long pre-1976 fiscal expansion included one-year increases of own-source revenues per $100 personal income (PI) of 7.8 percent in 1964, 9.1 percent in 1967, 11.7 percent in 1972, and 10.4 percent in 1975. The tax programs of the 1960s and early 1970s were the source of roughly 40 percent of the tax revenues the City collected in 1976.
In contrast, the largest one-year increase in own-source revenues per $100 PI during the 1980s was 1.4 percent in 1989, and the largest one-year increase since 1990 was 1.7 percent in 1991.15 None of the tax policy changes of the 1980s and 1990s have approached the scale of the pre-fiscal crisis era. Moreover, tax program increases over the past two decades have been largely matched by tax program reductions. Excluding the 1979 through 1982 stock transfer tax phase-out, City tax programs since 1978 have added, net, about $1.6 billion to the revenue budget, meaning that they are the source of less than 9 percent of the tax revenues the City currently collects. The cumulative cost of the stock transfer tax phase-out, however, has probably offset much of the net revenue additions from the other tax programs—or perhaps even more than offset them.16
It is thus clear that the striking decline in overall tax burdens over the past twenty years has not come from a simple reversal of the policies that produced the prior increases. What, then, explains this phenomenon? No more—and no less—than the continued domination of the City revenue mix by taxes which innately grow much more slowly than income in New York City.
| Figure 4-1. New York City Operating Budget Revenues Per $100 Personal Income, 1956 - 2001 | ||||||
| 1956 | 1966 | 1976 | 1986 | 1996 | 2001a | |
| Total Operating Revenues | 8.67 | 12.49 | 18.73 | 15.81 | 14.71 | 12.48 |
| Intergovernmental grants and aidb | 1.67 | 3.44 | 7.28 | 5.72 | 5.00 | 3.87 |
| Total own-source revenues | 7.01 | 9.05 | 11.45 | 10.09 | 9.71 | 8.60 |
| Total taxes | 6.09 | 7.90 | 10.46 | 8.84 | 8.31 | 7.75 |
| Real property tax | 4.03 | 4.76 | 5.23 | 3.63 | 3.26 | 2.87 |
| General sales tax | 1.23 | 1.34 | 1.45 | 1.51 | 1.26 | 1.26 |
| Personal income tax | n/a | n/a | 0.93 | 1.43 | 1.80 | 1.84 |
| Business income taxesc | 0.52 | 0.75 | 1.21 | 1.14 | 1.16 | 1.07 |
| Other taxes | 0.31 | 1.05 | 1.63 | 1.13 | 0.83 | 0.53 |
| Other own-source revenues | 0.92 | 1.15 | 0.99 | 1.25 | 1.41 | 0.83 |
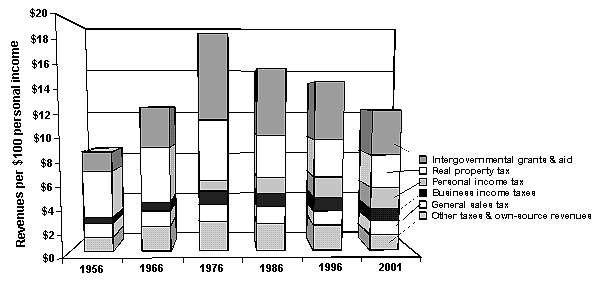
| SOURCE: | Independent Budget Office. | NOTES: | a. IBO forecast. b. Excludes grants covering outlays (Medicaid, SSI, and senior colleges) subsequently shifted to State budget. c. Prior to 1967, business and financial gross receipts taxes. |
Structure-Driven Tax Revenue Changes
To see how New York City’s tax system has responded to economic growth, we must look at the past and projected growth rates of City taxes with the effects of tax programs removed. This is shown in Figure 4-2a. Baseline taxes grew an average of 5.6 percent per year between 1981 and 1996, almost a full percentage point below the average growth in New York City personal income, 6.5 percent. This means that for every 1.00 percent growth in personal income, tax revenues grew only 0.85 percent. (Thus, in the shorthand of economists, the baseline growth elasticity of tax revenues was 0.85.17 See Figure 4-2b.) These tables also immediately show us which individual taxes are responsible for the overall baseline growth slowdown. These are the real property tax (average growth 4.6 percent, elasticity 0.71), the general sales tax (average growth 4.8 percent, elasticity 0.74), and—somewhat surprisingly—the general and banking corporation taxes (elasticities of 0.91 and 0.71, respectively). What kept overall baseline tax revenue growth from lagging even further was the robust performances of the personal income tax (average growth 8.0 percent, elasticity 1.22), the unincorporated business tax (growth 10.0 percent, elasticity 1.53) and the commercial rent tax (growth 7.8 percent, elasticity 1.19).
To indicate how dominant these innate structural forces have been, consider the 1990-94 period, when tax programs raised tax rates (mostly on the property tax and personal income tax) to make up revenue shortfalls brought on, or so it seemed, by the deep recession that followed the stock market crash. These tax programs, the most expansionary since 1976, raised revenues by $1.8 billion in 1994. This was more than twice as much as the $850 million lost as a direct result of the slowdown in personal income growth during the recession. At the same time, however, there was an additional loss of nearly $2 billion reflecting the fact that baseline revenues were falling sharply as a share of personal income. By 1994, the combined losses from these two factors—the recession and the trend revenue share decline—was $1 billion more than what the City recouped through its 1990-94 tax programs.18
The dominance of structural tax factors is also much in effect in the current period. The tax programs going into effect after 1994—primarily commercial rent tax cuts and a series of business income tax reductions—have lowered tax revenues by about $355 million in the current fiscal year, and are projected to cost around $733 million by 2001. At the same time, the continued slow growth in taxes relative to personal income since 1994 has lowered baseline taxes by some $1.17 billion in the current year, and is projected to lower taxes by almost $2.3 billion by 2001. Even if all the additional tax cuts proposed in the preliminary budget were enacted, the total tax program-driven reduction as of 2001 would still be barely half of the structure-driven baseline tax revenue reduction over the same period.
| Figure 4-2a. Average Annual Growth Rate of Baseline Tax Revenues, 1981 - 2001 | ||||||
| 1981-86 | 1986-91 | 1991-96 | 1996-01 | 1981-96 | 1981-01a | |
| Personal Income | 8.47% | 6.77% | 4.41% | 4.27% | 6.54% | 5.97% |
| Total baseline taxesb | 8.66 | 6.43 | 1.77 | 3.32 | 5.58 | 5.01 |
| Real property tax | 6.88 | 8.55 | -1.29 | 2.06 | 4.62 | 3.97 |
| Total non-property taxes | 10.03 | 4.83 | 4.08 | 4.11 | 6.28 | 5.73 |
| General sales tax | 7.82 | 3.91 | 2.76 | 4.73 | 4.81 | 4.79 |
| Personal income tax | 12.51 | 7.19 | 4.34 | 4.71 | 7.96 | 7.14 |
| General corporation tax | 9.10 | 2.48 | 6.43 | 3.49 | 5.97 | 5.35 |
| Banking corporation tax | -3.28 | 4.37 | 13.50 | 2.44 | 4.64 | 4.09 |
| Unincorporated business tax | 14.54 | 9.58 | 6.11 | 4.82 | 10.02 | 8.70 |
| Commercial rent tax | 14.85 | 9.24 | -0.29 | 3.81 | 7.75 | 6.75 |
| Other taxes | 12.86 | -1.67 | 2.75 | 1.42 | 5.88 | 7.35 |
| Figure 4-2b. Growth Elasticities of Baseline Tax Revenues, 1981 - 2001c | ||||||
| 1981-86 | 1986-91 | 1991-96 | 1996-01 | 1981-96 | 1981-01a | |
| Total baseline taxesb | 1.02 | 0.95 | 0.40 | 0.78 | 0.85 | 0.84 |
| Real property tax | 0.81 | 1.26 | -0.29 | 0.48 | 0.71 | 0.67 |
| Total non-property taxes | 1.18 | 0.71 | 0.93 | 0.96 | 0.96 | 0.96 |
| General sales tax | 0.92 | 0.58 | 0.63 | 1.11 | 0.74 | 0.80 |
| Personal income tax | 1.48 | 1.06 | 0.98 | 1.10 | 1.22 | 1.20 |
| General corporation tax | 1.07 | 0.37 | 1.46 | 0.82 | 0.91 | 0.90 |
| Banking corporation tax | -0.39 | 0.65 | 3.06 | 0.57 | 0.71 | 0.68 |
| Unincorporated business tax | 1.72 | 1.42 | 1.38 | 1.13 | 1.53 | 1.46 |
| Commercial rent tax | 1.75 | 1.37 | -0.07 | 0.89 | 1.19 | 1.13 |
| Other taxes | 1.52 | -0.25 | 0.62 | 0.33 | 0.90 | 1.23 |
| SOURCES: | Independent Budget Office; NYC Comprehensive Annual Financial Report for the Comptroller, Fiscal Years 1981-1996. | NOTES: | a. IBO forecast. b. Exclusive of stock transfer tax c. Elasticity measures the percentage growth in revenues for each percent growth in income. See note in text. |
Explanations for Slow Baseline Growth
Administrators of government finance systems have long recognized that individual taxes have different innate growth capacities, and that the overall growth capacity of a revenue system depends on the mix of taxes in that system. For example, personal income tax revenues typically grow faster than personal income (revenue elasticities are greater than 1.00), both because over time income growth tends to push payers into higher tax brackets19 and because a large share of the growth takes place among households that are already in high tax brackets. This has been especially true lately in New York City, where a large and rising share of overall personal income growth has come from high-salaried executives and professionals on Wall Street.
Unlike personal income taxes, sales tax revenues sometimes grow more slowly than income—that is, sales tax elasticities sometimes fall below 1.00. But New York City’s sales tax elasticity of 0.74 since 1981—and only 0.60 since 1986—is particularly low; it means that baseline sales tax revenues have been growing at barely three-fifths the rate of personal income over the past decade. This could partly be explained by New York City’s much-discussed widening "retail gap" with its suburbs. Another possible explanation is that the average inflation rate for consumer goods and services subject to the sales tax has been somewhat lower than the overall inflation rate in the New York area, thereby reducing the share of City household income spent on taxable items.
It is frequently argued that sales tax revenue growth has lagged because of the increasing share of economic activity devoted to services, a development not contemplated by the designers of sales taxes. But it should be kept in mind that a substantial amount of services are taxed in New York City, and that these are responsible, along with utilities, manufacturing, and wholesale trade, for more than half of the City’s sales tax receipts.
The relatively low structural growth of the property tax should be the least puzzling element in the weak structural growth story. After all, property taxes everywhere are notorious for their low elasticities. But with actual and forecast baseline growth averaging only two-thirds the growth rate of personal income since 1980, New York City’s property tax has been particularly sluggish. Moreover, New York City property taxes are very unlike property taxes elsewhere precisely with respect to those characteristics that usually contribute to low revenue growth.
Slow growth property tax growth is typically attributed the fact that assessments are infrequently adjusted. In many jurisdictions the assessed values that form the base of the tax may be literally decades out of date. These jurisdictions generally compensate for outdated and low assessments with frequent increases in tax rates.
In contrast, properties in New York City are reassessed annually. This means that, in principle, our property tax revenue growth should be able to keep up with personal income without repeated rate adjustments, as long as underlying market value growth keeps pace with overall income growth. In the short run, we would not expect such a correspondence: property taxes are based on wealth (market value) rather than current income and therefore should not be expected to respond to short term changes in the level of income or overall economic activity. However, given that the market value represents the capitalized value of the future income earned from a property, there should be a stronger relationship between values and income over the long run.
In fact, market values in New York City have actually grown more than personal income over the past two decades. Despite this, property tax revenues today are $2.3 billion lower than they would have been if baseline revenue growth had merely matched income growth since 1982. How the City’s property tax system could have yielded such a low rate of revenue growth, despite annual assessments and rising market values, will be the special topic of the following section.
Implications for Policy
For two decades, relatively slow or inelastic structural revenue growth in New York City has been the principal means of reducing tax burdens that were and still are high compared with other localities. Along with this undeniable benefit, however, the inelastic revenue structure imposes a number of constraints on policy that have important implications for the City’s efforts to bring its budget into long-term balance. As a consequence of inelastic structural growth:
Persistent structure-driven declines leave lawmakers little discretion to cut taxes when times are good and budgets are in surplus, and to hold off cuts when times are bad and budgets are strained.
If overall baseline tax growth was more robust, there would be a that much greater margin for targeting tax cuts—for example, to make the City a more competitive location for business or to decrease the tax burden on low income New Yorkers.
Finally, while we have been discussing the repercussions of slow-growing taxes, the gradual structural shift of the City’s tax mix towards personal and business income presents its own set of challenges for fiscal policy. For while these taxes are more elastic than property and sales taxes, they are also more volatile, exhibiting relatively large annual fluctuations around the long-term trend
Since reducing exposure to volatility by cutting income taxes also has the effect of (further) slowing the overall baseline revenue growth rate, the alternative of setting aside larger reserves may present less of a budget balance and sustaining adequate levels of essential City services.
Residential Property Tax Gap
In the preceding section, we saw that baseline property tax revenue in 1997 is $2.3 billion lower than it would have been had it grown at the same rate as personal income over the past fifteen years—a period when market values have actually increased more than income. Preliminary results from a forthcoming IBO study indicate that part of the explanation for the "gap" lies in the City’s property tax system itself. IBO estimates that limits built into the current system’s taxation of residential property have reduced potential tax revenues by $750 million. This lost revenue is attributable to provisions in the Real Property Tax Law which 1) act to limit the growth in property assessments for one, two, and three family homes, as well as rental apartment buildings with fewer than ten units, and 2) force the City to assign artificially low assessed values to cooperatives and condominiums.20
Over time, these provisions have constrained the growth in assessed values for these types of properties to such an extent that by 1997, their total assessments are only two-thirds of what they would have been without the limits. The estimated $11.1 billion in "lost" assessed value is equal to 50 percent of the "official" taxable assessed value for these properties. It is this assessment gap which accounts for the $750 million in potential tax revenues cited above.21
To be sure, this cumulative revenue "gap" has contributed to a decline in overall City tax burdens (measured as a percentage of personal income) which had been, and still are, very high. But the reduction wrought by the property tax system has been very uneven. Because the City’s property tax system attempts to compensate for lost assessed value by shifting burdens and raising the overall tax rate for all property owners, the relative share of the property tax burden borne by commercial and rental apartment buildings has increased, even as the overall burden (measured as a percentage of personal income) has fallen. Thus, businesses, who still carry some of the highest property and total business tax burdens in the country, and residential renters, who indirectly bear much higher property tax burdens (relative to household income) than do their wealthier home-owning counterparts in New York City, have received little benefit from the reduction.
A Quick History
The basic structure of the City’s property tax system was created by a 1981 law which took effect for the 1983 fiscal year. The 1981 law, usually known as S-7000A, was not intended to lower tax bills. Its passage was the culmination of several years of studies, commissions, and hearings in the wake of a New York State Court of Appeals decision which would have forced the City to comply with existing state law and use a full market value standard for assessments. Moving to full valuation would have significantly increased tax burdens for single family homeowners since—contrary to existing law—their assessed values had been allowed to slip to a much smaller percentage of their full market values than the percentage prevailing for apartment buildings and commercial property.
To overcome this problem, S-7000A assigned the properties in the City to four classes.22 The new law codified the existence of less than full market valuation and the wide variations in the actual level of assessments, substituting a requirement that each tax class have a uniform standard assessment ratio (assessed value divided different tax classes, S-7000A established a complex system designed to limit the shifting of tax burdens between them.24
Assessment Caps
A primary feature of S-7000A was a cap or limit on assessment increases for one-, two-, and three-family houses (Tax Class 1). Under the cap, assessment increases from one year to the next are limited to no more than 6 percent, and no more than 20 percent in five years, even if the market value of the property has gone up by a greater percentage.25 IBO estimates that this limit has constrained cumulative assessment growth for one-, two-, and three-family homes since 1982 to 37 percent while median home prices were increasing by 176 percent. This has contributed $1.4 billion to the assessment gap in 1997.
Assessment caps, particularly on residential property, are not an unusual feature in property tax systems. Given the susceptibility of market values to speculative cycles, it is reasonable public policy to attempt to moderate their effects when establishing the taxable base (assessed value) for the property tax.26 Tax increases due solely to accelerating home values, which may not be correlated with an increase in income or ability to pay the tax, are undesirable. A cap on assessment increases is an effective, albeit blunt, means of accomplishing this. However, an assessment cap has several shortcomings as a tool for dampening the swings in the assessment base.
First, the cap may turn out to have been set at a level which is too low—that is, below the long-term trend in the ability to bear the increased tax burden. In New York City, nominal personal income has increased by an average of 6.3 percent per year between 1983 and 1997. Over the same period, median sales prices of one, two, and three family homes increased by an average of 8.2 percent annually. However the average annual increase in assessed value for such properties has been limited to only 3.6 percent over the fifteen year period. Thus, although market value increases outstripped gains in personal income (which supports the need for some mechanism to protect homeowners from "artificial" increases in their assessed value), the current system has held assessment increases to less than 60 percent of the annual increase in personal income. Even if we look at the period 1983 to 1990—when incomes and property values were rising at a brisker pace than they are in the 1990s—sales prices grew by 18.2 percent, personal income by 7.7 percent, and assessed value by only 2.6 percent per year.
A second problem with assessment caps is their cumulative nature. The difference between the capped assessment and what the assessed value would have been without the cap starts out relatively small but grows over time when market values are going up. When market values are falling the gap narrows, but because the decreases in down periods are usually smaller than the increases in up periods (due to the long-term upward trend in prices), the gap will not be eliminated, barring an unprecedented collapse in the housing market.27 Figure 4-3 traces the fluctuation in the gap for one, two, and three family assessments in the City for the years since S-7000A took effect. After showing virtually no effect in 1983 and 1984, the gap began to grow quickly. While at its widest in 1991, it has remained substantial in the more recent years of flat and falling market values. Much of the gap should be viewed as assessed value which has been permanently lost from the tax base.
| Figure 4-3. Class 1 Assessed Value Gap, 1985 - 1997 |
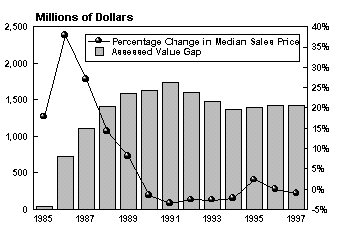 |
| SOURCE: Independent Budget Office. |
A third problem with assessment caps is the inequities created when they apply to only one type of property, thus shifting tax burden to non-protected classes. The City’s class share system—which limits inter-class shifts of tax burden—helps to minimize this problem with caps, at least for one, two, and three family homes. Since all of Class 1 enjoys the benefit of the cap, and the classes’ share of total tax burden is not affected by the cap, there is no shifting.
However, in the case of small apartment buildings, which have gradually been given the protection of assessment caps (see below), there has been a shifting of burden from the smaller to the larger buildings within Class 2. The total tax burden on Tax Class 2 (the class share) is the same regardless of the presence of capped properties. However, because some parcels in the class are capped and hence have lower assessment ratios than they otherwise would have, while others are not capped, effective tax rates (taxes divided by market value) differ within the class.
Beginning in 1985, rental buildings with four to six units had their assessment increases capped at 8 percent for one year and 30 percent over five years. Many of these buildings are operated by a landlord living in one unit and renting the others. There is often little difference in terms of scale of operation and costs of ownership between four to six unit buildings and the three unit buildings in Class 1. Market values for these properties followed a pattern similar to that of Class 1 values with very sharp increases through 1989, followed by relatively smaller declines and then modest increases in the 1990s. Overall, their median market sales prices have grown by 184 percent since 1985, while the cap on assessment increases has limited the increase in median assessed value to 102 percent over the same years. IBO estimates that by 1997, the assessment growth lost to these caps is $644 million or 41 percent of the current nominal assessed value for these properties.
In the 1988 fiscal year, the caps were extended to cover seven to ten unit rental buildings. Because the shift of these buildings occurred later in the market cycle, the amount of growth lost has been less. IBO estimates that assessed values on these parcels would have been $266 million higher. In 1994, cooperatives and condominium buildings with ten or fewer units were added to the capped population. Although their caps have only recently taken effect and market values have shown only modest increases in the intervening years, IBO estimates that there is already a $5 million assessment gap.
In 1991, small, predominately residential, mixed-use buildings with three or fewer units were shifted from Class 4 to Class 1 and hence began to enjoy the benefits of the Class 1 assessment caps. This type of building is fairly common on older retail streets in the City, with a store on the ground floor and apartments above. Although these so-called "mom and pop" buildings were shifted during a period when market values where generally falling or flat, a modest gap has begun to develop in this category as well. IBO estimates that as of 1997, over $7 million in potential assessed value has been lost on these properties due to the caps.
In total, the cumulative effect of the assessment caps by 1997 is a loss of $2.3 billion in taxable assessed value, assuming that assessments had been allowed to increase at the same rate as market values.
Limits on Assessed Value of Coops and Condos
Coops and condominiums with more than ten units do not benefit from caps on assessment increases. However, they have an even wider assessment gap than the capped properties thanks to a provision of the Real Property Tax Law which compels the city to undervalue them. Section 581 of the law prohibits assessors from using sales or potential sales prices when valuing cooperative and condominium buildings. Instead, assessors are forced to value such buildings as if they were rental buildings. To do so, an assessor looks for a comparable rental building based on age, size, condition, and other such factors. In the case of cooperatives, which tend to be older buildings, the most likely comparable buildings are rent-regulated, with rents that are significantly lower than what somebody would have to pay to rent the units in the cooperative being valued. In such a case, the building’s "official" assessed value will be lower than if it were valued using the income potential of its own units. Even for condominiums, which are often newer and therefore more appropriately compared with non-rent regulated buildings, this process often yields an "official" value below the income potential of its own units, although the disparity is not as great as for cooperatives.
There is an even larger assessment gap when we compare the "official" value of cooperatives and condominiums assessed under Section 581 with a value based on the estimated sales prices. The Department of Finance has estimated that Citywide, sales-based market values of cooperatives would be 2.7 times higher than the market values its assessors currently derive under Section 581; for condominiums it would 2.1 times higher.28
Moreover, the degree of under-assessment varies significantly, with the widest differences occurring in the prime cooperative and condominium neighborhoods of Manhattan. This is because in these neighborhoods, with high sales prices for apartments, the comparable rent-regulated rents have the greatest discounts compared to market rate rents. IBO’s analysis of sales-based market values for the portion of Manhattan which includes these neighborhoods yields values that are three times higher than the "official" 581-constrained values set by Finance’s assessors.29
IBO estimates that if cooperatives and condominiums were valued using a sales-based approach rather than Section 581, an additional $8.8 billion in assessed value would have been added to the 1997 assessment roll.30 This is nearly double the $10.3 billion current "official" assessment for such buildings.
Advocates for cooperative and condominium owners maintain that a more appropriate comparison is how they would fare if they were treated like Class 1 properties. IBO estimates that if such buildings were valued using a sales based approach and Tax Class 1 assessment ratios, their assessed values would be lowered by 57 percent to $5.9 billion.31
In conclusion, these preliminary findings indicate that a significant portion of the property tax revenue shortfall can be attributed to features of the property tax system which act to limit the growth in assessed value of residential property. A more precise estimate of the magnitude of the revenues lost, after accounting for the interactions within the system, will be included in the IBO’s forthcoming study.
In this chapter, we present our current services baseline projections for all City spending through 2001. A summary of our forecast is shown below in Figure 5-1.
As noted in Chapter 1, IBO’s current services baseline is designed to project the cost of current expenditures into the future. It is not a prediction of future budget negotiations, nor is it a recommended course of action. Instead, it is largely a mechanical computation showing what existing policies would cost if allowed to run their course over the financial plan period. Such an approach commits no one to any particular policy, nor does it constrain the available choices. It is a frame of reference and a benchmark against which to assess the choices facing decision-makers.
We have grouped spending estimates into one of two categories for purposes of developing this baseline.
Discretionary spending. For programs primarily dependent on the level of annual appropriations provided by the City, we projected future costs by adjusting current spending levels for expected changes in the cost of goods and services in New York City. Most City agencies and programs fall into this broad category. Personal services (salaries and wages) were estimated based on current funding levels with future adjustments based on scheduled collective bargaining increases. For other than personal services, a growth adjustment based on the local government price index, ranging from 2.5 percent to 2.8 percent annually, was applied.
Non-discretionary spending. The costs of programs driven principally by factors beyond the immediate control of the City, such as public assistance caseloads, were estimated based on IBO’s projections of future costs.
As illustrated below, estimated total spending increases, on average, about 2.9 percent each year.
| Figure 5-1. Current Services Baseline Spending (By fiscal year, in millions of dollars) | |
| 1997 | 33,522 |
| 1998 | 33,728 |
| 1999 | 35,511 |
| 2000 | 36,719 |
| 2001 | 37,529 |
| SOURCE: | Independent Budget Office. |
| NOTE: | All expenditures are net of intra-city and inter-fund agreements. |
In general salary and wage increases account for much of the out-year increases in expenditures due to existing and expected collective bargaining agreements. Welfare, Medicaid, and debt service costs also have significant implications for future City spending levels.
New Welfare Law
One of the greatest challenges facing City policy makers in the years ahead is the impact of recent changes in welfare programs. Last summer’s enactment of The Personal Responsibility and Work Opportunity Reconciliation Act of 1996 (PRA) represents the most radical change in the nation’s welfare system in the last sixty years. Among the changes mandated by PRA are provisions to: replace Aid to Families with Dependent Children (AFDC) with a Temporary Assistance for Need Families (TANF) state block grant; impose a five year lifetime limit on families receiving cash benefits; mandate increasingly ambitious work quotas for adult family heads; provide increased child care funding; restrict eligibility of children for Supplemental Security Income (SSI); and limit benefits for legal aliens.32 Although the PRA has not been fully implemented in New York State, it guarantees major changes in the cash assistance programs for low income City residents and greater uncertainty about how these programs will be funded.
Implementation in New York State
The PRA transforms a federally controlled welfare system into one in which the states are the main policy makers. This transfer of responsibility from the federal government to states involves two broad steps. The first is the development of an overall welfare plan by the appropriate executive officials of each state and its approval by the U.S. Department of Health and Human Services. Subsequently, each branch of the State Legislature must approve any changes in State law that are required to fully implement the plan.
On October 16, 1996, the Governor formally submitted New York State’s welfare plan to the federal government. As with other states, New York’s plan included only a very broad outline of a revised family assistance program and a pledge to comply with various requirements of the federal law. Its quick approval by federal officials guaranteed that New York State will receive its full share of the TANF block grant for federal fiscal year 1997.
The second step in State implementation of the new federal welfare law has not yet been completed. This phase involves the development of a more detailed plan for the State’s new welfare system and its approval by the legislature. On November 13th, the Governor released some preliminary details of a proposal to radically revamp the welfare system throughout the State.
The Governor’s plan can be viewed as an attempt to achieve two broad goals. The first is to reduce the size of the welfare system through gradual grant reductions, reduced eligibility for cash assistance, increased earned income disregards to encourage work, and more stringent work requirements for employable adult recipients. At the same time the plan attempts to satisfy Article XVII, Section 1 of the New York State constitution which requires the State and localities to provide for "the aid, care and support of the needy."
While many details of the Governor’s legislative plan have not yet been revealed the main provisions can be identified.
Baseline Projections
The announcement of the Governor’s welfare plan is the opening step in a long process of revamping New York State’s complex welfare laws. The ultimate form of these revisions will be the product of political compromises among the Governor, the Senate and the Assembly. Therefore, it is not possible to predict with certainty what the new welfare system will look like.
This high degree of uncertainty makes it necessary to make assumptions about the emerging system in order to project future caseloads and expenditures.
Based on these assumptions, we have projected caseloads for TANF and HR through 2001 as shown in Figure 5-2.
| Figure 5-2. Public Assistance Caseloads |
 |
| SOURCE: Independent Budget Office, HRA Monthly Caseload Reports. |
Caseloads. Prior to 1995, City public assistance caseloads were driven primarily by local economic changes; caseloads fell during the relatively prosperous years of the mid to late 1980s and rose during the economic downturn of the early 1990s. The implementation of the New York City Work, Accountability, and You program (NYC WAY) in 1995—incorporating fraud detection and work programs for public assistance recipients—generated rapidly declining caseloads. The City intends to continue NYC WAY indefinitely, meaning that the program may continue to inhibit caseload size throughout the financial plan period. The implementation of the PRA by New York State can be expected to bring about another distinct period in the recent history of public assistance programs in the City. While certain provisions of the new law such as the increasing work quotas can be expected to amplify the downward trend in the AFDC (now TANF) caseload, the new restrictions on the eligibility of most legal aliens for federal assistance programs will likely add tens of thousands of persons to the HR rolls.
TANF. Taking all of these factors into account, we expect that the number of TANF recipients will drop from 750,000 in December 1996 to 732,000 in June 1997. After this, the decrease will gradually slow, generating a caseload of 709,000 in June 1998, 690,000 in June 1999, 687,000 in June 2000 and 684,000 in June 2001. The inhibiting impact of fraud detection and work programs can be expected to decrease as the programmatic changes result in a caseload that is increasingly composed of individuals who are particularly needy and difficult to place in private employment.
Home Relief. The projected pattern for the HR caseload is quite different, falling from 191,000 in December 1996 to 176,000 in June 1997, but then rising to 203,000 in June 1998, 207,000 in June 1999, 209,000 in June 2000 and 212,000 in June 2001. In the case of HR, the inhibiting effects of NYC Way will be more than offset by the implementation of the PRA. Next autumn will be the most critical implementation period. The PRA requires that most legal aliens be dropped from SSI by August 22, 1997. State officials indicate that in New York this will probably happen all at once, during the month of August. The vast majority of affected individuals will be eligible for HR. Allowing for processing time and some lags in applying for the new program, we estimate that this provision will create 23,000 new HR recipients in October, with this figure rising to 45,000 in January 1998. The PRA provision denying TANF and SSI to new aliens is also expected to increase HR caseload.
Expenditures. Figure 5-3 displays our expenditure projections to support the expected caseloads for both HR and TANF. Also displayed are the projected costs for new workfare and child care programs required to implement the PRA. The workfare and child care costs were estimated for two scenarios, resulting from the uncertainty of whether or not the two year work rule for adult TANF recipients is enforced. (In addition to gradually increasing work quotas, the PRA contains a provision that requires all adult TANF recipients to begin work by the end of their second year on assistance.) The numbers indicate that implementation of the two year rule would add significantly to City expenditures.33 While it remains unclear whether the two year rule will be implemented, IBO’s baseline projection assumes that it is not enforced.
| Figure 5-3. Public Assistance Forecast (By fiscal year, in millions of dollars) | ||||||
| Actual | Forecast | |||||
| 1996 | 1997 | 1998 | 1999 | 2000 | 2001 | |
| HOME RELIEF | ||||||
| Persons on assistance | 228,469 | 191,367 | 195,917 | 205,167 | 208,083 | 210,750 |
| Net cost of grants | ||||||
| City | 347 | 279 | 283 | 296 | 301 | 305 |
| State | 331 | 279 | 283 | 296 | 301 | 305 |
| Total | 678 | 559 | 567 | 592 | 602 | 610 |
| TANF | ||||||
| Persons on assistance | 826,466 | 756.046 | 719,750 | 699,833 | 688,583 | 685,667 |
| Net cost of grants | ||||||
| City | 443 | 374 | 273 | 270 | 264 | 262 |
| State | 432 | 377 | 351 | 348 | 342 | 340 |
| Federal | 871 | 826 | 858 | 817 | 806 | 802 |
| Total | 1,746 | 1,577 | 1,481 | 1,436 | 1,411 | 1,405 |
| ADDITIONAL COSTS | ||||||
| Without 2 Year Work Rule | ||||||
| Cost of new workers | 0 | 45 | 45 | 44 | 58 | 85 |
| New child care costs | ||||||
| Total child care costs | 0 | 48 | 39 | 35 | 58 | 98 |
| New federal funding | 0 | -24 | -36 | -41 | -50 | -60 |
| New costs to City | 0 | 24 | 3 | -6 | 8 | 38 |
| With 2 Year Work Rule | ||||||
| Cost of new workers | 0 | 46 | 45 | 254 | 406 | 441 |
| New child care costs | ||||||
| Total child care costs | 0 | 48 | 39 | 347 | 571 | 624 |
| New federal funding | 0 | -24 | -36 | -41 | -50 | -60 |
| New costs to City | 0 | 24 | 3 | 306 | 521 | 564 |
| SOURCE: | Independent Budget Office. | NOTES: | Numbers may not total due to rounding. |
Medicaid
The majority of New York State’s expenditures on the Medicaid program are incurred in New York City. In 1996, over $13.7 billion, or 66 percent of the State total, was spent on Medicaid in the City.
In New York State, the federal, State, and local governments divide Medicaid costs. Most Medicaid payments are made by the State, and local districts reimburse the State for their share. Consequently, the City generally budgets only tax levy dollars for Medicaid services provided within its boundaries.
Medicaid expenditures have risen dramatically over the last decade. In 1987, the City’s Human Resources Administration (HRA), which has primary responsibility for Medicaid programs, spent $1,013 million of City tax levy dollars for medical services to Medicaid eligible recipients. This figure more than doubled to $2,034 million in 1996.
Several factors have contributed to this dramatic increase in recent years: expensive technology and treatments have increased health care costs; federal legislation in the 1980s put pressure on states to increase reimbursement rates and expand coverage to new populations; and the economic recession of the early 1990s generated new demand for Medicaid services, as did the AIDS epidemic and the growth of the elderly population.
In recent years, City and State officials have increased efforts to contain Medicaid costs. One such effort has been the implementation of Medicaid managed care, an alternative financing mechanism which replaces the traditional fee-for service system with capitated rates. Following a period of rapid expansion, enrollment in managed care plans has slowed during the last year. Other cost containment initiatives have included greater use of outpatient services and limits on hospital rate increases. Growth in personal care services has been inhibited by the development of new management techniques including cluster care, the personal emergency response systems (PERS), and task based assessment. Finally, as welfare reform decreases the City’s public assistance caseload, it also reduces the pool of Medicaid eligibles thereby cutting costs.
Overall, IBO estimates that growth in Medicaid expenditures will average 4.2 percent for each year of the financial plan. Expenditures will grow by 2.2 percent in 1997, 5.3 percent in 1998, 4.5 percent in 1999, 4.6 percent in 2000, and 4.5 percent in 2001. Resulting City tax levy expenditures will total $2,079 million in 1997 and grow to about $2,500 million by 2001 (see Figure 5-4). These estimates reflect the expectation that continued cost containment measures will prevent growth rates from reaching the double digits of prior years.
| Figure 5-4. HRA Medicaid Costs (By fiscal year, in millions of dollars) | |
| 1996 | 2,034 |
| 1997 | 2,079 |
| 1998 | 2,189 |
| 1999 | 2,287 |
| 2000 | 2,393 |
| 2001 | 2,500 |
| SOURCES: | Independent Budget Office; NYC Comprehensive Annual Financial Report for the Comptroller, FY 1996. |
Two decisions which elected officials will make during the next few months may change these estimates. Acceptance by the State Legislature of the Governor’s Medicaid cost containment proposals could generate reductions of over $200 million annually from 1998 to 2001. Also, the approval by the U.S. Health Care Financing Administration of the State’s waiver application could achieve significant savings by permitting the State to mandate the enrollment of most Medicaid recipients into managed care plans.
City Spending Since 1987
Total Expenditures.34 As illustrated in Figure 5-5 total expenditures supported by all funds increased from $21.4 billion in 1987 to $32.1 billion in 1996, an increase of $10.7 billion or 50 percent.35 While the overall level of expenditures has grown, the annual rate of growth has decreased. From 1987 to 1992, overall expenditures increased at an annual rate of between 5 and 9 percent. From 1993 through 1996, the annual growth rate was between 1 and 4 percent. In real (adjusted for inflation) terms, however, total expenditures increased from 1987 to 1994, but then declined in both 1995 and 1996.
City-funded expenditures grew steadily between 1987 and 1994, from $15.0 billion to $21.5 billion. City-funded expenditures declined to $21.1 billion in 1995, and then rose slightly to $21.8 billion in 1996. In real terms, City-funded expenditures grew 9 percent from 1987 to 1994, followed by a net drop of 3 percent from 1994 to 1996.
The portion of total expenditures supported by City revenue sources declined slightly over the last ten years. In 1987, City revenue sources funded 70 percent of total spending, compared to 68 percent in 1996. Conversely, funding by the State and federal governments as a percentage of total expenditures increased from 30 to 32 percent over the same period.
| Figure 5-5. City Expenditures, 1987 - 1996 |
 |
| SOURCES: Independent Budget Office, NYC Comprehensive Annual Financial Report of the Comptroller, FY 1987-1996. |
Resource Allocation. Figure 5-6 illustrates that the overall allocation of resources across major programmatic categories in 1996 was similar to that in 1987. The major upward changes in percentage share were in the areas of education, which gained 1.9 percentage points, along with public safety/judicial and social services, each of which gained 1.6 percentage points. Special education costs contributed to the increase in total education spending. Public safety/judicial expenditures were largely driven by an increase in law enforcement personnel pursuant to the Safe Streets, Safe City program. The increase in social service expenditures was mainly attributable to rising public and medical assistance rolls, as well as an increase in HIV-related cases. Pensions was the only category with a large decrease in percentage share of total expenditures from 1987 to 1996. This decrease represented a decline of nearly half or 3.6 percentage points of its share of expenditures. This was primarily due to the impact of asset earnings resulting from favorable investment returns.
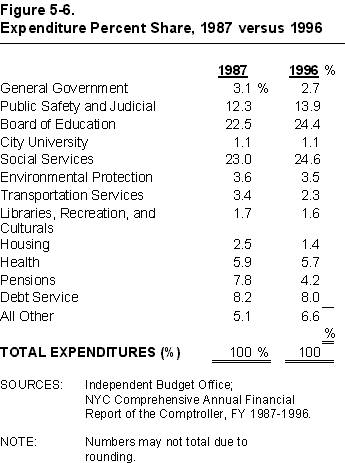
Workforce Trends. Figure 5-7 shows that the City’s total workforce (adjusted to reflect the mergers of the Housing Authority and Transit Authority police into the New York City Police Department, and the Emergency Medical Service into the Fire Department) increased by a net of 970 workers or less than 1 percent, from 234,099 in 1987 to 235,069 in 1996. City funded positions, however, decreased by a net of 6 percent during this period. The net decline in City-funded headcount from 1987 to 1996 has been mitigated in some cases by productivity increases and the use of participants in the Work Experience Program.
A closer look at Figure 5-7 reveals that both total and City-funded headcount increased from 1987 to 1991, by 8 percent and 6 percent, respectively. However, from 1991 to 1996, there was a net decline in total and City-funded headcount of 7 percent and 11 percent, respectively.
| Figure 5-7. Headcount Trends, 1987 - 1996 |
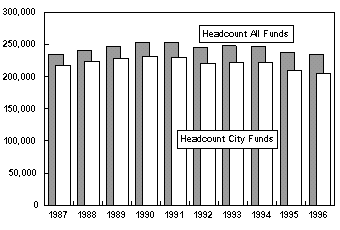 |
| SOURCES: Independent Budget Office, Office of Management and Budget. |
Debt Limit, Debt Service, and the Capital Budget
Proximity to the Debt Limit and Creation of the Transitional Finance Authority
IBO assumes OMB’s projections of debt service in the City's financial plan which assume creation of the New York City Transitional Finance Authority (the Authority) to permit the continuation of the City's long-term capital program. Continuation of the capital program, however, requires State legislative action in view of the City's close proximity to the constitutional debt limit.
New York City, like all local governments in New York State, is subject to this constitutional limitation on its general obligation indebtedness.36 The State Constitution prohibits the City from contracting indebtedness, including contracts for capital projects to be paid with the proceeds of City bonds, in an amount greater than ten percent of the average full value of taxable real estate in the City for the most recent five years.
In the January 17, 1997 Official Statement for the City's recent bond issue, the City calculates that it has approximately $580 million of remaining bond capacity under the debt limit.37 Further, indebtedness necessary to finance the planned capital program is likely to exceed the debt limit by the end of 1997, with the total plan expected to cost about $6 billion more than the limit through 2000. In the absence of State legislative action, the City is likely to suspend, by the end of 1997, implementation of that portion of its capital program financed by general obligation debt.38 The chart below shows the relationship between the projected debt limit and amounts necessary to finance the capital program during the financial plan period.
| Figure 5-8. Debt Limit and the Capital Program | |
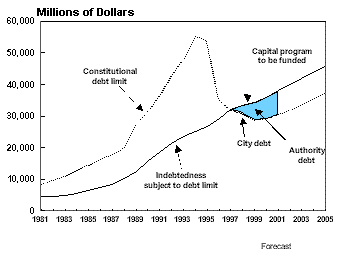 | |
| SOURCES: | NYC Comprehensive Annual Financial Report of the Comptroller, FY 1980-1996; Office of Management and Budget. |
| NOTE: | The proposed legislation would permit the Authority to issue up to $7.5 billion of bonds, a limit which the Authority is estimated to reach during the 1998-2001 financial plan period. |
From the early 1980s, the City had a significant amount of room under the debt limit. While the limit grew from $8.3 billion in 1981 to a peak of $55.4 billion in 1994, the City's outstanding debt grew during this period from $4.6 billion (55 percent of the limit) to $25.2 billion (45 percent). Since then, the City's debt limit has been declining. It sharply declined from $53.8 billion in 1995 to $35 billion in 1996 and further declined to $31.9 billion in 1997. During the same time, however, outstanding indebtedness increased from $26.6 billion (49 percent of the limit) in 1995 to $29.2 billion (83 percent) in 1996.
The City's proximity to the debt limit is primarily the result of reductions in real estate market values which form the base of the debt limit formula during the last five years. The rate of decline in the value of the real estate base, however, has been amplified by the methodology used by the State to forecast full values during years for which a market value survey does not exist.39 This methodology, based on State law, significantly overstates the City's full values following economic expansion while it significantly understates them following economic recession. Further, the City's debt limit is thought to be outdated because the City derives revenue from a variety of other sources which should be considered when evaluating the appropriateness of the debt limit.
Legislation, recently introduced in the State Assembly and Senate, to create the Authority would address the short-term need to permit the City to continue financing its existing capital program. Further, it would provide a forum for a discussion of debt affordability in the context of an evaluation of the current constitutional debt limit. The legislation would avoid the creation of a permanent authority to bridge a short-term problem by empowering the Authority to issue only up to $7.5 billion of bonds which would not be subject to the debt limit. The legislation would also further limit the life of the Authority by withdrawing the power to issue bonds from the Authority upon passage and implementation of an amendment to the constitutional debt limit. The Authority, however, would continue to exist as long as its debt, including refunding debt, is outstanding.
Bonds of the Authority would be backed by a pledge of the City's personal income tax (PIT). Once the Authority pays debt service on its bonds and its operating costs, the remaining PIT revenues would be available to the City for operating purposes. While the State would agree not to impair the bondholders' rights, the State would still be able to amend, modify, repeal or otherwise alter statutes imposing or related to the PIT.
In sum, the legislation would create an authority whose sole purpose would be to issue bonds when, and to the extent, the City is unable to implement its capital plan because of the debt limit. Since the Authority would be limited to financing capital projects that are in the City's capital budget, participants in the City's existing long-term capital planning process would continue to exercise policy control.
Debt Service Trends
The Mayor’s debt service projections assume enactment of State law to enable the City to continue its capital program. The preliminary budget projects debt service to decrease from $3.4 billion in 1997 to $2.7 billion in 1998. Between 1999 and 2001, debt service is projected to total between $3.6 billion and $3.9 billion. The 1998 decrease is partly due to the prepayment of $391 million of 1998 debt service with anticipated surplus 1997 funds.40 Debt service has generally been increasing and is expected to continue increasing over the financial plan period. Figure 5-9 presents debt service adjusted for inflation and the surplus roll. Annual adjusted debt service costs have increased from an average of $2.3 billion per year from 1987 to 1991 to an average of $2.7 billion from 1992 to 1996. From 1997 to 2001, average annual adjusted debt service is expected to be $3.3 billion.
| Figure 5-9. Debt Service Expenditures, 1987 - 2001 | |
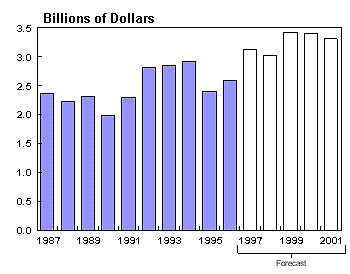 | |
| SOURCE: | NYC Comprehensive Annual Financial Report of the Comptroller, FY 1987-1996. |
| NOTE: | Adjusted for inflation and net impact of surplus roll prepayments. |
A comparison of debt service to City resources mirrors the upward trend, especially from 1997 through 2001. Figure 5-10 presents adjusted debt service as a percentage of City tax revenues. After remaining fairly stable at around 12 to 13 percent through 1991, debt service increased from 14 to 15 percent for all but one year from 1992 to 1996. Continuing the trend, this measure of debt burden is projected to increase to over 18 percent of tax revenues by 1999.
| Figure 5-10. Debt Service, Percent of Tax Revenue | |
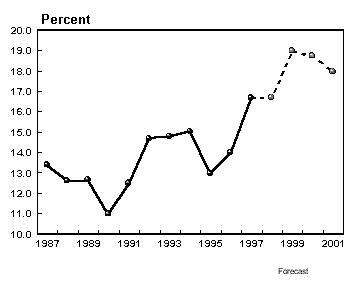 | |
| SOURCE: | Independent Budget Office NYC Comprehensive Annual Financial Report of the Comptroller, FY 1987-1996. |
| NOTE: | Adjusted for net impact of surplus roll prepayments. |
Capital Expenditure Trends
The Mayor proposes to fund capital expenditures, which generate debt service, at levels consistent with spending in recent years. While the proposed 1997 capital budget, adjusted for inflation, is at the highest level since 1990, average annual spending from 1997 through 2000 is projected to be $4.5 billion, nearly equal to average annual spending from 1987 to 1996 of $4.4 billion. Specifically, the proposed budget would increase spending on environmental protection and education from 1997 through 2000. Increases in school facilities investments are intended to address deteriorating building conditions and new space needs due to increased enrollment. Further, the plan reflects part of the cost of implementing the watershed protection agreement recently signed between the City and the upstate regions near the reservoirs. Average annual spending would decrease in most other program areas, most significantly in housing. Housing investments from 1987 to 1996 included the City’s multi-billion dollar effort to rehabilitate or rebuild much of the deteriorated housing stock that was in its possession from foreclosure. Since 1993, housing spending has declined significantly and will continue at the lower level from 1997 through 2000.
| Figure 5-11. Capital Commitments, 1992 - 2000 | |
 | |
| SOURCE: | The Mayor’s Message, 1992 - 1996. |
| NOTE: | Adjusted for inflation; 1997-2000 adjusted for unattained commitments.41 |
A number of factors could cause the budget outlook discussed above to be significantly different. For instance, categorical grant levels from the federal and/or State governments could change, the City could fundamentally alter the way that certain services are provided, federal welfare reform could be implemented differently than assumed, or other unexpected developments could occur. This chapter discusses some of these issues.
Fresh Kills Closure
All waste collected by the Department of Sanitation (DOS) is presently transported to the Fresh Kills landfill on Staten Island for disposal. The most recent DOS analysis, presented in the Comprehensive Solid Waste Management Plan, Final Update and Plan Modification, calculated 1994 total disposal costs per ton at $41.55, or $162.6 million annually (including debt service associated with items funded through the capital budget). The City’s commitment to close the Fresh Kills landfill by December 31, 2001, will fundamentally change the City’s waste disposal process and could increase overall Sanitation expenditures unless savings are achieved elsewhere in the agency.
Waste Exportation
Upon closure of Fresh Kills, any portion of the City’s 13,000 tons-per-day waste stream that is not eliminated through recycling or reduction initiatives must be exported, unless the City is willing to open new landfills or incinerators. Waste disposal expenditures in the post-Fresh Kills era depends on several factors:
Although projecting the long-term fiscal impact of closing Fresh Kills is difficult at this early stage, it is possible to provide a range of potential costs that are directly related to exporting. The main cost components of waste exportation are transportation and disposal fees. Transportation costs vary by mode (truck, rail, or barge) and distance, while disposal (both landfill and incinerator) costs differ widely by geographic location.
Sadat Associates, Inc. (SAI), a New Jersey-based civil and environmental engineering firm, produced a comprehensive analysis of potential exportation costs in the firm’s report prepared for the Staten Island Borough President’s Office. SAI estimated that total exportation costs could be as low as $40 per ton or as high as $100 per ton. Figure 6-1 illustrates a range of costs, over and above baseline levels, that could be incurred by the City due to exportation.
| Figure 6-1. Additional Costs of Exporting New York City’s Trash in 2002 | |
 | |
| SOURCE: | Independent Budget Office. |
| NOTES: | Costs per ton are 1996 estimates adjusted for inflation. Assumes 302 annual refuse collection days. Assumes City exports 100 percent of waste by July 1, 2001. |
In the best-case scenario, the City would reduce its waste to 9,000 tons per day and pay $47 per ton to export, increasing DOS baseline expenditures by a net of over $70 million, or nearly 12 percent. In the worst-case scenario, net DOS spending would increase by $400 million to about $1 billion, 67 percent higher than current baseline projections. These scenarios consider only the direct costs of exporting garbage. They do not include the costs of continuing any current disposal operations, such as marine transfer stations, or administration that may be necessary to export waste. To the extent that these scenarios assume lower tonnage through increased recycling and waste reduction, they do not include the incremental costs of these programs.
The analysis also excludes debt service costs. Debt service would result from any capital investments associated with closing the landfill. The City must conform to federal regulations governing landfill closure and post-closure procedures, including capping, landscaping, and site monitoring. Although the State Clean Water, Clean Air Bond Act, approved by voters in November 1996, earmarks $75 million for these purposes, it will only cover a fraction of the hundreds of millions of dollars ultimately needed.
Debt service costs would also result from capital improvements needed to retrofit the City’s infrastructure to support exportation. Possible investments include additional waste transfer facilities, waste containerization facilities, and extra road and bridge maintenance due to increased truck traffic into and out of the City.
Mitigating Export Costs
The City could mitigate future increases in waste disposal expenditures by reducing the amount of solid waste through reduction and recycling initiatives. Expenditures could further be reduced through productivity gains in waste collection at DOS.
Waste Reduction
The most desirable method of reducing costs is to minimize the amount of waste material, recyclable or not, that is generated in the first place. Traditional strategies have been to work with industries to reduce materials used in packaging or to simply legislate such mechanisms. Advancements in waste prevention and reduction, such as minimizing excess packaging and disposable goods, are important to controlling the long-term costs of waste disposal, but it is difficult to assess the direct results of such programs.
Recycling
New York City began curbside recycling pickup in 1988 and expanded the program Citywide in 1994. During this time, mandated recycling targets were set by Local Law 19 of 1989, the New York City Recycling Law. In 1996 DOS recycled an average of 1,457 tons per day—a 13.8 percent diversion rate (the amount of recycled material compared to the total amount of collected material, both garbage and recyclables). To meet the legal requirement, however, DOS would have to improve recycling efforts to 4,250 tons per day, a diversion rate of about 40 percent, assuming the 1996 residential waste collection level.
As Figure 6-2 illustrates, improvements in the diversion rate through 1994 can be largely explained by expanding curbside service to additional areas throughout the City. Since the program went citywide, however, diversion rates have remained nearly constant. Future advancements will have to be realized through collecting additional materials (such as mixed paper and bulk metals) and/or through improving diversion rates.
| Figure 6-2. New York City Recycling Districts and Diversion Rates | |
 | |
| SOURCE: | Mayor’s Management Report, Fiscal Years 1989-1996. |
| NOTES: | Does not include asphalt or abandoned vehicles for comparison with earlier years. |
Improved recycling will reduce the amount of trash that must be exported, but expanding the City’s recycling program could initially increase baseline spending. As the cost to dispose unrecycled refuse increases, however, the relative cost of recycling decreases. The cost of recycling is also subject to fluctuations in the general market for recycled materials.
Finally, the economics of the City’s recycling program is influenced by operating costs, the largest component of which is generally wages and benefits of sanitation workers collecting the material. Through further improvements in recycling efficiency and productivity (strategic use of dual-bin recycling trucks, for example), DOS should be able to reduce these expenses.
Trash Collection Productivity
Improved productivity and efficiency in garbage collection could offset some of the increased costs associated with exportation. DOS has taken steps to improve productivity, such as extending collection routes and reducing the number of workers assigned to each truck from three to two. There remains room, however, for significant gains, especially when New York City is compared to some other large cities.
Some options, such as additional route extensions, reduction of overtime, and more efficient equipment, could be explored within the Department’s current collection system. Other initiatives, such as privatization or managed competition, could alter the basic nature of collection service while resulting in significant savings for the City.
ISTEA
The Intermodal Surface Transportation Efficiency Act (ISTEA) is the primary means by which the federal government funds transportation activities at the state and local levels. Coming on the heels of the 40-year Interstate Highway construction era, ISTEA focuses more on highway and transit system preservation than on new construction. The source of ISTEA funding is the federal gas tax, currently 18.3 cents per gallon, of which 14 cents is allocated to ISTEA through the Highway Trust Fund, and 4.3 cents is allocated to federal deficit reduction.
With ISTEA scheduled to expire on September 30, 1997, Congress will turn its attention to the issue of reauthorization over the course of the next several months. Currently authorized at $155 billion over six years, ISTEA has been a critical source of transportation funding for states and localities since 1992. In federal fiscal year (FFY) 1997, New York State’s share of ISTEA funding is expected to be $1,876 million.
Based on information from the New York State Department of Transportation (NYS DOT), IBO expects ISTEA allocations to New York City (including transit and commuter rail) from FFYs 1992 through 1997 to exceed $6 billion, with the New York State allocation totaling $10.5 billion. As Figure 6-3 indicates, the New York City region allocation has exceeded $1 billion in each of the last four years. This funding has been vital for a number of major City construction projects. Consequently, the results of reauthorization could have a significant impact on the capital program of the City.
| Figure 6-3. ISTEA Highway and Transit Funding | |
 | |
| SOURCE: | New York State Department of Transportation |
| NOTES: | New York City allocation includes transit capital and operating funds for the Metropolitan Transportation Authority (MTA), including commuter rail. |
ISTEA and New York City
Nearly all ISTEA funds are allocated to capital projects addressing surface transportation and transit. ISTEA programs of particular importance to New York City are described below.
Surface Transportation Program (STP). The STP is a block grant program that can be used by the states for most major roads. A total of 50 percent of funds must be divided among a state’s urban areas, in proportion to each area’s population. In New York City, STP funds have been used primarily for street and bridge reconstruction as well as for some transit projects.
Congestion Mitigation and Air Quality Improvement Program (CMAQ). CMAQ directs funds toward transportation projects aimed at assisting with Clean Air Act compliance. Funds are distributed to certain metropolitan areas based on level of air quality non-attainment and population. Examples of how CMAQ funds have been used in New York City include the introduction of high speed ferries, expansion of rail freight, and development of bicycle paths and lanes. New York City CMAQ funding totals about $70 million annually, including funding for the MTA.
Bridge Replacement and Rehabilitation Program. Funds from this program can be applied to any bridge on a public road. This program has provided significant funding for older cities like New York City. For example, the rehabilitation of the four major East River Bridges—Williamsburg, Manhattan, Brooklyn, and Queensboro—has been funded in part by the ISTEA program, with $643 million in additional funds anticipated from all sources in 1998 to 2004.
Transit Programs. In addition to continuing programs created by previous law, ISTEA lays out such objectives as transit and highway funding flexibility and identical matching shares, rail modernization funding by formula, increased use of the Highway Trust Fund, and an expanded research program. In the New York City region, transit funds are used for the MTA, the New York City Transit Authority, and commuter railroads.
Reauthorization Proposals
ISTEA reauthorization is expected to be an issue that is addressed early in the current session of Congress and one that will generate a great deal of debate. Three major proposals and implications for the City are discussed below.
The President’s Proposal
It is widely anticipated that President Clinton’s ISTEA reauthorization proposal will propose retaining the existing framework of the current law, but also call for giving state and local officials more flexibility in the use of funds. The U.S. Department of Transportation is seeking to increase flexibility by expanding the Surface Transportation Program and recasting it as a flexible, multimodal program that states and localities can use on almost any surface transportation infrastructure project.
If the President’s reauthorization proposal were to total $175 billion over six years (a $20 billion increase over current levels), New York State’s annual share could be increased proportionately from $1,876 million to $2,118 million. The City’s allocation could, in turn, increase from $1,072 million each year to $1,210 million, an increase of $138 million. On the other hand, it is also possible that the President’s proposal will recommend less than the current funding level, in which case State and City allocations would be proportionately lower. For example, an authorization level of $145 billion would translate into an annual appropriation of $1,754 million for the State and $1,002 million for the City, a decrease of $70 million per year.
STEP 21 Proposal
The Streamlined Transportation Efficiency Program for the 21st Century (STEP 21) proposal, developed by Representatives Tom DeLay and Gary Condit, would alter the distribution of federal highway funds, but would not address the issue of ISTEA transit funding. Instead of distributing highway funds according to need, the proposal would base future distribution primarily on federal gas tax collections. One-third of the funds would be used to maintain the National Highway System, including interstate highways. The remaining two-thirds would be distributed based on federal gas tax collection rates, with some consideration given to equity factors. Step 21 supporters argue that each state should receive no less than 95 percent of federal fuel tax revenue raised within that state. Opponents argue that funds should continue to be allocated to states primarily based on need.
According to information from NYS DOT, IBO estimates that this proposal would reduce New York State’s annual highway apportionment by up to $280 million. If the City were eligible for a similar proportion of State ISTEA funds as it is in 1997, it would lose approximately $160 million annually under this proposal.
Devolution or Turnback Proposal
The devolution proposal, developed by Representative John Kasich and Senator Connie Mack, would "turn back" control of transportation policy to the states. Known as the Transportation Empowerment Act, the proposal provides for a two to four year transition period, after which the federal gas tax would be lowered from 18.3 cents to about 6.3 cents, with most of the revenues (4.3 cents) used for federal deficit reduction. With the lowering of the gas tax, most ISTEA programs would be eliminated, with the exception of what the sponsors call a "core" program, such as Interstate Maintenance and Emergency Relief. Based on information provided by NYS DOT, IBO estimates that devolution would result in the State losing as much as $1.75 billion per year, which would translate into a proportional loss of revenue of up to $997 million per year for the City.
Supporters of devolution argue that states and localities are most qualified to make spending decisions. In addition, devolution supporters want to ensure that tax revenues from one state are not used to fund programs in other states. Opponents argue that it is critical that the federal government continue to play a role in transportation policy and funding, and that each state’s allocation should be based primarily on need.
If ISTEA funds were essentially eliminated, the key question is how and to what extent the State and City would replace the lost revenue. In order to replace federal gas tax aid with State gas tax funds, the State would need to increase its fuel tax by 28 cents. Accounting for the reduction in the federal gas tax, such an increase would result in New York City’s gas tax being raised from 39.7 cents to 55.7 cents.
Education
There are several external factors which may contribute to an increase in Board of Education (BOE) spending above IBO current services baseline estimates. In particular, continued student enrollment growth could escalate the cost of delivering educational services.
In addition, potential policy changes are not recognized in the current services baseline. Lawmakers on all levels have become increasingly aware of new educational funding needs such as capital construction, textbooks, and reading.
Enrollment Growth
In recent years, enrollment of primary and secondary students has been increasing at the rate of 20,000 students a year, with increases partly attributable to the influx of immigrants into the City. As shown in Figure 6-4, total student enrollment increased from 939,142 in 1987 to 1,056,072 in 1996; or 12 percent.
| Figure 6-4. Total School Enrollment, 1987 - 2001 | |
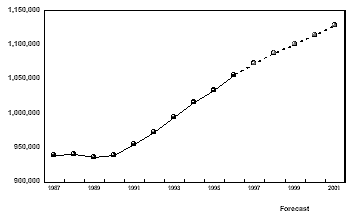 | |
| SOURCE: | Independent Budget Office; NYC Comprehensive Annual Financial Report of the Comptroller, Fiscal Years 1987-1996; The Grier Partnership, Detailed Enrollment Projections 1996 to 2005, NYC Public Schools, October 1996. |
Staffing Levels
Class-size regulations, as promulgated by the New York State Commissioner of Education, limit the number of daily periods a teacher can conduct classroom instruction to five. Moreover, contractual agreements between the City and the teacher’s union set maximum student teacher ratios at 34:1 for high schools, 33:1 for middle schools, 32:1 for elementary, and 28:1 for early grades. Based on these staffing ratios, rising enrollments translate into additional pedagogical needs for BOE. Figure 6-5 shows teaching positions funded by federal, State, and City dollars since 1987.
| Figure 6-5. Pedagogical Headcount | |
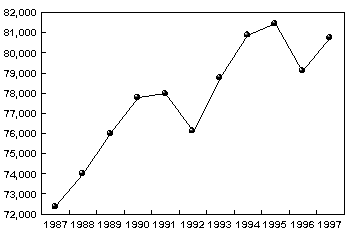 | |
| SOURCE: | Independent Budget Office; Office of Management and Budget. |
| NOTES: | Reduction in headcount from 1995 to 1996 reflects early retirement program enacted at the end of 1995-1996 school year. Replacements were hired at the beginning of the next school year and are not included in 1996 headcount. 1997 headcount is forecasted for June 1997. |
Special Education
The BOE budget reflects significant growth in special education instructional support and district administrative expenditures between 1987 and 1996. These expenditures grew by nearly 118 percent in nominal terms. In real dollars, special education expenditures grew by 59 percent. These cost increases are largely driven by rising special education enrollment. Part-time and full-time enrollment grew by 32 percent from 1987 to 1996. Figure 6-6 shows instructional support, district administrative special education expenditures, and enrollment growth since 1987. Special education enrollment is projected to reach 159,381 in 1997.
| Figure 6-6. Special Education Enrollment and Real Spending, 1987-1996 | |
 | |
| SOURCES: | Independent Budget Office. Mayor’s Management Reports, 1987-1996. |
1997-1998 State Executive Budget
In his 1997-1998 Executive Budget, the Governor recommends several measures which would put additional pressure on the Board’s budget in 1998 and into the future. While the Governor proposes an increase to City school aid of $85.9 million or 28.5 percent of the total State-wide increase, this figure translates into a 2.4 percent increase over the prior year’s level, which is less than the rate of inflation.
The Governor proposes several initiatives which would shift the cost of educating children with disabilities to localities. One component of his special education reform package would assign an assumed percentage of special education pupils in public settings at 10.3 percent versus 11.7 percent for all other districts. Growth in aid for these pupils would be capped over a four-year period. Recently, the U.S. Court of Appeals ruled in Russman vs. Sobol that certain special education services in certain circumstances must be provided at non-public school sites. BOE has indicated that the potential impact of this ruling could cost the City tens of millions of dollars in the near future.
The Executive Budget also includes reductions in State reimbursement for special education summer school by $4 million and reduce the State reimbursement rate for pre-kindergarten transportation by about $8 million, beginning in 1997 to 1998.
Facilities
Although not a major component of BOE’s operating budget, school facilities needs have been greatly complicated by enrollment growth. Poor building conditions have required BOE to devote a significant portion of its capital resources to basic rehabilitation work, which. has limited its ability to construct additional classroom space.
IBO baseline, as well as the Mayor’s preliminary budget, includes capital and operating funds for new classroom space. About 60,000 new seats are proposed in the preliminary budget from 1997 to 1999 through a mix of new construction, rehabilitation, leasing, air-conditioning (for year-round education), and modular and transportable classrooms. Analysis of BOE capacity and enrollment data indicates that there are currently 73,000 students more than the ideal capacity of school buildings. Given that BOE anticipates an influx of an additional 44,500 students from 1997 to 1999, the question remains whether the proposed funds are sufficient to cover existing and future facilities needs.
Welfare
IBO’s public assistance caseload and expenditure projections are based on a number of assumptions including the following: the New York City economy will continue to grow at a moderate pace, the present HR and AFDC (TANF) programs will emerge essentially intact except for the changes required by the Personal Responsibility Act (PRA), the PRA will not be revised by Congress, and grant levels and special grants will be maintained at present levels. Violations of any of these assumptions could cause actual caseloads and expenditures to vary significantly from these projections.
Recent history shows that the employment level in the City is inversely related to the number of persons receiving both HR and AFDC. Therefore, an economic recession could be expected to increase both HR and AFDC rolls to levels well above current projections, adding to City expenditures on cash assistance. Because of the work provisions in the PRA, higher AFDC caseloads would in turn add to workfare and child care costs especially in the later years of the financial plan. Alternatively, higher than expected employment growth could reduce the cost of grants, work program administration, and child care to levels below in the IBO projections.
Decisions soon to be made by State officials will also impact on City welfare costs. One of the most important of these will be the allocation of surplus TANF funds among the State and local districts. If New York City receives a TANF allocation higher than that assumed in the projections (and closer to its actual share of the AFDC caseload), its own share of the cost of implementing the PRA will decrease. On the other hand implementation of proposals in the Governor’s Executive Budget to replace HR with a capped Article XVII Safety Net Assistance program, gradually lower AFDC grants, and limit special grants could result in the City being forced to assume a larger portion of public assistance costs especially in the event of an economic downturn. Finally, a decision by State officials to enforce the two year work rule could result in City expenditures of hundreds of millions of dollars beyond projected levels.
Congressional action to change the PRA could also cause City welfare caseloads and costs to vary from projected levels. In particular, congressional acceptance of the President’s proposal to loosen restrictions on the eligibility of certain classes of aliens for Supplemental Security Income (SSI) could result in lower than projected HR caseloads beginning in 1998.
Long-Term Revenue Issues
Historical Revenue Estimates
In Figure 4-1 and in the text, we have made a number of adjustments to the revenue budget numbers taken from older Annual Comptroller’s Reports. The biggest adjustment concerns intergovernmental grants and aid. Twenty years ago, federal and state funding for Medicaid and SSI flowed through the City budget (much as AFDC and Home Relief funding does today), as did State funding for CUNY senior colleges. Including these funds, intergovernmental grants and aid reached $9.43 per $100 personal income in 1976, and total revenues reached $20.88. Medicaid and SSI were shifted from the City to State budget in 1978, and State senior college aid was shifted in 1983. To provide a consistent historical comparison with our current and projected revenue numbers, Figure 4-1 removes these grant flows from the earlier years. We have also removed State-administered City taxes from the intergovernmental aid category, where they were sometimes placed before 1976.
Figure 4-1 also excludes "non-revenue receipts"—borrowing to cover operating budget deficits—from the pre-1976 revenue budget totals, and shifts related transfers for debt service and note redemptions to the expense side of the budget.
All discussions of the revenue share of personal income use fiscal year personal income. Pre-1970 fiscal year personal income totals have been estimated from older Bureau of Economic Analysis city and county-level PI data. The revised county-level series only goes back to 1969, but differs only slightly from the older series where the two overlap.
Assessment Gap
To estimate the assessment gap, IBO constructed a database of actual and taxable billable assessed values for the years 1982 through 1997 for all properties in the City. The underlying data was the Department of Finance’s 1997 assessment file which contains a record of past changes in value. To simulate what assessments would have been without the caps or Section 581, it was necessary to build up estimated market values for each property for each year in the study. For properties subject to assessment caps, the uncapped assessed value was assumed grow at the same rate as the market value, with the higher value becoming the base for subsequent years. For cooperatives and condominiums, the non-581 assessed value was computed by multiplying the estimated market value by the pre-S7000a assessment ratio. New assessed values were tested against the appropriate maximum assessment ratio for the class for that assessment year being modeled.
Market Values
In the years before 1991, the City did not publish market values and did not store them in its computer files. Although the Department of Finance has records of sales for individual properties, they are not available to the IBO. Instead, for one-, two-, and three-family homes, and cooperatives and condominiums, IBO calculated market values using the annual median assessment ratios of sold properties which are reported by the Department of Finance for different areas of the City. (The information is not reported for cooperatives, so the estimates derived for condominiums were substituted.) For apartment buildings with ten or fewer units and the "mom and pop" mixed use properties, which did not always have sufficient sales for reliable estimates, a second market value was estimated based on assessment changes for similar properties (walkup buildings with 11 to 14 units, excluding tenements) in the same neighborhood. The lower of the two estimated market values was then selected.
Expenditure Forecast Notes
General. The current services expenditure baseline for 1997 was initially based on the modified condition of the adopted budget at the unit of appropriation level for each agency, as reported in the Integrated Financial Management System as of November 30, 1996. The baseline was adjusted to report expenditures net of intra-city and interfund agreements in order to facilitate future comparisons to historical data as reported in the Comptroller’s annual financial report for general fund expenditures.
The changes to agency expenditures as a result of the first quarter budget modification approved by the City Council were reflected in the baseline.
After the release of the January financial plan, an analysis was completed which reconciled the forecasted expenditure levels as reported in the plan to the baseline. Adjustments were made to the baseline to reflect the level of expenditures anticipated at the end of 1997. In general, current year policy and the Program to Eliminate the Gap (PEG) were scored at their estimated current year value and outyear PEGs and policy decisions were not incorporated into the baseline.
Debt service was carried at the January financial plan level including the anticipated prepayment of $391 million of 1998 debt service in 1997. The total amount of debt service expenditures for 1998 is projected at $2,432 million. The percentage increase for 1998 over the 1997 baseline, before adjusting for the anticipated prepayment, would be 5.7 percent, with combined growth of 8 percent, 5 percent, and 5 percent for 1999 through 2001 respectively.
Labor reserve projections are based on the January financial plan estimates before PEG adjustments. The projections for 1998 through 2001 amount to $572 million, $1,151 million, $1,886 million, and $1,964 million respectively. Pension contributions were carried at the January financial plan level, net of intra-city funding.
In forecasting New York City OTPS expenditures and in analyzing constant dollar City outlays and revenues, the adjustment for inflation was based on a fiscal year price index using Office of Management and Budget estimates of current and chain-weighted constant dollar Gross City Product. This deflator was chosen over the Consumer Price Index because it reflects a basket of purchases closer to the typical City government outlay basket. The reference year for the index is 1997.
Public Assistance. The following procedures were followed to develop IBO caseload and expenditure projections for Home Relief (HR) and Temporary Assistance for Needy Families (TANF).
Regression equations predicting caseloads with employment levels were developed. Federal government projections of future employment levels in New York City were used to develop economically based caseload projections for the years of the financial plan. The economically based caseload projections were then altered to take into account the likely effects of policy changes including the continuation of local welfare reform programs (NYC WAY) and the implementation of the new federal law. The result was IBO’s month-by-month caseload projection for HR and TANF.
Average per person grant payments were projected based on recent historical trends. These were multiplied by the average projected caseload for each fiscal year. As a last step in developing annual expenditure projections, adjustments were made for the estimated effect of PEGs in each year.
The additional costs of administering work programs were projected by applying the work quotas in the PRA to IBO projected TANF caseloads to determine the number of new work program slots that would need to be developed each year. The additional need for child care slots to support new work programs was projected using IBO projections of the number of new workfare slots and information on the age distribution of the children in TANF families. These projections were then multiplied by the unit costs for each year. (For a discussion of the estimated unit costs for workfare and child care, see The Fiscal Impact of the New Federal Welfare Law on New York City, The New York City Independent Budget Office, October 1996.) The amount of new federal child care funds available to the City was estimated by IBO on the basis of information provided by State officials.
Medicaid. The following procedures were followed to develop our Medicaid expenditure projections for the Human Resources Administration.
Using data from the State Department of Social Services, Medicaid expenditure reports (MARS) from the State Department of Health and national data from the Congressional Budget Office, IBO examined Medicaid spending trends over the last decade. Based on this historical data as well as knowledge of recent program changes and cost containment measures, growth rates were projected for thirteen distinct Medicaid program areas funded by the Human Resources Administration. Growth rate projections were developed for the current fiscal year and each year of the financial plan. Applying these growth rates resulted in unadjusted projected expenditure amounts for each year.
All budgeted Medicaid PEGs were examined to determine their viability. Viable PEG values were deducted from the expenditure projections. Adjustments for federal disproportionate share payments were also made.
The following Independent Budget Office staff prepared the revenue and expenditure projections in this report.
Economic and Revenue Projections
| Michael Jacobs | Business, Personal Income, and Sales Taxes |
| George Sweeting | Property Taxes |
| Luan Lubuele | Econometric Modeling |
| Joyce Sun | Econometric Modeling |
Long-Term Revenue Issues
| David Belkin | Structural Tax Policy and Tax Elasticities |
| George Sweeting | Property Tax Gap |
Expenditure Projections
| Richard Greene | Capital Program |
| Patrick Killackey | Debt Service |
| Paul Lopatto | Medicaid Caseload |
| Terri Matthews | Debt Service |
| Frank Posillico | Current Services Baseline Model |
Health and Human Services
| Deborah Ahrens | Health and Social Services |
| Jonathan Cortell | Health and Social Services |
| Ritta McLaughlin | Social Services |
| Sofía Quintero | Medicaid and Public Assistance |
Housing, Education and Infrastructure
| Eric Dixon | Housing and Buildings |
| Sarah Monroe | General Government and Debt Service |
| Nancy Penska | Board of Education and City University |
| Martha Prinz | Transportation Services |
| Joyce Sun | Libraries, Recreation and Culturals |
Uniformed Services
| Ian Brown | General Government and Sanitation |
| Paul Greaves | Public Safety and Judicial |
| Jenell Horton | Environmental Protection and Judicial |
| Bernard O'Brien | Public Safety and Judicial |
Other
| Betheum Moodie | Computer Support |
| Indera Segobind | General Support |
| Deanice Jenkins | General Support |
| 1 | All economic data are on a calendar year basis. | |
| 2 | This forecast is very similar to the Blue Chip consensus forecast, which is based on a survey of 40 to 50 private-sector economists. In January 1997, the Blue Chip survey of real GDP forecasts averaged 2.3 percent for 1997 and 2.1 percent for 1998. | |
| 3 | There are often cyclical differences as well. The 1991 national recession, for example, was relatively brief and mild. In contrast, the City’s downturn began earlier, lasted longer, and was considerably steeper. | |
| 4 | Tax revenues forecasts do not reflect the tax reductions proposed by the Administration in its recently released preliminary budget. | |
| 5 | For cooperatives and condominiums, the City is explicitly prohibited from estimating the market value as the price the property would bring at sale. See "The Property Tax Gap" in Chapter 4 for further detail. | |
| 6 | The tentative, or preliminary, assessment roll is released each January showing each property’s proposed assessed value for the coming fiscal year (starting July 1). Taxpayers who believe that their assessments are incorrect have the opportunity to petition the Department of Finance and/or the Tax Commission. In late May, after the petition period is over, the final assessment roll is released containing the values which are used in preparing individual tax bills which are mailed out at the start of the fiscal year. | |
| 7 | Because of a technical change in the assessments of Class 3 properties in 1994, the "frozen" overall rate fell from its 1992 and 1993 level of $10.591 per $100 of assessed value to $10.366 per $100 in 1994 and thereafter. However, because of class shifts accompanying the 1994 change, the rate change had no effect on the tax levy. | |
| 8 | The withholding tables sent to employers by the New York State Department of Taxation and Finance, which collects the City’s PIT, have not been adjusted to remove the effects of the surcharge and the State is still collecting the revenues. | |
| 9 | Unless otherwise stated, in this section all actual and forecast revenue amounts refer to tax receipts net of both refunds and audits. | |
| 10 | Non-bank financial corporations, such as investment banks and securities brokers, are subject to the GCT and not the BCT. | |
| 11 | In terms of the size of the revenue impact, the two most significant of these policies are the 1995 authorization in New York State of the limited liability company form of business organization, which is inducing some small companies to form as non-corporate entities subject to the UBT and not the GCT, and the 1996 revision of the "income-plus-compensation" method of calculating corporate tax liability in New York City, which will lower tax liability for some corporations. | |
| 12 | PEGs refer to new initiatives undertaken as part of the Program to Eliminate the Gap. In most areas of the budget they represent expenditure reductions. However, in the revenue budget they usually represent new tax enforcement projects. | |
| 13 | The airports are built on City-owned land which is leased to the Port Authority. | |
| 14 | There were, however, gross receipts taxes imposed on financial and nonfinancial businesses. These taxes funded about 6 percent of the City’s budget in both 1956 and 1966, before being replaced (initially about dollar for dollar) by the general corporation tax, the financial corporation tax (later the banking corporation tax), and the unincorporated business tax. | |
| 15 | There were 3.0 and 5.0 percent increases in tax revenues per $100 PI in fiscal years 1985 and 1987, but these were mostly artifacts of federal tax reform, which caused large one-time "spin-ups" and "spin-backs" of taxable income (especially capital gains) from 1986 to the prior and following tax years. | |
| 16 | Deregulation of brokerage fees and other far-reaching equity market transformations since the stock transfer tax phase-out make it difficult to ascertain how much revenue the tax would now be generating. It would likely be much less than the $3 billion plus in annual stock transfer tax payments that (for accounting purposes) New York State still books but does not actually collect. | |
| 17 | Elasticity measures the relationship between revenue growth and income growth. An elasticity of 2.00 would mean that revenues are growing twice as fast as personal income (for every one percent growth in income, two percent growth in revenues). An elasticity of 0.50 would mean that revenues are growing half as fast as income (for every one percent growth in income, 0.5 percent growth in revenues). When revenue growth exceeds income growth (elasticity greater than 1.00), revenues are said to be elastic. When revenue growth is slower than income growth (elasticity less than 1.00), revenues are said to be inelastic. | |
| 18 | We need to be very careful here not to attribute all of the 1994 drop in baseline tax revenues relative to personal income to structural trend factors. But it was clearly not all just the product of the recession either. | |
| 19 | Federal income tax brackets are now adjusted for inflation, but not State and City income tax brackets. | |
| 20 | In New York City property tax liability is determined by assessed value, which, depending on the type of property, may or may not have a direct relationship to market value. Taxable assessed value is total assessed value less any exemptions. To be precise, taxable billable assessed value (after accounting for transitional assessments where relevant) is the basis for the tax bill. However, for the sake of simplicity, we shall use "assessed value" to refer to the ultimate tax base before exemptions, and "taxable assessed value" to refer to the ultimate tax base net of exemptions. | |
| 21 | This $750 million is the difference between current baseline revenue from these properties and potential revenue estimated by summing the nominal and "lost" assessed value of these properties and applying the pre-1983 tax rate. The pre-1983 rate was used to remove the effects of tax rate changes in the intervening years which compensated, at least in part, for the revenue being lost due to the assessment gaps. | |
| 22 | See the "Property Tax" section in Chapter 3 for make-up of the classes. | |
| 23 | These ratios have varied over the years; currently they are 8 percent in Class 1 and 45 percent in the other classes. | |
| 24 | To the extent that burdens were shifted, it was intended that the move would be towards greater equality. However, using discretionary authority available to it until 1992, the City each year acted to increase the inequality by further reducing the burden on Class 1 at the expense of the other three. IBO’s forthcoming study will examine the impact of these shifts in detail. | |
| 25 | For classes other than Tax Class 1, which do not have caps on the size of assessment increases, S-7000A provided for a five-year phase-in of assessment changes. | |
| 26 | Their widespread use is also partially attributable to the political power of middle class homeowners. Increased assessments on houses are more easily recognized by taxpayers than analogous changes in the tax base for a revenue source such as the personal income tax. | |
| 27 | Furthermore, because there is no cap on assessment decreases, the gap, measured in percentage terms, remains constant when assessed value falls. | |
| 28 | Final Report of the New York City Real Property Tax Reform Commission, April 1994, pg. 14. | |
| 29 | Unpublished figures from the Department of Finance indicate that market values would have be more than eight times higher in the very best cooperative and condominium neighborhoods bordering Central Park. | |
| 30 | This estimate assumed that the assessment ratio for cooperatives and condominiums would remain at the pre-S-7000A level of approximately 25 percent. | |
| 31 | Although cooperative and condominium buildings have effective tax rates which are lower than their nominal apartment building brethren in Tax Class 2, they pay higher effective tax rates than their fellow owner-occupants in Tax Class 1. In order to address this disparity, the City introduced a tax abatement beginning in fiscal year 1997 which partially offsets the difference between the two effective tax rates. | |
| 32 | For more details see The Fiscal Impact of the New Federal Welfare Law on New York City, New York City Independent Budget Office, October 1996 | |
| 33 | It is possible that some of these additional workfare and net child care costs will be covered by federal TANF surplus funds. It is unclear at this time, however, how much of these TANF surplus funds will be available to New York City. This analysis assumes that enough TANF dollars will be available to the City each year to cover the federal half of TANF grants to all recipients as well as baselined programs formerly funded under EAF, JOBS and AFDC administration. It also assumes that $77 million in surplus TANF funds will be available each year to replace part of the City’s cost of TANF grants. This $77 million has been identified in the Governor’s Executive Budget and was included in the Mayor’s preliminary budget. It is included in the net cost of cash grants listed in Figure 5-3. | |
| 34 | Unless otherwise noted, all references to years denote fiscal years. Also, unless otherwise noted, spending figures referenced are in nominal dollars and relate to the operating budget, thereby excluding capital budget expenditures. | |
| 35 | All funds include city revenues, such as income and property taxes, and funds from State and federal aid and grant programs. Intra-city revenues and inter-fund agreements are not included. | |
| 36 | General obligation debt finances a majority of the City's capital projects. It is secured by the City's full faith and credit which means that all taxable real property is subject to tax without limit on the rate or amount to pay debt service. Independent authorities, such as the New York City Water Finance Authority, issue revenue bonds secured by user fees, to finance certain City capital projects. The debt of these authorities is not subject to the City's debt limit. | |
| 37 | This amount does not reflect incremental increases to the margin under the limit due to the effects of the City's last two bond financings and certain technical adjustments currently under review. | |
| 38 | The City would suspend implementation by not entering into new contracts. Work on existing contracts would be able to proceed up to the contract amount. | |
| 39 | The survey, conducted by the State in 1993, reflects the downturn in the City's real estate market and, when applied to the five-year average full (market) value, has been decreasing, significantly reducing the City's current and projected debt limits. | |
| 40 | The prepayment described above is often referred to as a "surplus roll". The Financial Emergency Act is interpreted to prohibit the transfer of surplus funds from one year to the next. Since the Act does not, however, prohibit the prepayment of future expenses with surplus funds, the City often pays future debt service costs with current surplus revenues. | |
| 41 | In anticipation of plan changes or delays, the capital budget sets out individual commitments with a greater cost than the level of resources actually available in the commitment plan. The difference is the reserve for unattained commitment. In our adjustment, we have allocated the reserve proportionally among each category. |