Introduction
For many years, policymakers have struggled to either improve or
close schools that have been categorized as persistently
failing. Former Mayor Michael Bloomberg preferred to phase out
and eventually close underperforming schools. Current Mayor Bill
de Blasio initially renounced the phaseout policy in favor of
the Renewal Schools program that is designed to turn the schools
around by providing extra services.1 The Renewal Schools program
was launched in the 2014-2015 school year for 94 schools,
including 50 schools that the State Education Department also
identified as struggling. The Department of Education (DOE) has
outlined specific targets for academic improvement for each of
the three years of the program—through school year 2016-2017.
However, both Governor Andrew Cuomo and state education
Commissioner MaryEllen Elia have warned that if the 50 schools
do not improve by 2016-2017, the state could move to either take
over or perhaps even close those schools. Most recently, Mayor
de Blasio and schools Chancellor Carmen Fariña announced a
proposal to close three small, under-enrolled schools in
Brooklyn at the end of the 2015-2016 school year. Two of the
schools are part of the Renewal Schools program.2
Under the Bloomberg Administration, the DOE began phasing out
154 low-performing public schools; 35 of those were large,
comprehensive high schools. When the DOE announced that a high
school was being phased out, the school would not admit a ninth
grade class the following fall. Students who were currently
enrolled at the school were allowed to continue at the school
until it graduated its final class of students three years
later. As enrollment at the school fell each year, the school’s
budget also shrank and principals would often have to prioritize
the classes and teachers that would best serve the needs of the
students that remained. The school closure policy was partnered
with a policy to create new, usually small schools that would
take over the space being vacated by the closing schools. In
other cases, charter schools took some of the space being
vacated.
There have been several studies that have found positive effects
on school performance for the new small schools that replaced
failing high schools that were phased out, but fewer that have
attempted to analyze the effect of gradually shutting down a
school on the students that were attending the high school at
that time.3 In this report, IBO focuses on the last groups of
students that attended such schools when the phase out
announcement was made. One other
study, by the Research Alliance
for New York City Schools, also analyzed this aspect of the
phase out process.4 Key differences in methodology in
identifying comparison samples, the time period that was
studied, and the students who were tracked over time make it
difficult to directly compare the results. Our study stands as a
complement to existing studies on the relative quality of the
new replacement schools, and not as an alternative evaluation of
the entire school closure/new school creation policy.
In an attempt to isolate the impact of school closure, we have
carefully chosen two samples of students: those who attended a
school announced for phaseout and a comparison group of similar
students who attended a school that was low-performing but not
announced for phaseout. In order to track students through their
expected graduation date, we needed to use data from a number of
years ago. This report is largely focused on a group of students
who were ninth, tenth, or eleventh graders in 2006-2007, when it
was announced that their school would be phased out. Since
twelfth graders had almost completed their presumed final year
by the time of the announcement, they were excluded from the
analysis. Later in the report, we present a replication of our
results for a second cohort of students—those who were ninth,
tenth, or eleventh graders attending schools announced for
phaseout in 2008-2009.
We focus on three large comprehensive high schools in Brooklyn
that were among the list of schools announced for phase out
during school year 2006-2007. The three high schools were:
Samuel J. Tilden High School (Tilden), South Shore High School
(South Shore), and Lafayette High School (Lafayette). Tilden and
South Shore are located just 1.5 miles apart in East Flatbush
and Canarsie, respectively. Lafayette is about six miles
southwest in the Bath Beach section of Brooklyn, close to Coney
Island. It is worth noting that these phaseouts were announced
about halfway through Mayor Bloomberg’s large-scale push to
phase out large underperforming high schools. It is possible
that these schools may have been affected by nearby schools that
had previously been closed, as students who would have attended
the schools closed earlier were diverted.5
At the time of the announcement, there were 3,677 ninth, tenth,
and eleventh graders attending those three schools. This report
provides a descriptive analysis of those students and tracks the
outcomes for those cohorts for the next three years, two years,
and one year, respectively, based on their expected four-year
graduation date. Therefore, the “treatment” effect can be
described as the effect of attending a school as a ninth, tenth,
or eleventh grader at the time that a phaseout was announced.
This report compares the outcomes of the treatment group with
the outcomes of a comparison group of students to see if they
were significantly different. The results are also presented by
cohort to see if there was a differential impact for ninth,
tenth, and eleventh graders.
Data
Our analysis is based on student-level data provided by the DOE.
The data included demographic information about each student and
also allowed IBO to track students’ movements within and out of
the school system. IBO could monitor student performance before
and during high school using achievement data (New York State
test score data for eighth grade and high-school level Regents
exams) and course and credit data. School-level datasets were
constructed by aggregating across students. In addition to the
student-level data, we obtained school utilization rates from
the Enrollment, Capacity & Utilization Report (Blue Book).
Demographic variables of interest included ethnicity, gender,
English Language Learner (ELL) status, special education status
(students in self-contained or integrated settings), free or
reduced-price lunch eligibility, and whether or not a student
was over age upon entry to ninth grade. Student attendance rates
were also used. Students’ incoming English Language Arts (ELA)
and math test scores from eighth grade, when available, were
standardized to a mean of zero relative to the citywide
average—represented as a z-score.6
Comparison of Three Treatment Schools With All City High Schools
Tilden, South Shore, and Lafayette had graduation rates
significantly below the citywide average for high school
students in 2005-2006, the year prior to the phaseout
announcements. All three schools served ninth graders whose
incoming eighth grade test scores were well below the city
average for math and ELA, but Tilden and South Shore served
different student populations than Lafayette. The demographic
and academic profiles for Tilden and South Shore, shown in Table
1 below, portray stark differences from city averages. Compared
with the overall city high school population, Tilden and South
Shore served significantly fewer Asian or white students and
students eligible for free or reduced-price lunch, but more
special education students. Both schools had very low attendance
rates. Lafayette, on the other hand, served a share of Asian or
white students that was comparable to the city average, but also
served a significantly greater share of ELLs and students
eligible for free or reduced-price lunch, and a slightly smaller
share of special education students. Despite having an
attendance rate in line with the citywide average, Lafayette had
a graduation rate that was much lower than the city average, as
did Tilden and South Shore.
|
Table 1: Demographic and Academic Profiles of Schools Announced for Phase Out, 2005-2006
|
|
Percent of Students Who Were:
|
Lafayette
|
Samuel J. Tilden
|
South Shore
|
All City High Schools
|
|
Male
|
50.1%
|
54.3%
|
55.6%
|
50.5%
|
|
Asian or White
|
28.8%
|
1.1%
|
2.7%
|
28.1%
|
|
English Language Learner
|
26.4%
|
8.7%
|
5.0%
|
9.9%
|
|
Special Education
|
8.6%
|
13.4%
|
14.9%
|
10.5%
|
|
Free or Reduced-Price Lunch Eligible
|
71.9%
|
44.2%
|
21.8%
|
50.6%
|
|
Averages
|
Lafayette
|
Samuel J. Tilden
|
South Shore
|
All City High Schools
|
|
Eighth Grade ELA Z-Score: For School’s Ninth Graders
|
-0.45
|
-0.60
|
-0.58
|
-0.13
|
|
Eighth Grade Math Z-Score: For School’s Ninth Graders
|
-0.46
|
-0.68
|
-0.62
|
-0.12
|
|
Attendance Rate
|
84.6%
|
71.4%
|
73.0%
|
83.5%
|
|
Graduation Rate
|
37.2%
|
39.0%
|
32.7%
|
55.2%
|
|
SOURCE: IBO analysis of Department of Education data
NOTE: The average z-score for all city high schools is
not zero because there are some eighth graders who do
not attend public high schools.
New York City Independent
Budget Office
|
Student Characteristics for Ninth, Tenth, and Eleventh Graders
in Treatment Group
Similar demographic patterns are evident in Table 2
when we look at the treatment group of ninth through eleventh
graders at the three phaseout schools in 2006-2007, the year the
phaseouts were announced. Lafayette had much higher shares of
students who were ELL or Asian or white and much lower shares of
students who were in special education settings or eligible for
free or reduced-price lunch. In all three schools, almost half
of the remaining students were over age for ninth grade when
they entered it. There were a number of students in each school
with extremely poor attendance, pulling down the average (mean)
attendance rate for each school. The median attendance rate,
which is not skewed as much by those extreme cases, showed that
Lafayette had the highest attendance rate by over 10 percentage
points, followed by Tilden and South Shore. All three schools
generally served students that fell below the average in terms
of standardized incoming eighth grade ELA and math test scores,
though students at Lafayette had slightly higher averages
(closer to zero) compared with
the other two schools’ students. Finally, ninth graders
comprised the largest share of the treatment group—almost half
of students. Another third were tenth graders and the remaining
roughly 20 percent were eleventh graders.
|
Table 2:
Characteristics of Students in Schools Announced for
Phase Out
|
|
Percent of
Ninth, Tenth, and Eleventh Graders
in 2006-2007 Who Were:
|
Lafayette
|
Samuel J. Tilden
|
South Shore
|
|
Male
|
49.7%
|
57.1%
|
56.8%
|
|
Asian or White
|
30.6%
|
0.5%
|
2.5%
|
|
English Language Learner
|
37.8%
|
15.6%
|
6.6%
|
|
Self-Contained Special Education
|
3.7%
|
9.8%
|
11.3%
|
|
Integrated Special Education
|
1.7%
|
2.9%
|
2.4%
|
|
Free or Reduced-Price Lunch Eligible
|
24.9%
|
48.9%
|
34.4%
|
|
Over Age for Ninth Grade
|
45.8%
|
47.5%
|
45.4%
|
|
Total Students
Remaining
|
1,137
|
1,361
|
1,179
|
|
|
Lafayette
|
Samuel J. Tilden
|
South Shore
|
|
Mean
|
Median
|
Mean
|
Median
|
Mean
|
Median
|
|
Attendance Rate
|
80.9%
|
92.9%
|
67.0%
|
81.2%
|
63.1%
|
76.5%
|
|
Avg.
Grade 8 ELA Z-Score
|
-0.37
|
-0.33
|
-0.53
|
-0.47
|
-0.49
|
-0.46
|
|
Avg.
Grade 8 Math Z-Score
|
-0.42
|
-0.27
|
-0.59
|
-0.41
|
-0.50
|
-0.35
|
|
Grade
|
Number of Students
|
Percent of Students
|
|
9
|
1,695
|
46.1%
|
|
10
|
1,267
|
34.5%
|
|
11
|
715
|
19.5%
|
|
SOURCE: IBO analysis of Department of Education data
New York City Independent
Budget Office
|
Methodology for Constructing a Comparison Sample
Since students were not randomly assigned to the schools being
phased out, we needed a methodology that would allow us to make
valid comparisons between these students and similar students in
schools that were not phasing out. We did this by creating a
synthetic comparison sample using a technique known as
propensity score matching. This allowed us to answer the
question: What would the outcomes for students in phased out
schools have been had their schools not closed? This design was
intended to mimic a randomized experiment. Our matching process
had two steps: selecting comparison schools and then selecting
students within those schools that matched the characteristics
of the students in our treatment sample. For more details on our
methodology, please see the appendix.
Students Who Switched Schools. Roughly a quarter of students
(almost 1,800) switched schools at some point between school
year 2006-2007 and the time of their expected graduation. A
third of all ninth graders switched schools, as did 21 percent
of tenth graders, and about 8 percent of eleventh graders. About
26 percent of students in the treatment group switched schools
and 22 percent of students in the comparison school did. More
than a third of all students in the treatment and comparison
groups (616 students) who switched schools transferred to a
school in administrative district 79. District 79 is comprised
of alternative schools and programs designed to serve students
who are under the age of 21 but whose path towards a high school
diploma has been disrupted. Students in the treatment and
comparison groups transferred to a district 79 program at
roughly the same rate—7.8 percent of students in the treatment
group and 8.9 percent of students in the comparison group.
Our goal was to isolate the impact of school phaseout on the
students who were in schools at the time of the phaseout
announcement. The study was not designed to isolate the impact
of remaining in a school as it phases out. Thus, we continued to
count these students who switched schools as part of the initial
school to which they were assigned as of the time of the
announcement. If those students who switched schools were
dropped from the analysis, the results could be biased if the
students who left were systematically different from those who
stayed at the schools. This is true for both the treatment group
and the comparison group.
Final Four-Year Outcomes
For each of the three grade cohorts, IBO determined students’
final outcomes at the end of the school year in which they were
expected to graduate based on a traditional four-year timeline
(see Table 3 below). Eleventh graders were tracked through
September 2008, tenth graders were tracked through September
2009, and ninth graders were tracked through September 2010.
Students were determined to fall into 1 of 5 outcomes:
graduated, discharged, dropped out, still enrolled, or obtained
a General Equivalency Diploma (GED). Discharged students are
those who did not graduate or drop out, but left the school
system for some other reason, such as to transfer to a school
outside of New York City.7 Students who graduated could have
received one of several different types of diplomas, including:
a local high school diploma, a Regents high school diploma, an
advanced Regents high school diploma, diplomas with honors,
diplomas with career and technical education endorsements, and
Individualized Education Program (IEP) diplomas for special
education students only. During this time, the local diploma was
in the process of being phased out.8
|
Table 3: Four-Year Student Outcomes
|
|
Category
|
Comparison
|
Treatment
|
Total
|
Percent of Comparison Students
|
Percent of Treatment
Students
|
|
Discharged
|
533
|
551
|
1,084
|
14.5%
|
15.0%
|
|
Dropped Out
|
1,017
|
1,046
|
2,063
|
32.3%
|
33.5%
|
|
Still Enrolled
|
571
|
562
|
1,133
|
18.2%
|
18.0%
|
|
Received GED
|
70
|
74
|
144
|
2.2%
|
2.4%
|
|
Graduated
|
1,486
|
1,444
|
2,930
|
47.3%
|
46.2%
|
|
TOTAL
|
3,677
|
3,677
|
7,354
|
|
|
|
SOURCE: IBO analysis of Department of Education data
NOTE: Percent
of students discharged was calculated based on the total
number of students in each group (3,677). Percents for
all other categories were calculated based on the number
of students in each group excluding discharges (3,144 in
the comparison group and 3,126 in the treatment group).
This is similar to how the Department of Education
reports these figures, though these figures should not
be compared to published Department of Education figures
as they cover multiple cohorts of students and track
students over different time horizons.
New York City Independent Budget Office
|
The rate at which ninth, tenth, and eleventh graders graduated
on time was low—less than half of students—and similar for both
the treatment and comparison groups. The share of students in
the treatment group that graduated, excluding discharges, was
46.2 percent while the share of students in the comparison group
that graduated was slightly higher at 47.3 percent, though this
difference was not statistically significant. The difference
between the treatment and comparison groups was similarly small
for the other outcomes—with just a 1 to 2 percentage-point
difference. The difference between the two groups in the shares
of students who dropped out was not statistically significant.
A more detailed breakdown of student outcomes by cohort is
provided below in Table 4. The increasing trend in the share of
graduates between the three grade cohorts reflects the fact that
more students in tenth and eleventh grades that would have
dropped out had already done so by the time the phaseout was
announced. Similarly, the shares of students who were discharged
or dropped out were much larger for the ninth grade cohort than
for the tenth and eleventh grade cohorts because the latter two
cohorts were already whittled down to mainly students who were
on track to graduate or making progress towards graduation.
|
Table 4: Four-Year Student Outcomes by Cohort
|
|
Final Outcome
|
Ninth
|
Tenth
|
Eleventh
|
|
Treatment
|
Comparison
|
Treatment
|
Comparison
|
Treatment
|
Comparison
|
|
Discharges
|
20.5%
|
20.6%
|
12.6%
|
12.3%
|
6.2%
|
3.9%
|
|
Dropouts
|
49.0%
|
47.4%
|
29.6%
|
28.7%
|
8.5%
|
8.7%
|
|
Still Enrolled
|
17.0%
|
18.0%
|
19.8%
|
19.8%
|
17.0%
|
15.9%
|
|
GED
|
2.4%
|
3.4%
|
3.3%
|
1.9%
|
0.6%
|
0.4%
|
|
Graduated
|
31.5%
|
31.2%
|
47.2%
|
49.6%
|
73.9%
|
75.0%
|
|
Local Diploma*
|
60.5%
|
36.4%
|
61.7%
|
48.9%
|
60.0%
|
51.2%
|
|
Regents Diploma*
|
39.5%
|
63.6%
|
38.3%
|
51.1%
|
40.0%
|
48.8%
|
|
SOURCE: IBO analysis of Department of Education data
NOTE: *These are the reported shares of only those graduates that
received local or Regents diplomas.
New York City Indpendent Budget Office
|
Regression analysis, presented below, indicates that the
observed differences between the treatment and comparison groups
for graduates were statistically significant only when taking
into account the type of diploma a graduate received. A closer
look at the type of diploma that students received showed that
students in the treatment group were far more likely to receive
a local diploma—more than 60 percent of graduates received a
local diploma. The difference between the treatment and
comparison group for each cohort was also striking. For the
ninth grade students, 60 percent of the graduates in the
treatment group received a local diploma and 40 percent received
a Regents diploma. For ninth graders in the comparison group,
the results were the opposite. In tenth and eleventh grades, the
comparison group was evenly split between local and Regents
diplomas but students in the treatment group were far more
likely to get a local diploma—roughly 60 percent did so.
Regression Analysis
In order to test whether these differences between the two
groups of students were statistically significant, IBO used
regression analysis to determine if students in the treatment
group were more or less likely to graduate than students in the
comparison group. We also tested if the type of diploma was
significantly different: Were students in the treatment group
significantly more likely to receive a local diploma and
significantly less likely to receive a Regents diploma? We first
looked at the impact on all ninth, tenth, and eleventh graders
and controlled for grade level in the regression, then looked at
the impact by cohort.
The regressions aimed to predict a student’s probability of
graduating (in some cases also taking into account the type of
the diploma earned), controlling for the student’s
characteristics at the time of the announcement and the
student’s status in the treatment or comparison group. We report
the odds ratios rather than the regression coefficients. The
odds ratio corresponding to a particular independent variable
shows the effect of that variable on the relative probability
that the outcome (dependent) variable will happen, controlling
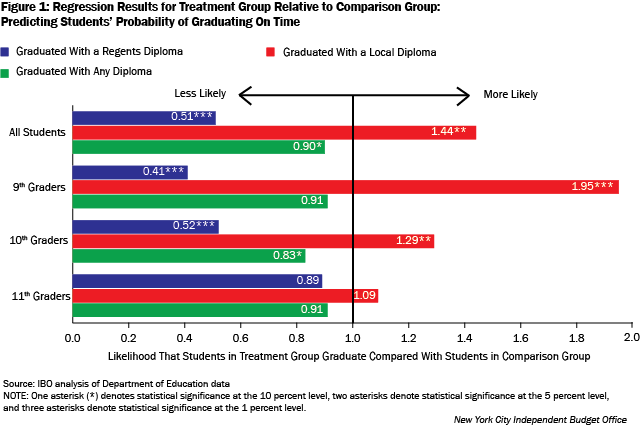
for other factors. Figure 1, below, displays results for
students in the treatment group. The numbers represent the
likelihood that students in the treatment group would attain the
same outcome as students in the comparison group. For example,
the results indicated that a student in the treatment group was
90 percent as likely to attain any diploma as students in the
comparison group (though the difference was only weakly
significant in statistical terms). Figure 1 also breaks down the
results by grade cohort. The full regression results are
provided in the appendix.
The regression results indicated that a student in the treatment
group was no more likely to graduate in general compared with a
student in the comparison group, but was more likely to graduate
with a local diploma and was less likely to graduate with a
Regents diploma. This finding also held true when considering
ninth and tenth graders separately. The contrast in the type of
the diploma obtained between the treatment and comparison groups
was greatest for ninth graders, and statistically significant
for ninth and tenth graders.
Treatment students were only 51 percent as likely as comparison
group students to attain a Regents diploma and were 144 percent
as likely to attain a local diploma. This finding was even
larger in magnitude for ninth graders, where students in the
treatment group were less than half as likely to attain a
Regents diploma and almost two times as likely to attain a local
diploma as students in the comparison group. There was also a
significant difference for tenth graders in the treatment group,
who were only 52 percent as likely to attain a Regents diploma
and 129 percent as likely to attain a local diploma. Notably,
there was no statistically significant difference for eleventh
graders for any graduation outcome, which seems reasonable
considering that by the time the school phase out was announced,
those students were already very close to their expected
graduation date.
Regents Examination Scoring Post-Announcement
To further examine the type of the diploma that students
obtained, IBO looked at the distribution of Regents exam test
scores in the post-announcement period for treatment and
comparison students in the five main areas: English, math,
science, world history, and U.S. history. In a
prior report, IBO
documented the high incidence of students scoring exactly a 65
on the Regents exam, the passing grade for a Regents diploma.
Similarly, here we looked at the incidence of students scoring
exactly a 55 (passing at the local diploma level) or a 65 by
treatment status. Generally, there were large spikes in the
number of students scoring exactly a 55 and 65 among both
treatment and comparison students in all subjects. The spike was
more pronounced at 65 than at 55, likely reflecting the fact
that the local diploma was being phased out during that time.
Recall that our treatment and comparison groups include students
who have moved on to other schools subsequent to the closing
announcement, so these distributions are not for specific
schools, but for specific cohorts of students.
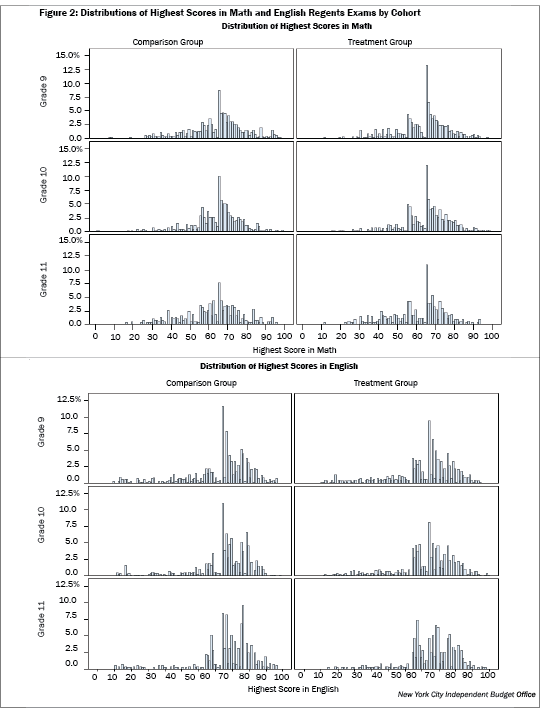
As shown in Figure 2, there were clear patterns in certain
subjects where students in either the treatment or comparison
group tended to score exactly a 55 or 65 more frequently.
Students in the treatment group scored both 55 and 65 more
frequently than students in the comparison group in math,
especially ninth graders. In English, science, and world
history, students in the treatment group were more likely to
score 55 and students in the comparison group were more likely
to score 65.9
Except for math, there were some differences by subject as far
as which of the groups (treatment or comparison) was more likely
to score exactly a 55 or 65. Among ninth graders, those in the
treatment group tended to score 55 more frequently in world
history and U.S. history whereas students in the comparison
group tended to score 65 more frequently in world history and
science. Among tenth graders, those in the treatment group
tended to score 55 more frequently in English and science while
those in the comparison group tended to score 65 more frequently
in English and world history. There were fewer significant
differences among eleventh graders, though students in the
comparison group tended to score 65 more frequently in English
and U.S. history. Since we only tracked eleventh graders for one
additional year after the announcement was made, it was not
surprising that such patterns were not as evident.
While we cannot discern the reasons behind this trend in our
sample, city and state officials also had sufficient concern
about the high incidence of students scoring exactly the passing
scores on the Regents exams and have subsequently implemented
changes to reduce its incidence. In February 2012, the DOE
reported that in an effort to improve the integrity of its data,
schools would no longer score their own students’ Regents
exams.10
College Readiness Among Graduates
For those graduates who received either a local or Regents
diploma, IBO also examined the share that graduated college
ready in one or both subjects (English and math). Students
who scored at least a 75 on the English Regents and at least an
80 on the math Regents are generally considered “college ready.”
Based on a
2010 study conducted for the New York State Education
Department, students who were deemed college ready according to
this definition were likely to earn at least a grade of C or
better in college-level courses in those subjects.
Only 42.6 percent of local or Regents diploma graduates in the
combined treatment and comparison sample were deemed college
ready in at least one or both subjects; in most cases those
students were college ready only in English. In all, 36.5
percent were college ready in English, but just 15.3 percent
were college ready in math. And very few—9.2 percent—were
college ready in both subjects.
There was a larger share of local or Regents diploma graduates
that were college ready in the comparison group compared with
the treatment group. The difference between the two groups was
statistically significant with about 45 percent of graduates in
the comparison group deemed college ready in at least one or
both subjects versus less than 40 percent of graduates in the
treatment group. The difference between the treatment and
comparison groups was larger for those college ready in
English—there was a 7.6 percentage-point statistically
significant difference between the treatment group (32.6
percent) and the comparison group (40.2 percent). In math,
however, there was a difference of just 1.0 percentage point
between the treatment group (14.8 percent) and the comparison
group (15.8 percent). Among students that were college ready in
only one subject, we found statistically significant differences
between the comparison and treatment groups. There was a smaller share of students in
the treatment group who were college ready in English only and a
larger share of students in the treatment group who were college
ready in math only. There was also a statistically significant
difference in the share of students in the two groups who were
college ready in both subjects; the share was greater for the
comparison group.
|
Table 5: Percent of Regents or Local Graduates Who Were College
Ready
|
|
|
Treatment
|
Comparison
|
Total
|
|
English
Only
|
25.2%
|
29.4%**
|
27.3%
|
|
Math
Only
|
7.3%
|
4.9%***
|
6.1%
|
|
Both
English and Math
|
7.5%
|
10.8%***
|
9.2%
|
|
English, Math, or Both
|
39.9%
|
45.1%***
|
42.6%
|
|
English
With or Without Math
|
32.6%
|
40.2%***
|
36.5%
|
|
Math
With or Without English
|
14.8%
|
15.8%
|
15.3%
|
|
SOURCE:
IBO analysis of Department of Education data
NOTE: One
asterisk (*) denotes statistical significance at the 10
percent level, two asterisks denote statistical
significance at the 5 percent level, and three asterisks
denote statistical significance at the 1 percent level.
New York City Independent Budget Office
|
Credit Recovery
Under the Department of Education’s credit recovery program,
struggling students are allowed to earn make-up credits for
courses they have failed after completing “targeted, intensive
instruction” in particular subjects.11 The use of credit
recovery increased steadily over the years covered in this
analysis, with the percent of high school students citywide with
at least one credit recovery attempt ranging from 3.7 percent in
2007-2008 to 9.2 percent in 2009-2010.12 During this time,
critics argued that more frequent use of credit recovery in some
schools was artificially boosting graduation rates.13 An
internal audit found that the rigor of coursework for students
who passed courses using credit recovery may have been less than
for those students who passed by traditional means.14
In this study, IBO found that a small share of Regents or local
diploma graduates in the sample of treatment and comparison
students—just 4.1 percent—used credit recovery in English, math,
social studies, science, or a foreign language. However, credit
recovery was three times more prevalent among graduates in the
treatment group compared with graduates in the comparison group.
There was a statistically significant difference between
graduates in the two groups in the propensity to use credit
recovery in a core course. More than 6 percent of graduates in
the treatment group—86 students—used credit recovery in a core
course; in the comparison group, 28 graduates (2.0 percent) did
so. Similar to efforts to improve data integrity for Regents
exam scoring, the New York State Education Department has since
implemented more stringent requirements for students’ use of
credit recovery. The changes included: making the opportunity
available only to those students who regularly attended class;
limiting its use to no more than three credits per student;
limiting the time frame only to courses within the past year;
and setting strict standards for all online credit recovery
programs.15
Similar Results: Second Cohort of Schools Phased Out
IBO replicated the analysis for a second and more recent cohort
of large comprehensive, low-performing high schools announced
for phase out during the 2008-2009 school year and found similar
results in terms of graduation rates and differences in the type
of the diploma earned. The three phaseout schools were Bayard
Rustin High School (Bayard Rustin), Louis D. Brandeis High
School (Brandeis), and Franklin K. Lane High School (Lane).
Bayard Rustin and Brandeis were located in Manhattan—in Chelsea
and the Upper West Side, respectively; Lane was located in
Cypress Hills in Brooklyn near the Queens border. IBO used a
similar but amended matching methodology to select an
appropriate comparison sample for this cohort of phaseout
schools. For more details on our methodology, please see the
appendix.
Students’ final four-year outcomes yielded similar results to
the previous cohort: The shares of graduates in the treatment
and comparison groups were low (below 50 percent), but this time
student-level regressions found the difference to be
statistically significant. The final four-year outcomes showed
that the share of graduates in the treatment group (44.6
percent) was significantly lower than the share of graduates in
the comparison group (47.2 percent). The differences between the
two groups were also statistically significant when considering
students’ grade level and the type of their diplomas.
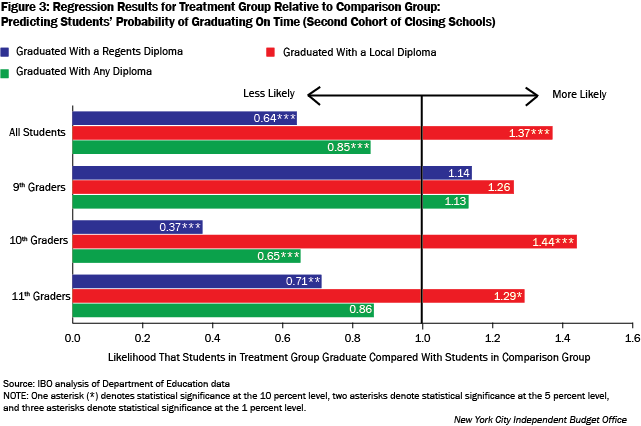
Student-level regressions on the full sample of 7,504 treatment
and comparison students, controlling for student demographics,
showed that students in the treatment group were 85 percent as
likely to graduate as were students in the comparison group (see
Figure 3 below). The magnitude of that difference was largest
and statistically significant only for tenth graders—tenth
graders in the treatment group were 65 percent as likely as
tenth graders in the comparison group to graduate on time.
As in the prior cohort, students in the treatment group were
more likely to graduate with a local diploma and less likely to
graduate with a Regents diploma; these results were
statistically significant for the entire cohort, although when
looking by grade the differences were significant only for tenth
graders. Generally, students in the treatment group were 137
percent as likely to graduate with a local diploma and 64
percent as likely to graduate with a Regents diploma. There was
no significant effect for ninth graders in this cohort,
presumably because first-time ninth graders could no longer
obtain a local diploma. Tenth grade students were 144 percent as
likely to obtain a local diploma and 37 percent as likely to
obtain a Regents diploma. For eleventh graders, the difference
for local diploma graduates was only marginally significant, but
the difference for Regents diploma graduates was statistically
significant—students in the treatment group were 71 percent as
likely to graduate with a Regents diploma.
Conclusion
Historically, there has been evidence that there are long-term
positive effects of closing failing high schools on the overall
quality of New York City’s public school system, although much
of this research has focused on the performance at schools that
replaced the closed schools. This study focused on the students
who were attending large comprehensive low-performing high
schools when their phase out was announced—the treatment
group—along with a comparison group of students matched on the
basis of school-level and student-level characteristics.
Based on IBO’s analysis of two cohorts of treatment and
comparison students—one based on schools selected for phase out
in 2006-2007 and their comparison schools and the second based
on schools from the 2008-2009 round of closures and their
comparison schools—there were some negative impacts on the
students in the treatment groups. There was either no impact
(for the 2006-2007 cohort analysis) or a negative impact (for
the 2008-2009 cohort analysis) on a student’s probability of
graduating on time. For both cohorts, however, there was a
significant negative impact on the type of the diploma obtained
by students. Those in the treatment groups tended to earn a
local diploma more often and a Regents diploma less often. In
both cohorts of closed schools, the impacts on tenth graders
were statistically significant. In the earlier cohort, the
impacts on ninth graders were also significant. The impacts on
eleventh graders were more muted, as expected since they were
already close to their expected graduation date at the time of
the announcements (though those in the second cohort were less
likely to get a Regents diploma).
The recent Research Alliance study looked at the impact of phase
outs on first-time ninth graders and they found no significant
impact on students’ graduation rate or the type of diploma they
earned. Their study focused on the large high schools that began
phase out from 2003-2004 to 2008-2009 (for Regents and local
diploma analyses, schools that began to phase out from 2005-2006
to 2008-2009 were included). IBO’s study focused on two cohorts
of large high schools that began to phase out in 2006-2007 and
2008-2009. We looked at the impact of phase outs on all ninth,
tenth, and eleventh graders who attended those schools when the
phaseout was announced and we also found no significant impact
on students’ probability of graduating on time in the 2006-2007
cohort analysis. We did, however, find that students in the
2008-2009 analysis were significantly less likely to graduate on
time. Additionally in both cohorts of phaseouts, we found that
students in the treatment group are more likely to earn a local
diploma and less likely to earn a Regents diploma. This trend
was most prominent among tenth graders in both phaseout cohorts.
Although the distinction between the local and Regents diploma
no longer exists, other measures also suggested poorer outcomes
for graduates in the treatment group compared with students in
the comparison group. Following the greater incidence of local
diploma graduates among ninth and tenth graders in the treatment
group, IBO observed that those students tended to score exactly
a 55 more frequently than students in the comparison group on
math, English, science, and world history Regents exams. Local
or Regents diploma graduates in the treatment group tended to
graduate college ready at a lower rate than students in the
comparison group, particularly in English. And though credit
recovery was used very infrequently in the sample as a whole, it
was about three times more prevalent among graduates in the
treatment group than among graduates in the comparison group.
While the DOE has since implemented policy changes to improve
data integrity by addressing the high incidence of both of these
issues, similar adjustments may occur in cases where schools
perceive pressure to help students graduate—which calls into
question the rigor of the diplomas graduates receive.
The shares of students who graduated on time in both the
treatment and comparison groups were very low: less than half of
the ninth, tenth, and eleventh graders attending those schools
at the time of the closing announcement did so. While there is
certainly a strong argument for closing low-performing high
schools, these results suggest that policymakers should be aware
that, in the past, students that attended those schools at the
time of the announcement tended to graduate with less rigorous
diplomas than those in otherwise similar schools that were not
being phased out.
Not all school districts phase out low-performing schools once
selected for closure. For example, in Chicago, the typical
approach is to close the school immediately and disperse the
students to other schools. Based on the results of this study,
it would be appropriate to give consideration to eliminating the
phaseout period here in New York. As Governor Cuomo has
increased pressure on the de Blasio Administration to close
long-struggling New York City high schools, such as Boys and
Girls High School—one of the comparison schools used in our
analysis—policymakers should be aware of the detrimental effects
on the educational outcomes of students attending schools being
phased out.16