ANALYSIS OF THE MAYOR'S EXECUTIVE BUDGET FOR 1998
Table of Contents
Chapter 1. Overview
Chapter 2. Revenue Estimates
CHAPTER 3. Expense Budget
CHAPTER 4. Major Issues
APPENDIX A. Gap Sheet Details
APPENDIX B. Major Contributors to the Revenue and Expenditure Projections
Chapter
1
Overview
As required by Section 252 of the New York City Charter, the Independent
Budget Office (IBO) has prepared this analysis of the Mayor's
executive budget for 1998. In February and March, IBO issued
two reports analyzing New York City's long-term fiscal outlook
and the Mayor's preliminary budget for 1998 and financial plan
through 2001. While the focus of those reports was to provide
a long-term view of fiscal issues facing the City, this report
centers on more immediate concerns-namely adoption of the City's
budget for fiscal year 1998.
Budget Summary
The executive budget reflects an improving local economy that
has allowed the Mayor to propose fewer spending reductions than
in recent years, though still substantial, coupled with the lowering
of certain taxes paid by New Yorkers. IBO projects that both
City-funded and overall spending for 1998 would remain at about
current year levels if the Mayor's budget is adopted in its entirety.
A number of issues identified by IBO in various reports including
our Analysis of the Mayor's Budgetary Proposals-prepared
in response to the preliminary budget-are addressed in the executive
budget.
- IBO projected additional public assistance (welfare) needs
of $103 million above amounts contained in the preliminary budget.
The executive budget contains an additional $99 million to fund
local welfare needs.
- For Medicaid, IBO projected an additional need of $281 million
above preliminary budget levels. The plan laid out in the executive
budget includes most of these additional funds.
- The Mayor is proposing changes to the Governor's School Tax
Relief (STaR) proposal aimed at providing residents of New York
City with their proportionate share of benefits under the initiative.
The Mayor's plan benefits from the accumulation of a record surplus
during the current fiscal year. Because accounting conventions
prohibit the explicit "rolling" of surplus funds from
one fiscal year to another, the City effects a roll by prepaying
future obligations (typically debt service) in the current fiscal
year, thus freeing up resources in the future. While it has been
the City's practice to effect a roll one year at a time, the executive
budget proposes to stretch its surplus over the next two years
by prepaying $856 million of 1998 debt in 1997 and rolling $200
million into 1999 by prepaying debt service for that year.
Given our projections of large budget gaps beyond 1998 (see Appendix A), the Mayor's plan takes a step in the right direction by proposing to use excess 1998 funds to reduce certain expenses in 1999. The City would benefit substantially, however, if it were to establish a rainy day fund to help stabilize revenues over the long run. Such a fund would permit the City to save surplus money from good economic years to help pay for City services in lean years.
The budget includes proposals to reduce the sales tax, the tax
on unincorporated businesses, and the commercial rent tax. The
fiscal prudence of cutting taxes given large out-year budget gaps
depends on the specific taxes under consideration and on the sustainability of the recently strong revenue growth. Although the chosen tax cuts are targeted to stimulate growth and decrease regressivity, the larger question is whether we will be able to afford them.
Much of the reduction in the out-year gap forecasts (as compared
with last year's forecast) is based on the assumption that the
City will sustain strong revenue growth over the plan period.
But the economy will turn down at some point, and, without the
benefit of a rainy day fund, whoever is mayor will likely face
the unenviable choice between increasing taxes in a slow economy
or reducing spending when it is needed most.
Revenue Forecast
With recent data on the national and local economies showing strong
economic growth in the current year, we have revised upward our
1998 tax revenue projection by $292 million above IBO's March
estimate. Our new forecast of $19.2 billion is $266 million higher
than baseline tax revenues projected in the Mayor's executive
budget.
As the U.S. economic expansion continues through its seventh straight
year, IBO expects the pace of economic activity to moderate and
inflation to remain under control as the Federal Reserve gradually
tightens monetary policy (see Chapter 2). Because it takes time
for changes in monetary policy to affect the economy, growth will
not begin to decelerate until the latter part of the current calendar
year.
With the City's economic fortunes closely tied to the nation's
as a whole, the local economy will remain robust for the current
year but will slow to a more moderate pace in 1998 and beyond.
Coupled with a return to a more historical level of profits in
the securities industry, IBO projects a slowing in the rate of
increase in the City's cyclically-sensitive sources of tax revenue.
Chapter 2 provides a detailed discussion of IBO's economic and
revenue forecast through 2001 along with our scoring of the Mayor's
tax reduction program. The chapter provides a discussion of each
of our independent projections of the nine largest taxes in the
City (property, commercial rent, mortgage recording, real property
transfer, personal income, general corporation, unincorporated
business, banking corporation, and sales). Our tax revenue forecast
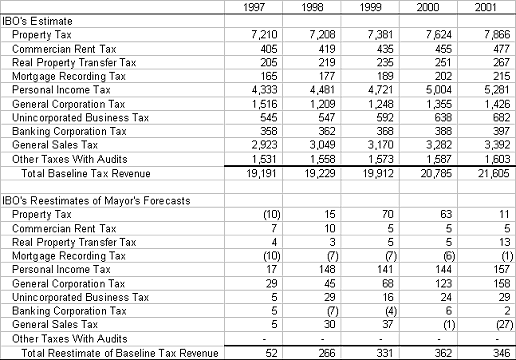
is summarized in Figure 1-1.
Figure 1-1.
Baseline Tax Revenue Forecast
(In millions of dollars) |
|
| |
IBO |
Mayor's budget |
Difference |
| 1997 |
19,191 |
19,139 |
52 |
| 1998 |
19,229 |
18,963 |
266 |
| 1999 |
19,912 |
19,581 |
331 |
| 2000 |
20,785 |
20,423 |
362 |
| 2001 |
21,605 |
21,259 |
346 |
SOURCE: Independent Budget Office.
|
In addition to tax revenues, the City also receives revenues from
State and federal grants and miscellaneous revenues. We estimate
that these revenues will be $15.1 billion in 1998 bringing total
revenues up to $34.3 billion.
Expense Budget
IBO estimates that total spending under the policies proposed
in the Mayor's 1998 budget would result in only modest changes
from 1997 levels. The budget does, however, propose $660 million
in agency gap closing initiatives for 1998. Total spending would
be about $34.2 billion, roughly the same level as in 1997.
- The portion funded with City-generated revenues would be $23.3
billion in 1998, slightly less than 1997 levels.
- Spending from State and federal categorical grants would be
$10.8 billion in 1998, slightly more than 1997 levels. IBO's
estimate of categorical aid, while similar to current year levels,
is $581 million higher than the levels forecast in the Mayor's
budget. Although some of this additional aid may be anticipated
by the Mayor, it will not be reflected in the budget until it
is received.
Chapter 3 provides a discussion and analysis of the Mayor's budget
proposals for major City agencies.
1998 Budget Issues
In Chapter 4 we present discussions of a diverse assortment of
issues with significant implications for the City's 1998 budget.
Topics include: the Mayor's proposed State agenda; public assistance
projections in the wake of welfare reform; Medicaid growth; recent
cost savings initiatives at the Health and Hospitals Corporation;
reorganization of the Administration for Children's Services;
student enrollment and school capacity; claims for prior-year
education aid from the State; Bronx garbage exportation in anticipation
of Fresh Kills landfill closure; the elimination of two fare zones
for public transportation; costs associated with making the City's
computer systems year 2000 compliant; and budgetary considerations
for 1997 campaign finance, uniformed personnel overtime, judgments
and claims, and labor costs.
Chapter
2
Revenue Estimates
Overview
Recent data on the national and city economies indicate that the
strong growth observed in calendar year 1996 has continued into
the early part of 1997. IBO's revised economic forecast is based
on the assumption that the Federal Reserve will gradually tighten
monetary policy, thereby slowing U.S. and local economic growth
late this year and into 1998. This lower rate of economic growth
will produce slower revenue growth in fiscal year 1998.
This chapter begins with a review of the economic forecasts for
the nation and the City. Next, IBO's baseline forecast of tax
revenues is presented. The baseline forecasts only consider current
law and policy-they do not take into account the Mayor's tax reduction
program and proportionate State tax relief proposal. After presenting
IBO's baseline and contrasting it with the Mayor's, the major
components of the tax reduction program and IBO's estimates of
the cost of each initiative are examined. Finally, the chapter
reviews miscellaneous and other revenue sources.
The Economic Outlook
Based on stronger than anticipated growth so far this calendar
year, IBO has revised upward its 1997 economic forecast for both
the U.S. and the City.1 To forestall any acceleration in future
inflation attributable to sustained above-capacity growth, the
Federal Reserve (Fed) is expected to tighten monetary policy gradually,
thereby setting the stage for slower growth later this year and
throughout 1998.
U.S. Economic Forecast
Fueled in part by continuing strength on Wall Street, real gross
domestic product (GDP) rose at an annual rate of 3.8 percent in
the final quarter of calendar year 1996 and surged a remarkable
5.6 percent (preliminary estimate) in the first quarter of 1997.
Unemployment rates for the nation as a whole fell to 4.9 percent
in April; ignoring changes in survey methods, this is the lowest
rate of U.S. unemployment since 1973. Despite sustained above-trend
economic growth, low rates of unemployment, and high levels of
capacity utilization, increases in consumer and producer prices
remain subdued.
In an effort to forestall any acceleration of inflation, in March
the Fed tightened monetary policy by raising the federal funds
rate-the interest rate banks are charged on overnight loans.
IBO's forecast for the U.S. economy is based on the assumption
that the Fed will continue slowly to raise short-term interest
rates during 1997. On the assumption that the Fed succeeds in
averting an acceleration in inflation, IBO forecasts that the
consumer price index for all urban consumers will rise 2.6 percent
in both 1997 and 1998 (see Figure 2-1).
Because the Fed is expected to tighten gradually, and because
it takes time for changes in monetary policy to affect output,
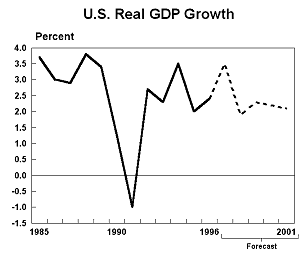
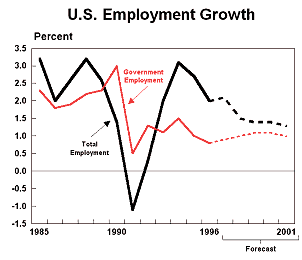
real GDP growth will only begin to decelerate during the second half of 1997. As a result, IBO projects that real GDP will grow 3.5 percent this year, followed by considerably slower growth of 1.9 percent in 1998. Employment growth is forecast to follow a similar pattern, rising 2.1 percent in 1997 and 1.5 percent in 1998, while the unemployment rate increases from 5.2 percent to 5.4 percent over the same period.
Figure 2-1.
U.S. Economic Outlook by Calendar Year
|
| |
Actual |
Forecast |
| |
1996 |
1997 |
1998 |
1999 |
2000 |
2001 |
| Real GDP |
Billions of 1992 dollars
Percent change, year over year |
6,907.2
2.4 |
7,146.6
3.5 |
7,284.8
1.9 |
7,452.7
2.3 |
7,617.1
2.2 |
7,780.0
2.1 |
| Personal Income |
| Percent change, year over year |
5.5 |
5.8 |
4.9 |
4.9 |
4.9 |
5.0 |
| Payroll Employment |
Millions of jobs
Percent change, year over year |
119.6
2.0 |
122.1
2.1 |
123.9
1.5 |
125.6
1.4 |
127.4
1.4 |
129.1
1.3 |
| Civilian Unemployment Rate |
| Percent |
5.4 |
5.2 |
5.4 |
5.4 |
5.4 |
5.5 |
| Consumer Price Indexa |
| Percent change, year over year |
2.9 |
2.6 |
2.6 |
2.7 |
2.7 |
2.7 |
| Thirty-year Treasury Bond Rate |
| Percent |
6.7 |
7.1 |
6.8 |
6.5 |
6.4 |
6.2 |
| Securities Industry Total Revenues |
| Percent change, year over year |
25.9 |
17.0 |
10.3 |
10.2 |
8.8 |
8.3 |
  |
| SOURCES: | Independent Budget Office; Securities Industry Association; U.S. Department of Commerce, Bureau of Economic Analysis; U.S. Department of Labor, Bureau of Labor Statistics; WEFA Group. |
| NOTES: | All data are annual values; growth rates are year over year.
a. Consumer price index for all urban consumers (CPI-U); 1982-1984
= 100. |
Despite a projected rise in long-term interest rates, IBO expects
robust 1997 growth in personal incomes and corporate profits to
buoy the financial sector. Earnings statements of major securities
firms suggest that first-quarter performance has remained strong.
IBO projects that total revenues of the securities industry
will rise 17.0 percent in 1997-solid growth, but well below the
industry's extremely rapid expansion in 1995 and 1996. In contrast,
a slower pace of economic activity in 1998 will cause securities
industry revenue growth to decelerate to 10.3 percent, just slightly
above its average annual rate of growth over the past decade.
The primary difference between IBO's forecast and OMB's is that
we project significantly stronger real GDP growth in 1997-3.5
percent as compared with 3.0 percent. It is interesting to note
that IBO's forecast of real 1997 GDP growth is slightly above
than the May Blue Chip consensus estimate of 3.3 percent, while
OMB's is slightly below.2
New York City Economic Forecast
IBO expects the City's pattern of economic activity over the next
few years to parallel that of the nation. Because growth isn't
projected to slow until later this year, the outlook for 1997
as a whole remains strong (see Figure 2-2). Solid expansion in
the securities industry will lead to growth throughout the local
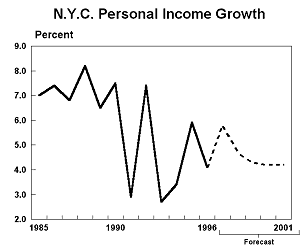
economy, with personal income generated in New York City expected
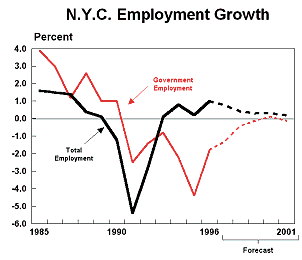
to rise a robust 5.8 percent and total City employment projected
to increase by nearly 26,000 jobs, or 0.8 percent.3
Preliminary evidence suggests that New York City's economy has
continued to grow strongly so far this year, with the City gaining
roughly 8,000 jobs from January through April.4Over the
same period, personal income tax withholding-another good indicator
of economic activity-increased 9.7 percent on a year-over-year
basis, nearly matching last year's rapid pace.
In contrast to the strength projected for 1997, IBO expects New
York City's economy to grow more slowly in 1998. City personal
income is forecast to rise 4.7 percent in 1998, while the rate
of employment growth is projected to be 0.4 percent-just half
that of 1997. Slower employment growth, coupled with increased
pressure on low-skill employment due to welfare reform, is projected
to increase the City's already high rate of unemployment by 0.2
percentage points to 9.2 percent in 1998.
Industries that are projected to add significant numbers of jobs
to New York City's economy in 1997 and 1998 include business services,
hotels, social services, education, retail sales, legal services,
construction, and multimedia. Although employment in healthcare-a
longtime source of strength in the New York City economy-is expected
to rise, its rate of growth will continue to slow due to hospital
restructuring. Similarly, securities industry employment growth
will weaken but remain positive, as the industry's profits retreat
from their record levels.
New York City employment is expected to decline in the manufacturing,
wholesale, banking, and insurance industries over the 1997 to
1998 period. IBO projects that the long-term decline in manufacturing
employment will accelerate in 1998 as economic growth slows.
Bank mergers and insurance industry restructuring are expected
to decrease employment in these important components of the City's
financial services sector. Declines in federal, state, and local
government sector employment are expected to moderate, with the
City losing nearly 7,000 government jobs in 1997 and roughly 2,000
in 1998.
Figure 2-2.
New York City Economic Outlook by Calendar Year
|
| |
Actual |
Forecast |
| |
1996 |
1997 |
1998 |
1999 |
2000 |
2001 |
| Personal Income |
| Percent change, year over year |
4.1P |
5.8 |
4.7 |
4.3 |
4.2 |
4.2 |
| Total Payroll Employment |
Thousands of jobs
Percent change, year over year |
3,357.7
1.0 |
3,383.7
0.8 |
3,397.1
0.4 |
3,408.7
0.3 |
3,417.7
0.3 |
3,426.0
0.2 |
| Government Sector Employment |
Thousands of jobs
Percent change, year over year |
533.8
-1.8 |
527.0
-1.3 |
525.1
-0.4 |
524.3
-0.2 |
524.8
-0.1 |
524.4
-0.1 |
| Retail Sales |
| Percent change, year over year |
3.0P |
3.1 |
3.4 |
2.8 |
2.6 |
2.6 |
| Civilian Unemployment Rate |
| Percent |
8.7 |
9.0 |
9.2 |
9.2 |
9.2 |
9.2 |
| Consumer Price Indexa |
| Percent change, year over year |
2.9 |
2.5 |
2.6 |
2.6 |
2.6 |
2.6 |
| Manhattan Asking Rental Rateb |
| Dollars Per Square Foot |
33.16 |
34.22 |
35.84 |
37.78 |
40.13 |
42.78 |
  |
| SOURCES: | Independent Budget Office; U.S. Department of Commerce, Bureau of Economic Analysis; U.S. Department of
Labor, Bureau of Labor Statistics; WEFA Group. |
| NOTES: | P. Preliminary 1996 figure. All data are annual values; growth rates are year over year.
a. CPI-U for the New York-Northern New Jersey region; 1982-1984
= 100.
b. Asking rental rate for prime Manhattan office space. |
IBO expects the City's real estate market to continue its recovery
from the prolonged slump of the early 1990s. Driven by employment growth and declining vacancy rates, attributable in part to the lack of new office building construction, asking rents for primary office space are forecast to increase by 3.2 percent in 1997 and 4.7 percent in 1998. The continuing tourism boom has spurred the construction and upgrading of hotel rooms, and has contributed to an increase in rents for retail space in primary shopping areas. In the residential sector, demand for both rental and owner-occupied apartments-particularly at
the higher end of the market-is expected to increase values and
spur new construction. In the conventional home market, the growth
in City employment is projected to contribute to increases in
median home sales prices of 4.5 percent in 1997 and 5.7 percent
in 1998.
Because of the close relationship between economic activity at
the national and local levels, IBO's forecast of stronger 1997
U.S. economic growth than projected by OMB also leads to a stronger
New York City economic forecast. Although both IBO and OMB forecast
slower City economic growth for 1998, it is interesting to note
that OMB's estimate of personal income growth is considerably
weaker than IBO's-3.9 percent as compared with 4.7 percent, respectively.
Baseline Tax Revenue Forecast
The record earnings of Wall Street firms in calendar year 1996
and their continued strong performance in the first half of this
year have pushed fiscal year 1997 revenues more than $1 billion,
or 5.8 percent, above the prior year. Growth has been particularly
strong in the personal and business income taxes. For 1998, IBO
estimates that revenue growth will stall, with total receipts
only 0.2 percent above 1997. This sharp decline in revenue growth
is largely attributable to IBO's forecast of slower economic growth
at both the national and local levels. Tax revenues are projected
to total $19.2 billion in 1998 and grow by an average of 4 percent
per year to reach $21.6 billion in 2001.
Throughout the forecast period, the cyclically sensitive unincorporated
business tax and the personal income tax show some of the strongest
growth, averaging 7.6 percent and 5.6 percent per year between
1998 and 2001, respectively. While growth in the real estate-related
transaction taxes average more than 6.5 percent for the same period
(largely due to growth in market values), the real property tax
itself continues to lag all other major taxes with annual average
growth under 3 percent, barely matching the rate of inflation.
General sales tax growth for the same years will average 3.8
percent, exceeding the average inflation rate by over a full percentage
point.
IBO's tax revenue forecast is based on independently developed
models for nine major taxes-real property, commercial rent, mortgage
recording, real property transfer, personal income, general corporation,
unincorporated business, banking corporation, and sales.5 Forecasts
for all other taxes, audit revenues, and tax-related PEGs are
adopted from OMB's projections shown in the Mayor's 1998 executive
budget.
The following sections review the baseline revenue projections
for those taxes independently modeled by IBO and contrast these
forecasts with those of OMB.
Real Property Tax
In 1998, property tax revenues are projected to remain virtually
unchanged from their 1997 level of $7.2 billion. For the three
subsequent years, revenues are projected to grow by approximately
3 percent per year, reaching $7.9 billion by 2001.
Property tax revenues are made up of payments for liabilities
under the current year's levy and payment of outstanding liabilities
from prior years. The 1998 levy will be based on the assessment
roll that was released by the Department of Finance in January
1997. Following Finance Department and Tax Commission adjustments
in response to taxpayer appeals, the roll becomes final in late
May 1997. The final 1998 assessment roll is expected to show
total taxable billable assessed value of $75.7 billion, an increase
of only 0.3 percent over the 1997 final assessment roll. Assessments
for Class 1 properties (one-, two-, and three-family homes) and
Class 2 (apartment buildings with more then three units) showed
growth of over 2 percent, while Class 4 (offices and other commercial) showed a decline in assessed value of 0.8 percent.
Figure 2-3.
IBO's Estimates of Baseline Tax Revenues (without Tax Reduction
Program)
(In millions of dollars)
|
 |
| SOURCE: |
Independent Budget Office. |
| NOTE: |
Numbers may not sum exactly due to rounding. |
The 1998 levy largely reflects the state of the real estate market
in calendar year 1996, a year in which recovery in the City's
real estate market lagged behind growth in the rest of the local
economy. IBO's forecast of continued growth in the City's economy
over the next several years is expected eventually to be reflected
in real estate market values, yielding steadily growing assessments
and tax levies for fiscal years 1999 through 2001, with the levy
increasing from $8.1 billion to $8.6 billion over that period.
Growth in assessments and tax levy account for only part of the
improvement in projected property tax revenues for the fiscal
years after 1998. A second key factor is a projected fall in
the delinquency rate-the portion of current year levy remaining
unpaid at the end of the year. Although stronger economic growth
accounts for some of the improvement, the City's sale of tax liens
has been a major contributor as well. Collections of outstanding
balances have grown as delinquent property owners paid up to avoid
having their property included the pool of liens being sold.
Given that the City's financial plan calls for annual sales of
tax liens, this behavioral change by taxpayers is expected to
become permanent. Therefore, the delinquency rate is projected
to remain at the 1997 level through 2001, nearly 50 percent below
its 1994 level.
The revenue growth due to the increase in the tax levy and the
decrease in the delinquency rate is partially offset by scheduled
increases in the costs of two recently enacted tax abatement programs.
The lower Manhattan commercial revitalization program includes
a partial property tax abatement for qualifying buildings with
new leasing activity. For 1998 the cost is projected to be $14
million, rising to $50 million in 2001.6 The coop and condo abatement,
which helps bring the tax burden on such buildings closer to the
burdens on Class 1 properties, is projected to increase from $8.5
million in 1997 to $70 million in 1998 and $120 million in 1999.7
IBO's estimates of the real property tax levy and revenues are
slightly higher than the Mayor's. The small differences-less
than 1 percent each year-are attributable to modest differences
in economic assumptions, with IBO's forecasts of market indicators
generally being higher than OMB's, and differing methodologies
for translating market value growth into assessment and revenue
growth. It appears that IBO's approach in the latter area is
more conservative than OMB's.
Property Related Taxes
Because of a series of tax reductions in recent years, commercial
rent tax (CRT) revenue has fallen by more than one-third since
1993 to $405 million in 1997. Nevertheless, underlying growth
in the tax base has remained strong and 1998 CRT collections are
forecast to reach $419 million, a 3.4 percent increase over the
prior year. Over the 1999 through 2001 period, thanks to rising
office rents and continued robust demand for Manhattan retail
space, revenue growth is expected to accelerate, increasing at
an average rate of 4.4 percent per year. Collections are projected
to increase from $435 million in 1999 to $477 million by 2001.
IBO's forecast for CRT collections is slightly higher than OMB's,
particularly in 1998, with a difference of 2.4 percent. The differences
are partially due to a slightly higher forecast for the balance
of 1997 and somewhat higher estimates on commercial rent levels
throughout the forecast period.
Collections from the real property transfer tax (RPTT) and mortgage
recording tax (MRT) often vary widely from year to year, because
of volatility in the City's real estate market. So far in 1997,
revenue growth for both taxes has been quite strong and final
collections are expected to be well ahead of initial projections,
although IBO forecasts that MRT revenues will fall $10 million
short of OMB's most recent upward revision. In 1998 this growth
is expected to continue: projected revenue is $219 million for
the RPTT and $177 million for the MRT.
For fiscal years 1999 through 2001, further increases in the number
and value of residential transactions combined with more modest
but still significant improvement in the commercial sector, will
help sustain continued growth in these two taxes. The RPTT is
projected to increase from $235 million in 1999 to $267 million
in 2001, which is $13 million above OMB's forecast for the final
year. For the same period, the MRT is forecast to grow from $189
million to $215 million. Although IBO's growth rate for MRT collections
is higher than OMB's, collections are expected to be lower throughout
the forecast period than forecast by OMB because of the projected
shortfall in the current year.
Personal Income Tax
Due to the strength of current collections, IBO has raised its
forecast of net personal income tax (PIT) receipts in 1997 by
$125 million. We now expect 1997 PIT revenues to equal $4,332
million, 10.8 percent greater than collections in the previous
year.
IBO has increased its 1997 revenue estimates for each of the three
major components of the PIT-estimated payments, final returns,
and withholding. The booming stock market has fueled capital
gains realizations, resulting in a 16.8 percent year-to-date (through
April) estimated payment receipts over the comparable 1996 period.
As a result, IBO has increased its forecast of 1997 PIT estimated
payments by $70 million. Similarly, taxpayers' final returns
payments have swelled, and we have boosted our forecast of 1997
PIT final returns by $35 million. Securities industry firms'
record-high profits in calendar year 1996 produced substantial
year-end bonuses for industry employees, and IBO expects 1997
withholding receipts to be 8.3 percent greater than in 1996.
Since the strength of withholding collections due to year-end
bonuses was already evident earlier in the year, IBO has increased
its withholding forecast by only $4 million.
Economic growth and the profits of securities firms are expected
to taper off by the end of calendar year 1997. However, IBO anticipates
that taxpayer liability will be strong enough to lead to further
increases in estimated payments and withholding in fiscal year
1998, offsetting a projected increase in refunds and expected
decline in final returns payments. Net PIT revenues for the year
are now forecast to grow by 3.4 percent to equal $4,480 million.
This estimate is $123 million greater than IBO's February forecast,
with increased projections of estimated payments and final returns
accounting for almost all of the total upward revision.
While IBO's 1997 PIT forecast exceeds OMB's by only $17 million,
in 1998 the difference grows to $148 million. Significantly higher
projections for each of the three major components of the tax
account for the 1998 variance. OMB's lower 1998 forecast results
from its projection of slower growth of both the national economy
and local personal income in calendar year 1997.
For the remaining years of the forecast period, IBO expects PIT
growth to pick up, averaging 5.6 percent annually. The average
rate of growth estimated by OMB is only slightly higher, and IBO's
forecasts remain greater than OMB's by roughly the same or slightly
more than the 1998 difference.
General Corporation Tax
Continued record-high levels of Wall Street profits and strong
national and local economic growth have caused general corporation
tax (GCT) collections to soar this fiscal year. This has prompted
IBO to boost its forecast of 1997 GCT revenues by $107 million-a
significant increase over our February revenue forecast. On the
basis of collections so far this year and an analysis of historical
seasonal patterns, we project net GCT revenues will equal $1,516
million in 1997, 34 percent greater than 1996 collections. Moreover,
this tremendous 1997 increase follows solid GCT growth of 12 percent
growth in 1996.
Sustained economic growth also has raised IBO's projection of
1998 revenues, though not by as much ($46 million). But with
growth in the economy and in revenues of securities firms expected
to moderate in the latter half of calendar year 1997, corporate
tax liabilities will decline, leading to lower GCT revenues in
fiscal year 1998.
As a result, IBO continues to forecast a substantial drop in GCT
receipts, to $1,209 million in 1998. Year-to-year changes in
GCT receipts of the magnitudes being predicted are hardly unprecedented.
Beyond slower 1998 economic growth, there are a number of reasons
why IBO expects GCT payments to decline so sharply. While gross
tax payments of corporations are projected to decline, refunds
are expected to increase. The growing impacts of recently enacted
policies, such as last year's redefinition of the income-plus-compensation
method of determining tax liability, also explain part of the
expected revenue decline from 1997 to 1998. Yet even when GCT
collections are adjusted for the effects of policy changes, the
decline in revenues is forecast to be 15 percent. Finally, the
consistent under-prediction of 1997 GCT revenues by a number of
econometric models suggests that many corporations are over-paying
current liability and thus will be able to apply their credit
for such overpayments toward 1998 liabilities.
While OMB also increased its projection of 1997 GCT revenues by
$123 million, its current forecast falls short of IBO's by $29
million. Likewise in 1998, IBO's forecast is $45 million greater
than OMB's, largely because IBO predicts somewhat greater economic
growth and securities industry revenues in calendar year 1997
than does OMB. For the out-years of the forecast period, IBO
projects more moderate revenue growth, averaging 5.7 percent annually,
and IBO's forecasts remain above OMB's in these years.
Unincorporated Business Tax
Current receipts of the unincorporated business tax (UBT) also
are stronger in comparison to both 1996 collections and to what
had been expected in March. As with the GCT, prolonged economic
expansion and the health of the securities industry (which accounts
for 14 percent of UBT liability), are the underlying causes of
the recent strength in UBT receipts. IBO has increased its forecast
of 1997 net UBT revenues by $17 million, to $545 million. The
new forecast represents 10 percent growth over 1996 revenues-a
second year of solid expansion-and it is $5 million greater than
OMB's latest projection.
For 1998, IBO now forecasts $534 million in net UBT revenues,
a 5.2 percent increase over 1997. Much of the increase is due
to the recently available option for small businesses to organize
as limited liability companies (LLC), whose partners pay the UBT,
instead of corporations subject to the GCT. When collections
are adjusted for LLC growth and other expected policy effects,
UBT revenues are expected to remain flat. Slower growth of the
local economy and a decline in securities industry profits explain
the anticipated weakness of 1998 collections. In contrast to the
IBO forecast, OMB now expects underlying (policy-adjusted) UBT
revenues to decline by over 5 percent, and its forecast for fiscal
year 1998 is $28 million lower than IBO's.
After 1998, UBT growth is expected to pick up again, averaging
7.7 percent per year over the 1999-2001 period. IBO's forecasts
exceed OMB's by $15 million to $30 million per year.
Banking Corporation Tax
Unlike the GCT and UBT, collections of the banking corporation
tax (BCT) in recent months have failed to match prior expectations.
Collections this past March, a month that typically accounts
for a large proportion of banks' annual tax payments, were nearly
30 percent lower than the year before. Weak collections have
prompted IBO to reduce its 1997 forecast of net BCT revenues by
$30 million, to $358 million. This is slightly less than the
$361 million collected in 1996 and exceeds OMB's forecast by $5
million.
IBO's 1998 forecast, based on an analysis of long-term trends
in the economy and the BCT itself, calls for resumption of moderate
revenue growth. Net BCT receipts are projected to equal $362
million, $7 million less than OMB's forecast. Growth is expected
to pick up somewhat in the remaining years of the forecast period,
averaging 3.1 percent annually. The IBO forecasts are roughly
comparable to OMB's, differing by no more than $6 million in any
year.
In all likelihood, the pattern of BCT collections in the coming
years will be much less stable than either the IBO or OMB forecasts
indicate. During the last decade, BCT receipts have increased
by as much as 45 percent and decreased by as much as 50 percent
from one year to the next, and these swings by their very nature
have been extremely difficult to anticipate. These forecasts,
therefore, should be interpreted as a guide to the total amount
of BCT revenue the City will receive over the forecast period
and not as a prediction of specific year-to-year changes.
General Sales Tax
General sales tax revenues have shown exceptionally strong growth
in 1997 and are projected to end the year at $2,923 million, a
7.7 percent increase over 1996. This is also a full 5.1 percentage
points over the inflation rate, a real growth margin that has
been exceeded only twice since 1980. Excluding the impact of the
Mayor's proposed clothing sales tax cut, sales tax revenue growth
will moderate in 1998 and over the following three years, but
will continue to outpace the rate of inflation. Projected 1998
revenues will be $3,049 million, 4.3 percent above 1997. Over
the following three years sales tax revenues are projected to
rise 4.0 percent, 3.5 percent, and 3.4 percent, bringing sales
tax collections to $3,392 million by 2001.
Retail apparel sales is the largest single source of general sales
tax revenues, accounting for about 11 percent of reported taxable
sales and purchases in New York City. Next in importance are
utilities (9 percent), eating and drinking places (9 percent),
and business services (8 percent in 1996, rising to an estimated
9 percent in 1998).8 During the 1980s and early 1990s the rapid
growth in taxable business services was offset by slow growth
in taxable manufacturing. But manufacturing is now too small
a component to exert much of a drag on the overall growth rate
of taxable sales. The increasing impact of business services
is reflected in our forecast of stronger growth of sales tax revenues
relative to personal income than has historically been the case.
IBO's baseline sales tax revenue projections exceed OMB's by $5
million in 1997 and $30 million in 1998. By 2001, however, IBO's
forecast is $27 million below OMB's. This largely reflects our
local economic forecast, which shows somewhat stronger near-term
economic growth and somewhat slower growth in the out-years.
Other Taxes and Tax Audits
For all other taxes, tax audit revenue, and Department of Finance
PEGs, IBO has adopted the projections presented in the Mayor's
executive budget.9 In 1998, these sources are forecast to account
for $1.5 billion and by 2001 they are expected to yield $1.6 billion.
The largest of the "other" taxes are the utility ($216
million) and hotel occupancy taxes ($172 million). Tax audits
are projected to yield $676 million in 1998, and $677 million
in each of the following three years. Almost 70 percent of audit
receipts are GCT and BCT payments, a significant addition to the
forecasted amounts of net tax collections shown above.
Tax Reduction Program
The Mayor's tax reduction program has been scaled back between
the preliminary and executive budgets. As shown in Figure 2-4,
IBO's projection of the total cost of the revised program is $240
million in 1998, $13 million lower than the cost of the program
outlined in January. (See IBO's March 1997 report for greater
detail on the specifics and cost estimates of the initiatives
included in the preliminary budget.) The three largest initiatives
are a sales tax exemption for clothing under $500, an increase
in the UBT credit, and additional reductions in the CRT. The
budget also includes the potential tax reductions that could occur
if the City's share of the proposed statewide property tax cuts
were modified to bring the City its proportionate share of total
benefits.
Clothing Sales Tax Exemption
The centerpiece of the Mayor's 1998 tax program is a proposal
to eliminate (effective December, 1997) both State and City sales
taxes on apparel items priced under $500. This proposal has been
carried over unchanged from the preliminary budget to the executive
budget. It is supported by the argument that a clothing tax
exemption would provide especially strong tax relief to lower-income
households (who spend relatively more on apparel) and would increase
New York City's retail competitiveness, especially with respect
to New Jersey, which already exempts clothing from its sales tax.
IBO's reestimate of the direct costs of the tax cut is based on
forecasts from Census of Retail Trade data on product sales, and
assumes that 91 percent of apparel sales will fall under the $500
cutoff for the tax exemption.10 Our revised forecast is for $6.9
billion in under-$500 taxable apparel sales in 1998, rising to
$7.6 billion in 2001. Reflecting IBO's updated forecasts of economic
growth and total taxable sales, these clothing sale projections
are somewhat higher than those contained in our March report.
Figure 2-4.
IBO's Reestimate of the Mayor's Tax Reduction Program
(In millions of dollars)
|
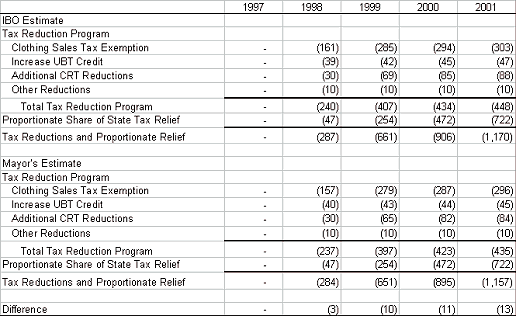 |
| SOURCE: |
Independent Budget Office. |
| NOTE: |
Other tax reductions include a real property transfer tax
exemption, a vault charge elimination, and an elimination of the coin-operated amusement device tax. |
Based on these revised under-$500 sales projections, IBO estimates
that the proposed clothing sales tax cut would reduce New York
City sales tax revenues by $161 million in 1998 and $285 million,
$294 million, and $303 million over the following three years.
IBO's direct cost projections are $4 million to $7 million higher
than the estimates contained in the executive budget.
IBO's March report also included a preliminary estimate of the
impact of the proposed clothing sales tax cut on retail sales,
economic output, and other City tax revenues. A more in-depth
analysis of the dynamic economic and revenue effects of the proposed
cut will be presented in a forthcoming fiscal brief. This report
will also estimate the costs of alternative clothing tax cut proposals
now under consideration in Albany.
Unincorporated Business Tax
The Mayor's executive budget includes a proposal to increase the
credit allowed unincorporated business tax (UBT) filers with relatively
small liabilities. Since the preliminary budget was released
in January the dollar value of the proposed credit has been reduced,
cutting both the cost of the proposal and the number of taxpayers
who benefit.
Under the revised proposal, the credit would eliminate the tax
for all filers with pre-credit liabilities up to $2,600. Partnerships
and sole proprietorships with pre-credit liabilities between $2,600
and $5,000 would receive a partial credit that phases out as liability
approaches $5,000. Taxpayers whose business incomes before allowable
deductions or exemptions are $75,000 or less would have no UBT
liability. Those with business incomes up to $135,000 would have
their liabilities reduced by the partial credit.
Using data furnished by New York City's Department of Finance,
IBO estimates that the proposed increases in the full and partial
credit would reduce UBT revenues by $39 million in 1998, and by
$42 million, $45 million, and $47 million in years 1999 through
2001. An estimated 16,000 out of 31,000 UBT payers would have
their tax liability eliminated. (This is 5,000 less than under
the proposal presented in January.) More than 7,000 more would
have their taxes reduced. These estimated costs are quite similar
to the projections presented in the Mayor's executive budget (see
Figure 2-4). The slightly lower costs in the first two years
are attributable to technical differences in projection methods.
The higher cost in the final year reflects IBO's more robust
growth forecast for the UBT over time.
Sole proprietors, the majority of whom are City residents, account
for most of the UBT filers with low liabilities and thus would
receive most of the tax savings. Therefore, the proposed increase
in the UBT credit would primarily benefits residents. Partnerships-which
account for over 90 percent of UBT revenues-generally have much
higher liabilities that are well above the credit threshold.
Commercial Rent Tax
The tax reduction program includes two proposals that would continue
the recent trend of major reductions in the CRT. Under current
law, commercial tenants with rents below $53,333 are exempt from
the tax.11 The first proposal, which would become effective June
1, 1997, would raise the exemption to $100,000, with a sliding
scale credit to phase in the tax for rents between $100,000 and
$140,000. Using rent distributions supplied by the Department
of Finance, IBO estimates that the new threshold would exempt
9,200 taxpayers and that the sliding scale would benefit approximately
3,300 others. By removing from the tax rolls smaller tenants
for whom the tax burden is likely to be greater, this proposal
would help reduce the regressivity of the CRT.
The second proposal is to reduce the effective tax rate by 13.33
percent.12 (Under proposals included in the preliminary budget,
the effective tax rate would have been decreased by 33 percent.)
This across the board tax cut would take effect in September
1998; by starting the tax cut part way through the CRT liability
year, less revenue is lost in the first year.13 However, such mid-year
changes add considerable complexity for both taxpayers and the
City. Although all taxpayers receive the same percentage reduction
in their tax liability, the dollar value of the cut is concentrated
at the top. Roughly six percent of all remaining taxpayers-those
with rents over $1 million-would receive 64 percent of the tax
cut.
In 1998, when only the higher threshold would be in effect, the
cost is estimated at $30 million. Beginning in 1999, when the
lower effective tax rate would also be in effect for part of the
year, the cost grows to $69 million. By 2001, the cost is estimated
at $88 million. As shown in Figure 2-4, IBO's estimates for 1999
and beyond are slightly higher than the Mayor's, primarily due
to differing assumptions about the level of commercial rents.
Proportionate State Tax Relief
The Mayor's tax reduction program includes a demand that the City
receive a "proportionate share" of the new education
financing aid the Governor proposes to distribute under his School
Tax Relief (STaR) initiative. The executive budget proposes to
match the any new school tax relief aid with equivalent reductions
in the City's property and personal income taxes. The STaR program
and the Mayor's counter-proposal would both be revenue-neutral
for the City. In each case, new State-aid would be used to make
up revenue foregone through tax reductions.
For presentation in the executive budget, the additional State
aid has already been included in the unrestricted intergovernmental
aid line, offsetting the proposed reduction in tax revenues.
This avoids affecting the balance of the budget. Depending on
the fate of the Mayor's proposal, some or all of additional aid
revenues may have to be removed from one side of the budget, in
which case the associated tax reductions would also have to be
trimmed or eliminated.
Under STaR, resident home owners across the State would receive
a partial exemption against the school portion of their local
property tax. State funds would then be used to replace the revenue
lost by local school districts. IBO has estimated that the City
would receive less than 9 percent of statewide tax relief under
STaR.14 This share is far below any reasonable benchmark for equitable
distribution of benefits: the City raises approximately 30 percent
of all local revenues dedicated to education across the State;
it educates more than 37 percent of the State's students (with
a higher proportion of them requiring more expensive special education
programs than elsewhere in the State); it has approximately 40
percent of the State's population; and it accounts for nearly
45 percent of the State's economy and tax base.
The executive budget chooses 40 percent as the appropriate benchmark
and estimates that the City should receive $47 million in 1998
as its share of the new tax reduction aid the Governor proposes
to distribute. With the statewide aid under STaR growing to over
$1.8 billion by 2001, the Mayor's budget indicates that the City
should receive $722 million in that year, using the same benchmark
share of 40 percent. The executive budget identifies several
tax reduction initiatives that would be possible if the STaR program
is modified to bring the City a more appropriate share of the
statewide benefits. Although the precise form of the initiatives
cannot be identified until the amount of available relief is known,
it is clear that the Mayor's proposals offer a more equitable
reduction in the local burden of support for education than does
STaR as it is currently structured.
One option is to equalize the exemption benefit for coop and condo
owners with the benefit for one-, two-, and three-family homes
in percentage terms. Under the current proposal they are equalized
in dollar terms which produces a much smaller reduction in tax
burden for apartment owners because of differences in effective
tax rates for the two types of properties. A second option is
to provide relief to renters, who are excluded from the benefits
of the STaR exemption, by establishing an earned income tax credit
for the City's personal income tax. Such a proposal would target
tax relief at lower income residents, enhancing the progressivity
of the City's tax structure.
Non-Tax Revenues
The City has a myriad of revenue sources in addition to taxes.
One group of these non-tax sources is identified as miscellaneous
revenues in the City's budget; they are projected to total $3
billion in 1998. A second large item, which is forecast to account
for $10.8 billion in 1998, is State and federal categorical grants.
A final group of non-tax revenues, projected to yield $1.3 billion
in 1998, is comprised of other types of public and private aid
and grants. The following sections briefly discuss and reestimate
these non-tax revenue sources (see Table 2-5).
Miscellaneous Revenues
Approximately 15 percent of the City's own-source revenue (the
portion not funded by grants) comes from so-called miscellaneous
revenues, which comprise nearly 300 different non-tax sources.
Miscellaneous revenues are essentially of two types: the recurring
and larger portion from sources such as licenses, fines, fees,
and water and sewer charges; and a non-recurring portion that
includes the sales of City assets and airport back rent from the
Port Authority. While it is possible to construct models to forecast
recurring revenue with reasonable accuracy, there is much greater
uncertainty surrounding the non-recurring portion of miscellaneous
revenues.
In March, IBO identified two items in the non-recurring portion
of the miscellaneous revenue budget that appeared unlikely to
be realized for 1998.15 These are a large back rent settlement
with the Port Authority for the lease of the City's airports,
and revenue from new collections initiatives. The probability
for realizing either of these revenues in 1998 has not materially
changed in the intervening months. Therefore, IBO's estimate
of miscellaneous revenues for 1998 is $290 million lower ($270
million in airport rent and $20 million in collections initiative
revenue) than forecast in the Mayor's executive budget. As shown
in Figure 2-5, there are smaller adjustments in the later years.
IBO's estimate of total miscellaneous revenues for 1998 is $3.0
billion, declining in subsequent years to $2.4 billion in 2001.
Much of the decline is attributable to the non-recurring nature
of the larger items included in these receipts. Although the
forecast for 1998 includes $200 million from the sale of the Coliseum
and $125 million in other asset sales, it does not specify any
asset sales for the out-years of the plan. Based on past experience,
it is likely that additional assets will be identified for sale
in later years, bringing miscellaneous revenues closer to their
recent levels.
State and Federal Categorical Grants
The largest revenue item in the City's budget is State and federal
categorical grants, which IBO projects will account for $10.8
billion of the $12.1 billion total of grants, aid, and other revenue
in 1998. IBO forecasts higher State and federal categorical aid
over the 1997-2001 period than estimated by the Mayor. For some
types of intergovernmental categorical aid, such as education
and welfare, IBO has developed estimates based on programmatic
changes and caseload projections that affect the level of aid
received from the State and federal governments. IBO's reestimate
of such aid in other parts of the budget are based on a methodology
that takes the grant levels in the current year (1997) and applies
growth factors developed from recent historical trends on an agency
by agency basis.
For 1998, IBO's projection for State categorical aid is $148 million
higher than the Mayor's. By 2001 this difference grows to $632
million. IBO's projections for education and transportation account
in large part for the higher 1998 aid estimate. Similarly, IBO's
forecast of federal categorical aid is $493 million higher than
the Mayor's in 1998, a difference that increases to $770 million
in 2001. IBO's projections for education and health care account
for about half of the 1998 difference, while projections for transportation,
housing, employment, and social services comprise about a third.
Other Revenue
The remaining other revenue consists of unrestricted intergovernmental
aid ($741 million in 1998), private and other categorical grants
($292 million), and inter-fund revenues ($265 million). For these
other revenue sources, IBO has adopted the Mayor's executive budget
forecasts with one exception: the unrestricted intergovernmental
aid category is adjusted to remove-for baseline purposes-the additional
revenue assumed under the Mayor's proposal to obtain a more proportionate
share of the State tax relief funds. The Mayor's executive budget
includes these additional funds in the other revenue category.
Figure 2-5.
Total Revenue Forecasts
(In millions of dollars)
|
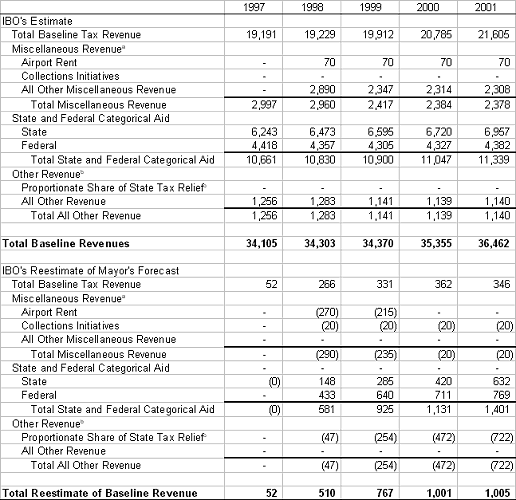 |
| SOURCE: |
Independent Budget Office. |
| NOTE: |
Numbers may not sum exactly due to rounding.
a. Miscellaneous revenues are net of intra-city revenues.
b. All other revenues includes unrestricted government aid, other categorical grants, inter-fund revenues, and disallowances.
c. Additional State aid anticipated from receipt of City's proportionate share of State tax relief removed from baseline projection of Other Revenue. |
Chapter
3
Expense Budget
Overview
The 1998 executive expense budget would result in total spending
of $33.5 billion, a decrease of $540 million, or 1.6 percent,
as compared to forecasted spending in 1997. As shown in Figure
3-1, the decline in spending would consist of a decrease of $133
million and $407 million in City funds and State/federal funds,
respectively. Figure 3-1 also provides a breakdown of the executive
budget across major categories of City spending. About $18 billion,
or slightly more than half the budget, falls within the categories
of health, social services, and education. Figure 3-2 shows that
the budget would decrease total headcount by a net of almost 1,500
as compared to the forecast for the close of 1997.
Figure 3-1 reflects one of the most significant budget developments
during 1997, the accumulation of a
record surplus and its proposed use in 1998. Because accounting
conventions prohibit the explicit "rolling" of surplus
funds from one fiscal year to another, the City effects a roll
by prepaying future obligations (typically debt service) in the
current fiscal year, thus freeing up resources in the future.
While it has been the City's practice to effect a roll one year
at a time, the executive budget proposes to stretch its surplus
over the next two years by: prepaying $856 million of debt in
1997, all of which will be applied to debt payments due in 1998;
and rolling $200 million into 1999 by prepaying debt service
for that year.
Discussion of the expense budget is provided by category throughout
the remainder of this chapter.
Figure 3-1.
1998 Expense Budget by Category
(In millions of dollars)
|
| |
1997
Adopted |
1997
Forecast |
1998
Executive Budget |
Increase/(Decrease)
Over 1997 Forecast |
| |
|
|
|
Amount |
Percent |
| HEALTH AND SOCIAL SERVICES |
| City Funds |
4,839 |
4,887 |
4,907 |
20 |
0.4 |
| State and Federal Funds |
4,350 |
4,568 |
4,381 |
(187) |
(4.1) |
| Sub-Total |
9,189 |
9,455 |
9,288 |
(167) |
(1.8) |
| EDUCATION |
| City Funds |
3,528 |
3,707 |
3,816 |
109 |
2.9 |
| State and Federal Funds |
4,695 |
4,954 |
4,902 |
(52) |
(1.0) |
| Sub-Total |
8,223 |
8,661 |
8,718 |
57 |
0.7 |
| UNIFORMED SERVICES |
| City Funds |
4,404 |
4,633 |
4,542 |
(91) |
(2.0) |
| State and Federal Funds |
81 |
189 |
204 |
15 |
7.9 |
| Sub-Total |
4,485 |
4,822 |
4,746 |
(76) |
(1.6) |
| DEBT SERVICE |
| City Funds |
3,055 |
3,927 |
2,667 |
(1,260) |
(32.1) |
| State and Federal Funds |
9 |
9 |
9 |
- |
- |
| Sub-Total |
3,064 |
3,936 |
2,676 |
(1,260) |
(32.0) |
| GENERAL GOV'T/ALL OTHER |
| City Funds |
7,234 |
6,238 |
7,327 |
1,089 |
17.5 |
| State and Federal Funds |
786 |
936 |
753 |
(183) |
(19.6) |
| Sub-Total |
8,020 |
7,174 |
8,080 |
906 |
12.6 |
| TOTAL |
| Total City Funds |
23,060 |
23,392 |
23,259 |
(133) |
(0.6) |
| Total State and Federal Funds |
9,921 |
10,656 |
10,249 |
(407) |
(3.8) |
| Total Expenditures |
32,981 |
34,048 |
33,508 |
(540) |
(1.6) |
| |
| NOTES: Figures do not include intra-City sales. |
Figure 3-2.
1998 Expense Budget; Headcount by Funding Source
|
| |
1997
Adopted |
1997
Forecast |
1998
Executive Budget |
Increase/(Decrease)
Over 1997 Forecast |
| |
|
|
|
Amount |
Percent |
| HEADCOUNT |
| City Funds |
204,746 |
203,401 |
202,730 |
(671) |
(0.3) |
| State and Federal Funds |
27,842 |
36,665 |
35,882 |
(783) |
(2.1) |
| Total |
232,588 |
240,066 |
238,612 |
(1,454) |
(0.6) |
| |
| NOTES: Headcount figures reflect budgeted positions as of the last
day (June 30) of the respective fiscal year. |
Health and Social Services
Human Resources Administration
| |
1997
Adopted |
1997
Forecast |
1998
Executive Budget |
Increase/(Decrease)
Over 1997 Forecast |
| |
|
|
|
Amount |
Percent |
| City |
3,152 |
3,206 |
3,059 |
(147) |
(4.6) |
| State/Fed |
2,656 |
2,660 |
2,391 |
(269) |
(10.1) |
| Total |
5,808 |
5,866 |
5,450 |
(416) |
(7.1) |
|
| Headcount |
14,527 |
15,048 |
13,702 |
(1,346) |
(8.9) |
The executive budget proposes to spend $5,450 million for the
Human Resources Administration (HRA), a decrease of $416 million,
or 7.1 percent, from the 1997 forecast. Two factors explain much
of this decrease. In 1998, HRA will complete its shift of major
child welfare programs to the Administration for Children Services
(ACS). In particular, ACS will assume oversight of the Agency
for Child Development in the upcoming fiscal year, representing
a transfer of $318.3 million in total funding. Furthermore, the
Department expects that welfare reform initiatives will reduce
public assistance expenditures by $59.1 million in 1998. Overall,
the executive budget anticipates a spending reduction of $377.4
million on public assistance and related areas at HRA in the coming
fiscal year. (For more detail, please see our discussion of public
assistance in Chapter 4.)
The Administration expects modest expenditure growth in HRA's
Medicaid program and proposes an increase of $56.2 million, which
in IBO's view falls slightly below actual need. Since IBO anticipates
lower savings from State entitlement reductions and somewhat faster
growth rates in particular spending areas, we project that Medicaid
spending will require an additional $31 million in City funds
for 1998. (For more detail, please see our discussion of Medicaid
in Chapter 4.)
Administration for Children's Services
| |
1997
Adopted |
1997
Forecast |
1998
Executive Budget |
Increase/(Decrease)
Over 1997 Forecast |
| |
|
|
|
Amount |
Percent |
| City |
334 |
348 |
492 |
144 |
41.4 |
| State/Fed |
1,025 |
1,066 |
1,316 |
250 |
23.5 |
| Total |
1,359 |
1,414 |
1,808 |
394 |
27.9 |
|
| Headcount |
7,429 |
7,733 |
8,346 |
613 |
7.9 |
The Mayor proposes to spend $1,808 million for the Administration
for Children's Services (ACS) in 1998, an increase of $394 million,
or 27.9 percent, from the 1997 forecast. An increase of $144
million in City funds and $250 million in State and federal funds
supports the transfer of the Agency for Child Development (ACD)
to ACS, implementation of the agency's continued reorganization
plan, and the addition of 613 new staff positions.
The proposed increase comprises the following three components:
$6.7 million for continued implementation of the reorganization
plan; $43.3 million in foster care reestimates reflecting a growing
number of children entering foster care as a result of an increase
in neglect and abuse cases; and $344.6 million for ACD's transfer
into ACS.
In addition to the increase in State and federal funds identified
above, we expect an additional $25.8 million in State and federal
funds to be added to the agency budget during the year. These
amounts are not included in the budget due to the City's practice
of not appropriating certain categorical funding sources until
they are actually realized.
Health and Hospitals Corporation
| |
1997
Adopted |
1997
Forecast |
1998
Executive Budget |
Increase/(Decrease)
Over 1997 Forecast |
| |
|
|
|
Amount |
Percent |
| City |
735 |
682 |
702 |
20 |
2.9 |
| State/Fed |
- |
1 |
- |
(1) |
(100.0) |
| Total |
735 |
683 |
702 |
19 |
2.8 |
The executive budget proposes to spend $702 million for the Health
and Hospitals Corporation (HHC), an increase of $19 million, or
2.8 percent, from the 1997 forecast of $683 million. This increase
reflects higher City spending on Medicaid due to previously anticipated
savings of $78.8 million from the Governor's planned entitlement
reductions that do not appear likely to materialize. HHC, however,
will not receive the full value of the unrealized savings because
the budget removes $21 million to reflect lower than expected
year-to-date Medicaid collections.
Despite rate appeals that brought HHC an additional $208 million
in revenue, new patterns of utilization focused on outpatient
care have reduced gross receipts and forced HHC to take steps
to decrease expenditures throughout 1997. Among other things,
HHC has realized savings through revision of its affiliation agreements
(discussed in more detail in Chapter 4) and headcount reductions.
HHC must find additional savings in 1998 to cover the costs of
collective bargaining increases and the costs of operating health
clinics previously funded by the Department of Health.
Department of Homeless Services
| |
1997
Adopted |
1997
Forecast |
1998
Executive Budget |
Increase/(Decrease)
Over 1997 Forecast |
| |
|
|
|
Amount |
Percent |
| City |
120 |
126 |
121 |
(5) |
(4.0) |
| State/Fed |
265 |
269 |
251 |
(18) |
(6.7) |
| Total |
385 |
395 |
372 |
(23) |
(5.8) |
|
| Headcount |
1,773 |
2,186 |
1,700 |
(486) |
(22.2) |
The Mayor's budget proposes to spend $372 million for the Department
of Homeless Services (DHS) in 1998, a decrease of $23 million,
or 5.8 percent, from the 1997 forecast of $395 million. Expected
reductions in federal revenue drives the decrease as families
in federally funded homeless shelters account for a smaller share
of the total shelter population. However, this decrease will
likely be offset by nearly $7 million in Emergency Shelter Grant
funds that are not currently reflected in the agency totals, but
will be added during the year after adoption of the budget. A
hiring freeze imposed by the Administration and a community development
block grant buyout also explain the decrease in City funded expenditures.
The Administration also proposes a variety of initiatives to expand
several services, such as outreach initiatives in the Kingsboro
community. It further proposes to provide funding so that Staten
Island's drop-in center can operate after 5 p.m. and two adult
shelters can each add ten beds.
The Administration has begun to and must continue to explain significant
underspending that has occurred at DHS over the past two fiscal
years. In 1995 the agency's actual spending totaled $344 million
though its budget was $418 million. Similarly, in 1996 the agency
spent only $342 million out of its $396 million budget.
Department of Mental Health, Mental
Retardation, and Alcoholism Services
| |
1997
Adopted |
1997
Forecast |
1998
Executive Budget |
Increase/(Decrease)
Over 1997 Forecast |
| |
|
|
|
Amount |
Percent |
| City |
139 |
146 |
150 |
4 |
2.7 |
| State/Fed |
197 |
218 |
210 |
(8) |
(3.7) |
| Total |
336 |
364 |
360 |
(4) |
(1.1) |
|
| Headcount |
238 |
253 |
238 |
(15) |
(5.9) |
The executive budget proposes to spend $360 million for the Department
of Mental Health, Mental Retardation, and Alcoholism Services
(DMHMRAS), a decrease of $4 million, or one percent, from the
1997 forecast of $364 million. The decrease in funding is largely
explained by a decline of $6.5 million in State funding and $1.5
million in federal funding offset by various increases. The decrease
in State and federal funds is due to the City's practice of not
appropriating certain categorical funds until they are received.
The Administration proposes to increase City funds for DMHRAS
by about $4 million. The budget would add $500,000 in funds for
a Mental Retardation program supporting work readiness and after-school
programs. The remaining proposed City funds increase is explained
by a decision not to carry $3.5 million in 1997 audit recovery
and voluntary sector underspending PEGs through 1998. About $1
million in lost State funds is explained by greater than anticipated
Medicaid eligibility for Early Intervention Program (EIP) children.
Thus, Medicaid funds, rather than the $1 million in State funds,
will support the same children. We also expect that DMHRAS will
receive about $600,000 in additional federal categorical funds
as homeless mental health services previously provided in conjunction
with the Department of Homeless Services will be consolidated
under DMHRAS. While funding for the services remains level, the
associated funds will shift from DHS to DMHRAS.
Department of Health
| |
1997
Adopted |
1997
Forecast |
1998
Executive Budget |
Increase/(Decrease)
Over 1997 Forecast |
| |
|
|
|
Amount |
Percent |
| City |
210 |
221 |
222 |
1 |
0.4 |
| State/Fed |
119 |
239 |
121 |
(118) |
(49.4) |
| Total |
329 |
460 |
343 |
(117) |
(25.4) |
|
| Headcount |
2,376 |
3,125 |
3,198 |
73 |
2.3 |
The Mayor's budget proposes to spend $343 million for the Department
of Health (DOH), a decrease of $117 million, or 25 percent, from
the 1997 forecast of $460 million. This decrease is driven by
what appears in the budget as a $118 million decrease in state
and federal funding. This decrease, however, is due to the City's
practice of not appropriating certain categorical funds until
they are received. We expect DOH will lose about $1.6 million
in State funding during 1998 because it has contracted primary
care services to the Health and Hospitals Corporation.
The executive budget proposes to spend $4.8 million in City funds
to provide protease inhibitors for HIV treatment to the City's
inmates, $2 million in City funds to increase part-time staff
at School Health clinics, and $800,000 to expand DOH's DNA laboratory.
The City would also increase its prison health contracts by about
$2.5 million and would fund a $3.5 million collective bargaining
increase. These proposed increases in funding are largely offset
by a projected $10.6 million in City savings from primary care
service programs transferred to HHC, as well as $400,000 in other
than personnel services reductions and $500,000 in savings generated
by hiring freezes.
Department for the Aging
| |
1997
Adopted |
1997
Forecast |
1998
Executive Budget |
Increase/(Decrease)
Over 1997 Forecast |
| |
|
|
|
Amount |
Percent |
| City |
102 |
108 |
109 |
1 |
0.9 |
| State/Fed |
57 |
70 |
58 |
(12) |
(17.1) |
| Total |
159 |
178 |
167 |
(11) |
(6.2) |
|
| Headcount |
350 |
392 |
374 |
(18) |
(4.6) |
The Mayor's Budget proposes to spend $167 million for the Department
for the Aging (DFTA) in 1998, a decrease of $11 million, or
6.2 percent, from the 1997 forecast of $178 million. This reduction
consists entirely of an $11 million decrease in State and federal
funding. About $5.8 million in State and federal funding is not
included due to the City's practice of deferring the appropriation
of certain categorical funds into the budget until they are received.
The City does, however, expect to receive about $5.3 million
less in State and federal grants during 1998 as compared to 1997.
This reduction, however, has been offset by $6.3 in additional
City funds.
While the Administration's budget proposes to increase City funds
for DFTA very slightly, from $108.5 million in 1997 to $109.1
million in 1998, additional funding increases are expected during
the budget year. The City historically modifies in additional
City funds throughout the year, so actual levels of City spending
would likely be higher by the end of 1998. The preliminary budget
had originally planned a reduction in DFTA City funds to $106
million in 1998. As IBO projected in March, however, the City
has restored the difference in City funding. In addition, the
budget would permit senior centers to roll over about $0.7 million
in City funds for 1998, remove senior center code violations at
a cost of $1.5 million, and renovate the Elmhurst Jackson Heights
Senior Center.
Department of Employment
| |
1997
Adopted |
1997
Forecast |
1998
Executive Budget |
Increase/(Decrease)
Over 1997 Forecast |
| |
|
|
|
Amount |
Percent |
| City |
5 |
8 |
4 |
(4) |
(50.0) |
| State/Fed |
84 |
103 |
91 |
(12) |
(11.7) |
| Total |
89 |
111 |
95 |
(16) |
(14.4) |
|
| Headcount |
267 |
239 |
239 |
- |
- |
The executive budget proposes to spend $95 million for the Department
of Employment (DOE), a decrease of $16 million, or 14 percent,
from the agency's 1997 budget forecast. The reduction consists
of the following three factors. First, City funded expenditures
for 1998 will be approximately half of the 1997 level as two programs-Job
Opportunities for Youth (JOY) and Local Employment Action Program
(LEAP)-would no longer receive enhanced funding. The State's
contribution to the 1997 DOE budget will not be renewed in 1998.
Finally, the City's practice is to defer the appropriation of
certain categorical funding sources in the budget until they are
received.
The Mayor proposes to keep funding for DOE's programs for adults,
dislocated workers, and year-round youth training at 1997 levels.
Meanwhile, the executive budget does account for the recent adjustment
in federal funding for the Summer Youth Employment Program. DOE
would receive nearly $37 million for this program in 1998, over
$11 million more than in 1997. While this would not necessarily
cover all of the cost imposed by last year's increase in the minimum
wage, initiatives to improve efficiency at DOE would likely permit
the number of program participants to be maintained at 35,000
the 1995 level. In addition, it is proposed that DOE benefit
from approximately $6 million in accrued savings that would be
rolled over from 1997.
Department of Youth and Community Development
| |
1997
Adopted |
1997
Forecast |
1998
Executive Budget |
Increase/(Decrease)
Over 1997 Forecast |
| |
|
|
|
Amount |
Percent |
| City |
47 |
49 |
51 |
2 |
4.1 |
| State/Fed |
31 |
45 |
34 |
(11) |
(24.4) |
| Total |
78 |
94 |
85 |
(9) |
(9.6) |
|
| Headcount |
231 |
244 |
254 |
10 |
4.1 |
The Mayor's budget proposes to spend $85 million for the Department
of Youth and Community Development (DYCD), a decrease of $9 million,
or 9.6 percent, from the 1997 forecast. This decrease is largely
attributable to an accrued savings of $3.2 million in City funds
for youth service programs and a $12.1 million reduction in federal
funds. These reductions are offset by an increase of $6.9 million
in City funds and an increase of $1.8 million in State funds for
community development. The DYCD budget reflects the City's practice
of not appropriating certain categorical funding sources at the
time of adoption, but adding such funds to the budget when they
are received. However, we expect an additional $8.4 million from
the federal community development block grant and State Youth
Development Delinquency Prevention funds in 1998.
The executive budget for DYCD also reflects the new immigration
initiative entitled, "Citizenship NYC." The Mayor proposes
to spend a total of $9.6 million to assist immigrants, slated
to lose Supplemental Security Income benefits, in applying for
U.S. citizenship. This funding would result in the creation of
six field offices, the addition of 26 full time positions, the
hiring of 126 per diem staff members, and the provision of $3
million for 10 citywide contracts to be funded at $300,000 each.
Education
Board of Education
| |
1997
Adopted |
1997
Forecast |
1998
Executive Budget |
Increase/(Decrease)
Over 1997 Forecast |
| |
|
|
|
Amount |
Percent |
| City |
3,283 |
3,463 |
3,572 |
109 |
3.1 |
| State/Fed |
4,550 |
4,807 |
4,758 |
(49) |
(1.0) |
| Total |
7,833 |
8,270 |
8,330 |
60 |
0.7 |
|
| Headcount |
| Pedagogic |
80,053 |
80,762 |
83,459 |
2,697 |
3.3 |
| Regular |
6,777 |
6,916 |
7,088 |
172 |
2.5 |
| Total |
86,830 |
87,678 |
90,547 |
2,869 |
3.3 |
The executive budget for the Board of Education (BOE) proposes
to spend $8,330 million, an increase of $60 million, or 0.7 percent,
over the 1997 forecast of $8,270 million. This change in funding
is the sum of $109 million in increased funding from the City
and $49 million in decreased funding from the State and federal
governments.
In IBO's Analysis of the Mayor's Budgetary Proposals, we
forecast that BOE City funded costs would be similar in 1998,
but for 1999, 2000, and 2001 would be higher than the Administration's
projections by $111 million, $111 million and $237 million, respectively.
The new projections in the executive budget moves closer to our
estimate and reduces the differences to none in 1999, $13 million
in 2000, and $138 million in 2001. IBO estimates that a total
of $4,951 million in State and federal aid will be provided in
1998, an increase of $144 million from 1997 forecast levels.
In addition to the initiatives put forth in the preliminary budget
(for more detail see our Analysis of the Mayor's Budgetary
Proposals), the executive budget proposes several programmatic
changes. Funding of $25 million would be added for the arts education
initiative that was announced-but not funded-with the preliminary
budget. According to the Administration, the funding would enable
BOE to restore arts education for 140,000 students. BOE's goal
is to restore arts education throughout the system over the next
three years. To accomplish this goal, however, BOE would have
to secure more funding from the City, private recurring sources,
or internal self-funding initiatives. The cost of extending the
initiative system-wide to all 1,088,000 students projected for
fiscal year 2000 (the third year) would be substantial, even given
that some students already receive arts education from base level
resources. Funding for the other most significant new BOE program
in 1998, Project Read, was proposed in the preliminary budget.
The one year investment would support early grade reading programs.
Literacy is a stated priority of the Chancellor. For 1998, the
budget would provide $125 million for Project Read, the after
school program to enhance reading skills for school age children.
Some items from the Chancellor's budget submission to the Mayor
are not funded in either the preliminary or executive budget.
Most school governance initiatives and investments in higher
performance standards, called the New Standards program, remain
unfunded. The City does propose to provide a potential source
of funding for 1998 under an item entitled "Reserve for Register-Related
Issues," which is meant to be used for discretionary purposes
or unexpected needs. However, more funding would have to be found
from other sources if BOE wishes to pursue the investments. At
this point, BOE has not eliminated any specific proposals in reaction
to the executive budget. Unlike Mayoral agencies, covered agencies
like BOE have more autonomy in budget decision-making and prioritizing.
Many of the proposed changes in the executive budget are of a
technical nature. Funding of $30 million would be added to support
the cost of eliminating administrative duties for teachers, as
agreed to by the City in the last contract settlement. As an
adjustment for register growth, the City would reduce funding
by $18.1 million for general education and increase funding by
$14.7 million for special education. For both general and special
education, enrollment is projected to increase from 1997 levels
(by over 13,000 in general education and 3,000 in special education)
and funding is budgeted to increase from 1997 levels. The executive
budget decrease in general education is due to the reduction of
funding increases put in place when even larger enrollment increases
were anticipated.
The Mayor continues to hold BOE harmless as a source for future
budget savings for the City. In addition, non-recurring resources,
generated from reestimates of program costs and other sources,
are proposed to be used to restore budget reduction initiatives
from the current year program of $301 million in savings. In
1998, $24.5 million would be added to replace $17 million in unallocated
reductions and $7.5 million (which would also be added for 1999)
in failed savings initiatives. In 2000, BOE would have to generate
any savings internally.
The executive budget also proposes a roll surplus funds from 1997
to 1998. Like last fiscal year, when $77 million in surplus funds
was rolled, the funding would be used to offset previously applied
per capita reductions and as new funding for the community school
districts (CSDs) and high schools. It is likely that the size
of the roll will grow as the school year and fiscal year draw
to a close, but the amount should be in the range of last year's
figure. BOE has requested, and the City has agreed, that surpluses
should be rolled from year to year-and returned to those responsible
for the savings-to discourage CSDs and high schools from engaging
in end-of-the-year spending sprees. While this argument does
make sense, it is not clear if educational quality is being sacrificed
for the sake of generating the surpluses.
Finally, the executive budget includes an additional expense of
$104.5 million in 1998 due to collective bargaining agreements
and $13.0 million for increased heat, light, power, and fuel costs.
Of the collective bargaining cost increase, $3.1 million is for
the Fashion Institute of Technology, which receives funding from
the City through BOE's budget.
City University of New York
| |
1997
Adopted |
1997
Forecast |
1998
Executive Budget |
Increase/(Decrease)
Over 1997 Forecast |
| |
|
|
|
Amount |
Percent |
| City |
245 |
245 |
244 |
(1) |
(0.4) |
| State/Fed |
144 |
146 |
145 |
(1) |
(0.7) |
| Total |
389 |
391 |
389 |
(2) |
(0.5) |
|
| Headcount |
| Pedagogic |
2,202 |
2,202 |
2,202 |
- |
- |
| Regular |
1,385 |
1,385 |
1,385 |
- |
- |
| Total |
3,587 |
3,587 |
3,587 |
- |
- |
The Mayor's budget for the City University of New York (CUNY)
proposes to spend $389 million in 1998, a decrease of $2 million,
or 0.5 percent, from the 1997 forecast. Much of the decrease
is due to a reduction in State funds. Nonrecurring funds were
provided in 1997 for prior-year reimbursements.
The budget for CUNY contains technical changes of $0.9 million
for collective bargaining cost increases and $0.4 million for
heat, light, and power cost increases. There is also a proposed
spending reduction of $1.4 million to reflect health insurance
cost decreases. The net impact of these changes is a slight decrease
in funding, enabling the City to satisfy its maintenance of effort
funding requirement without increasing spending above 1997 levels.
CUNY is still in the midst of contract negotiations and is likely
to require additional funding for collective bargaining costs
in 1998 as well as the out-years of the financial plan. The Administration
has stated that it will cover the 1998 costs, but funds have not
been set aside in the labor reserve for this purpose. In addition,
funds have not been provided for collective bargaining increases
for 1999 through 2001. (For more detail, please see the discussion
of the labor reserve in Chapter 4.)
Uniformed Services
Police Department
| |
1997
Adopted |
1997
Forecast |
1998
Executive Budget |
Increase/(Decrease)
Over 1997 Forecast |
| |
|
|
|
Amount |
Percent |
| City |
2,280 |
2,366 |
2,278 |
(88) |
(3.7) |
| State/Fed |
16 |
122 |
121 |
(1) |
(0.8) |
| Total |
2,296 |
2,488 |
2,399 |
(89) |
(3.6) |
|
| Headcount |
| Uniform |
37,522 |
38,310 |
36,721 |
(1,589) |
(4.1) |
| Civilian |
6,777 |
8,752 |
8,258 |
(494) |
(5.6) |
| Total |
44,299 |
47,062 |
44,979 |
(2,083) |
(4.4) |
The executive budget for the Police Department (NYPD) proposes
to spend $2,399 million, a decrease of $89 million, or 3.6 percent,
from the 1997 forecast of $2,488 million. Almost all of the net
decrease, about $87 million, is due to the City's practice of
not including certain anticipated categorical funds at the time
of budget adoption. Instead, such funds are added into the budget
as they are received during the course of the fiscal year. For
example, although NYPD is forecast to receive almost $40 million
in asset forfeiture funds in 1997, this category of funds is not
yet reflected in the 1998 budget.
The other factor associated with the proposed decrease in the
budget for NYPD involves planned overtime expenditures. Despite
the fact that NYPD spent $108 million in overtime in 1996, and
currently projects $111 million in overtime expenditures for 1997,
the executive budget includes only $94 million for overtime.
Given the historical pattern and difficulties in reducing these
expenditures in recent years, we expect that the City will be
required to augment NYPD's overtime budget by at least $10 million
during 1998. (For more detail, please see the discussion in Chapter
4.)
With respect to agency staffing, the budget proposes to reduce
total NYPD headcount by a net of 4.6 percent over the course of
1998. This decline consists of a 4.1 and 5.6 percent drop in
uniformed and civilian headcount, respectively. In March 1997,
State officials agreed to a two-year extension of the 12.5 percent
surcharge on New York City's personal income tax, conditioned
on the City's agreement to maintain a targeted uniformed police
staffing level of 38,310 during fiscal year years 1997 and 1998.
During the next month (April 1997), and with the assistance of
federal "Crime Bill" funds, NYPD hired a total of 1,300
police recruits. As a result, the current fiscal year is now
forecasted to close with a uniformed police headcount of 38,310.
Given that the executive budget proposes that no new police recruits
be hired in the coming fiscal year, attrition is scheduled to
bring the size of the uniformed force down to 36,721 by the close
of 1998.
The budget also proposes that planned civilian staffing within
NYPD decline by a net of 494, or 5.6 percent, over the course
of 1998. However, to the extent that the City receives additional
grant funding for civilian personnel in 1998, the net decline
in civilian staffing could be limited to as few as 189 positions,
or 2.2 percent.
Finally, the budget proposes $30 million in funding that would
allow NYPD to continue the enhanced drug enforcement efforts it
has been conducting in several communities since early in calendar
year 1996, most notably in northern Manhattan and northern Brooklyn.
Fire Department
| |
1997
Adopted |
1997
Forecast |
1998
Executive Budget |
Increase/(Decrease)
Over 1997 Forecast |
| |
|
|
|
Amount |
Percent |
| City |
882 |
929 |
934 |
5 |
0.5 |
| State/Fed |
1 |
2 |
2 |
- |
- |
| Total |
883 |
931 |
936 |
5 |
0.5 |
|
| Headcount |
| Uniform |
10,996 |
11,282 |
11,155 |
(127) |
(1.1) |
| Civilian |
4,503 |
4,419 |
4,408 |
(11) |
(0.2) |
| Total |
15,499 |
15,701 |
15,563 |
(138) |
(0.9) |
The Mayor's budget proposes to spend $936 million for the Fire
Department (FDNY), an increase of $5 million, or 0.5 percent,
over the 1997 forecast of $931 million. This net increase is
primarily due to the funding of a collective bargaining agreement
with the firefighters, who have been without a contract since
January 1, 1995. On April 7, 1997, the City reached a tentative
agreement with the leadership of the Uniformed Firefighters Association.
The agreement calls for a pay freeze for the first two years
retroactive to 1995 and 1996; a 3 percent raise in the third and
fourth years, covering 1997 and 1998, and a 6 percent raise covering
1999. The budget adds additional funding of $7.2 million in 1997
and $21 million in 1998 based on the tentative proposal on which
the members will vote over the next couple of months.
City funded expenditures would be reduced by $1.3 million in 1997
and $1.4 million in 1998 due to a funding shift to State funds
for Certified First Responder-Defibrillation training by the Bureau
of Emergency Medical Services (EMS). This State funding would
partially cover the cost of training all emergency medical technicians,
paramedics, and firefighters.
The executive budget also reflects a number of other projected
reductions of City funds in 1998. These include the reduction
in costs for EMS leased sites due to an effort to use more City-owned
space ($1.2 million); a reduction of auto purchases which are
primarily for administrative staff ($330,000); a reestimate of
funding needed for heat, light and power in EMS since FDNY will
not be housed in the targeted number of ambulance stations originally
projected for 1998 ($360,000); and $500,000 in additional Medicare
revenue.
The amount requested for civilian overtime in 1998 may be underestimated.
The Fire Department had projected at the time that the 1997 budget
was adopted that $11.5 million would be spent on civilian overtime.
During 1997, however, EMS has received an additional $4.5 million
for overtime. This has resulted from a variety of factors including
EMS personnel needed to increase the number of tours mandated
by the memorandum of understanding between the City Council and
FDNY. A civilian overtime need resulted from a failed PEG for
outsourcing building maintenance staff. Also, additional funding
has been added for fire dispatchers, fire prevention, and fleet
maintenance personnel. As a result, total civilian overtime has
risen to a 1997 forecast amount of $18.6 million. The Administration
now projects that the civilian overtime budget for 1998 would
be $11.7 million with $10.5 million of that amount to be allotted
to EMS. However, based on the 1997 experience, it is doubtful
that FDNY will be able to stay within its 1998 civilian overtime
allocation.
Although the FDNY and EMS were officially merged on March 17,
1996, the initiative is still being implemented. The primary
goal of the merger was to decrease response times to medical emergencies
(especially life-threatening incidents such as cardiac arrest)
by increasing the availability of ambulances and improving the
coordination of FDNY and EMS resources. A major proposal from
the merger was the plan to establish a total of about 60 ambulance
stations by the end of 1999, including the existing 16 ambulance
stations. To date, only two additional ambulance stations have
opened at the following locations: Elmhurst Hospital and Western
Queens Community Hospital. FDNY indicated recently that having
60 ambulance stations operational within the original three-year
time frame now appears unlikely.
Department of Correction
| |
1997
Adopted |
1997
Forecast |
1998
Executive Budget |
Increase/(Decrease)
Over 1997 Forecast |
| |
|
|
|
Amount |
Percent |
| City |
693 |
753 |
720 |
(33) |
(4.4) |
| State/Fed |
55 |
56 |
72 |
16 |
28.6 |
| Total |
748 |
809 |
792 |
(17) |
(2.1) |
|
| Headcount |
| Uniform |
10,817 |
11,356 |
11,408 |
52 |
0.5 |
| Civilian |
1,564 |
1,665 |
1,640 |
(25) |
(1.5) |
| Total |
12,381 |
13,021 |
13,048 |
27 |
0.2 |
The executive budget for the Department of Correction (DOC) proposes
to spend $792 million, a decrease of $17 million, or 2.1 percent,
from the 1997 forecast of $809 million.
A key factor associated with this decrease involves planned overtime
expenditures. Despite the fact that DOC spent $75 million on
overtime in 1996, and currently projects $82 million in overtime
expenditures for 1997, the executive budget includes only $55
million for overtime. These planned overtime expenditures rest
on the assumption that the average daily inmate population will
be 19,000 in 1998; down slightly from the forecasted average of
19,300 in 1997.
In the event that the average daily inmate population exceeds
19,000, additional funding for overtime and other population sensitive
expenditures may become necessary. Such a condition could result
from higher than anticipated NYPD arrest activity, or slower than
anticipated criminal case adjudication. At present, DOC indicates
that the planned hiring of 400 correction officer recruits during
1998 (in addition to the 944 correction officers hired during
1997) will significantly assist the agency's efforts to contain
overtime expenditures.
With respect to combined State and federal categorical funding,
the executive budget reflects a net increase of $17 million between
1997 and 1998. This increase is attributable to DOC's successful
application for federal "Crime Bill" funds designated
to reimburse State and local governments for the costs incurred
in connection with the incarceration of illegal aliens convicted
of criminal charges.
Department of Sanitation
| |
1997
Adopted |
1997
Forecast |
1998
Executive Budget |
Increase/(Decrease)
Over 1997 Forecast |
| |
|
|
|
Amount |
Percent |
| City |
549 |
585 |
610 |
25 |
4.3 |
| State/Fed |
9 |
9 |
9 |
- |
- |
| Total |
558 |
594 |
619 |
25 |
4.2 |
|
| Headcount |
| Uniform |
6,635 |
6,887 |
6,807 |
(80) |
(1.2) |
| Civilian |
2,164 |
2,238 |
2,215 |
(23) |
(1.0) |
| Total |
8,799 |
9,125 |
9,215 |
(103) |
(1.1) |
The Mayor's budget proposes to spend $619 million on the Department
of Sanitation in 1998, an increase of $25 million, or 4.2 percent,
from the 1997 forecast of $594 million. Much of this increase
can be attributed to initiatives recommended by the Fresh Kills
Task Force as steps necessary to close the landfill by 2002.
The executive budget includes a total of $9.6 million for citywide
mixed paper and bulk metal recycling collections, as well as a
total of $5.3 million for waste prevention and composting pilot
projects. The City will also begin to export all residential
waste from the Bronx in 1998 at an estimated net cost of $26.6
million. (Please see the discussion in Chapter 4 for further detail.)
The $27.1 million snow budget allocation in the Mayor's budget
is higher than the 1997 appropriation of $14.3 million due primarily
to extreme winter conditions in 1996. The Charter requires that
the snow budget equal the average of actual snow expenditures
from the five preceding fiscal years (excluding 1994). The 1998
allocation is the first to include the exceptionally high total
from 1996 ($60.4 million) in its calculation. On the other hand,
the mild winter this past year has resulted in an anticipated
snow budget surplus of $2.2 million for the current fiscal year,
reducing 1997 forecasted expenditures to $12.1 million.
The recent contract settlement for DOS civilian workers required
collective bargaining increases of $751,000 in 1997 and $3.5 million
in 1998. Since DOS has not yet reached agreement with the uniformed
workers, funds for uniformed collective bargaining increases remain
in the Miscellaneous Budget labor reserve.
Debt Service
| |
1997
Adopted |
1997
Forecast |
1998
Executive Budget |
Increase/(Decrease)
Over 1997 Forecast |
| |
|
|
|
Amount |
Percent |
| City |
3,055 |
3,927 |
2,667 |
(1,260) |
(32.1) |
| State/Fed |
9 |
9 |
9 |
- |
- |
| Total |
3,064 |
3,936 |
2,676 |
(1,260) |
(32.0) |
The executive budget includes a significant decrease in spending
related to City general obligation debt service as compared to
the level forecasted for 1997. At the same time, the budget reflects
an increase over the 1997 forecast in spending related to MAC
debt service. In addition, spending on debt service for debt
issued by the new New York City Transitional Finance Authority
(TFA) is included in the executive budget. Because MAC and TFA
debt service are such a small proportion of total debt service,
the overall effect is a 32 percent decrease in debt service over
1997 forecast levels. For City debt service, expenditures would
be reduced $1,371 million from 1997 levels, from $3,671 million
to $2,300 million. For MAC debt service, expenditures would be
increased by $105 million from 1997 levels, from $265 million
to $370 million. For TFA debt service, expenditures would total
$4.7 million in 1998. The reduction in overall debt service is
largely due to the impact of the surplus roll, which would be
used to prepay $856 million of 1998 debt service, thus increasing
1997 expenditures and reducing planned 1998 expenditures by the
same amount. The Mayor also proposes to roll $200 million into
1999 by prepaying, at the end of 1998, debt service for 1999.
Until the executive budget, the City's budget and planning documents
assumed the sale of the City's water and sewer system to the New
York City Water Board which included refunding the City's water
system-related general obligation debt and canceling the lease
payments from the Board that paid the related debt service. Since
the Court of Appeals forbade the sale in late March, OMB has revised
baseline numbers in the executive budget to unwind the assumptions
the City has carried in its Financial Plan since 1995. Thus,
baseline debt service costs increase in 1998 by $181 million from
prior Financial Plans to reflect the fact that the City will continue
to pay debt service on its system-related debt. At the same time
however, revenues increase an equal amount from prior Plans to
reflect the receipt of lease payments from the Board to pay this
debt service.
Until the 1998 executive budget, the City's budget and planning
documents also did not reflect constraints related to the City's
approaching debt limit. The TFA, an off-budget entity, was created
in February to enable the City to borrow capital funds beyond
the existing debt limit. The TFA will soon be issuing its own
bonds. The executive budget proposes to transfer a portion of
general obligation debt service in excess of the debt limit to
the TFA. While TFA bonds will require debt service payments in
1998, these payments substitute for what would have been general
obligation bonds.
General Government
Miscellaneous Budget
| |
1997
Adopted |
1997
Forecast |
1998
Executive Budget |
Increase/(Decrease)
Over 1997 Forecast |
| |
|
|
|
Amount |
Percent |
| City |
3,325 |
2,590 |
3,097 |
507 |
19.6 |
| State/Fed |
140 |
138 |
125 |
(13) |
(9.4) |
| Total |
3,465 |
2,728 |
3,222 |
494 |
18.1 |
Funds are provided in the Miscellaneous Budget for fringe benefits
for City employees and retirees, the labor reserve, transit and
housing subsidies and other expenditures which are not be allocated
in the budget of a particular City agency. The Mayor's proposal
for the Miscellaneous Budget is $3,222 million, an increase of
$494 million, or 18.1 percent, from the 1997 forecast. This increase
is due mainly to an increase of $249 million in the labor reserve
for collective bargaining adjustments, $160 million for the general
reserve, and $123 million for fringe benefits.
The budget reflects a continuing decline in City funding for the
Legal Aid Society, which is the primary provider of indigent defense
services in New York City. In 1996, the City accepted proposals
for new criminal defense contracts to provide an alternative to
the Legal Aid Society as the primary defender. Three contractors
were chosen to begin providing services in 1997. In 1998 four
additional contractors will begin to provide indigent defense
services for the City. The contractors have essentially been
paid through reductions to the Legal Aid Society.
In 1996, total City funded expenditures of the Legal Aid Society
were $66.4 million. This was reduced to $60.2 million in 1997
when the City first selected the new. The 1998 proposal for the
Legal Aid Society is $54.8 million and would decline further to
about $49 million in 1999. (For a discussion of other issues
related to the Miscellaneous Budget, please see Chapter 4.)
Pension Contributions
| |
1997
Adopted |
1997
Forecast |
1998
Executive Budget |
Increase/(Decrease)
Over 1997 Forecast |
| |
|
|
|
Amount |
Percent |
| City |
1,271 |
1,293 |
1,427 |
134 |
10.4 |
| State/Fed |
78 |
79 |
79 |
- |
- |
| Total |
1,349 |
1,372 |
1,506 |
134 |
9.8 |
The executive budget proposes to spend $1,506 million for City
contributions to pensions, an increase of $134 million, or 9.8
percent, from the 1997 forecast of $1,372 million. A number of
actuarial and technical factors, in both the preliminary and executive
budgets, combine to make up the change. A minor offset of $281,000
is anticipated to be provided from the pension savings related
to other gap reduction initiatives.
Department of Environmental Protection
| |
1997
Adopted |
1997
Forecast |
1998
Executive Budget |
Increase/(Decrease)
Over 1997 Forecast |
| |
|
|
|
Amount |
Percent |
| City |
598 |
579 |
635 |
56 |
9.7 |
| State/Fed |
- |
1 |
- |
(1) |
(100.0) |
| Total |
598 |
580 |
635 |
55 |
9.5 |
|
| Headcount |
5,965 |
5,956 |
6,946 |
(10) |
(0.2) |
The Mayor's budget proposes to spend $635 million for the Department
of Environmental Protection (DEP), an increase of $55 million,
or 9.5 percent, over the 1997 forecast of $580 million. This
increase is due largely to the new needs of the water and sewer
system ($31 million); collective bargaining ($6 million); and
a net increase of various technical adjustments ($9 million),
including $9 million added to cover heat, light, and power and
an offsetting reduction of $6 million from re-estimating water
and sewer expenses.
The budget reflects a number of significant program changes including
$31 million in proposed new needs. Some of these items include
the following: additional spending of $9 million for customer
and conservation services; $6 million on water pollution control
due to increased sludge volume, start-up costs of new sludge disposal
contracts, and increased chemical processing mandated by consent
decrees; and $4 million for water supply quality and protection
projects including the design of the Catskill/Delaware filtration
plant.
Housing Preservation and Development
| |
1997
Adopted |
1997
Forecast |
1998
Executive Budget |
Increase/(Decrease)
Over 1997 Forecast |
| |
|
|
|
Amount |
Percent |
| City |
62 |
65 |
52 |
(13) |
(20.0) |
| State/Fed |
330 |
390 |
312 |
(78) |
(20.0) |
| Total |
392 |
455 |
364 |
(91) |
(20.0) |
|
| Headcount |
2,971 |
2,887 |
2,687 |
(200) |
(6.9) |
The executive budget proposes to spend $364 million for Housing
Preservation and Development (HPD), a decrease of $91 million,
or 20 percent, from the 1997 forecast of $455 million. Eighty-six
percent, or $78 million, of this decrease is due to the City's
practice of not appropriating certain categorical funding sources
at the time of budget adoption. Instead of appropriating these
funds, such as Community Development Block Grant (CDBG) money,
at adoption, the City adds the funds to the budget during the
year as they are received. The remaining 14 percent of the reduction
in HPD's budget is City funds which would drop from $66 million
in the 1997 forecast to $52 million in the executive budget, a
decrease of $13 million, or 20 percent. HPD also proposes a savings
program of $1.1 million, primarily replacing City expenditures
with CDBG funds.
Of the $92 million decrease in HPD's budget, the Department expects
to add back at least $63 million in federal funds after adoption
as they are appropriated. The remaining $29 million shortfall
is due to workload reestimates ($17.3 million primarily in reduced
in-rem stock maintenance), one-time allocations ($10.3 million
primarily in Community Consultant and Legal Services contracts),
and productivity initiatives ($1.7 million).
The Department will focus on several programs in 1998. Among
other things, the number of in-rem or foreclosed properties in
City management is expected to decrease further as more units
are transferred to private and non-profit entities. The much
awaited anti-abandonment and early warning system (EWS) is still
under development but, according to the agency, is expected to
be operational by the end of summer. Details of the program,
however, are sparse at this time and questions remain as to whether
the funding is adequate.
The City expects to complete its second property tax lien sale
in May 1998. In this program, the City sells a pool of tax liens
to an entity that in turn sells them to the asset-backed credit
market. The City receives an immediate payment, estimated in the
executive budget at $50 million, and a residual interest in the
liens. An independent organization then services the liens until
the investors are paid. Properties designated as distressed are
exempt from the sale. HPD is proposing legislation to commence
in-rem actions in targeted neighborhoods on a pilot basis to assist
communities in rehabilitating distressed properties and areas.
Restorations made by the City Council last year were not added
into HPD's budget for 1998. Consequently, the Community Consultant
and Legal Services programs and increased Neighborhood Preservation
Consultant Contracts are not proposed to be funded in 1998. These
were restored by the City Council in 1997 at $3.2 million and
are expected to be restored in 1998 as well.
Over 50 percent of the proposed 1998 headcount reduction of 200
are federally-funded. Many are expected to be added back as federal
funds are appropriated. The remaining reduction, of which 58
are City-funded, would be accomplished through attrition, redeployment,
workload reestimates and productivity initiatives.
Department of Transportation
| |
1997
Adopted |
1997
Forecast |
1998
Executive Budget |
Increase/(Decrease)
Over 1997 Forecast |
| |
|
|
|
Amount |
Percent |
| City |
314 |
308 |
323 |
15 |
4.9 |
| State/Fed |
58 |
99 |
40 |
(59) |
(59.6) |
| Total |
372 |
407 |
363 |
(44) |
(10.8) |
|
| Headcount |
3,652 |
4,232 |
3,726 |
(506) |
(12.0) |
The executive budget for the Department of Transportation (DOT)
proposes to spend $363 million, a decrease of $44 million, or
10.8 percent, from the 1997 forecast of $407 million. This decrease
is largely due to the City's practice of deferring the appropriation
of State and federal grants until such funds are received by the
agency during the fiscal year. Similarly, although the executive
budget headcount level is 12 percent below the 1997 forecast,
staffing will in fact increase as State and federal grants that
fund the positions are received.
DOT's proposed spending reflects almost $13 million more in anticipated
savings than in 1997. In addition to spending reductions already
included in the preliminary budget, such as $2 million for CHIPS
funding of bridge repairs and $2.6 million for the capitalization
of streetlight maintenance costs, the executive budget proposes
to reduce City expenditures by using an additional $5.3 million
of State CHIPS capital funding to pay for various tasks related
to bridges and highways. Additional anticipated savings include
reduced overtime for vehicle maintenance and repair, which is
part of the agency's continuing efforts to operate more efficiently.
The executive budget proposes additional expenses of $4.1 million
in 1998 due to collective bargaining agreements. The budget also
proposes a new expenditure of $111,000 to audit its franchise
bus operations, which have been the subject of some criticism.
Public Libraries
| |
1997
Adopted |
1997
Forecast |
1998
Executive Budget |
Increase/(Decrease)
Over 1997 Forecast |
| |
|
|
|
Amount |
Percent |
| City |
106 |
108 |
185 |
77 |
71.3 |
| State/Fed |
- |
- |
- |
- |
- |
| Total |
106 |
108 |
185 |
77 |
71.3 |
The Mayor's Budget proposes to spend $185 million on public libraries,
an increase of $77 million, or 71.3 percent from the 1997 forecast
of $108 million. The increase, however, is the result of using
surplus funds from the end of 1996 to prepay 1997 operating subsidies
for the New York, Brooklyn, and Queens Borough public library
systems. Hence, the proposed 1998 appropriations for public libraries,
which appears to represent a large funding increase, merely returns
the libraries to their historical subsidy levels
For 1998, the three public library systems would collectively
receive an additional $900,000 for heat, light and power, over
1997 levels. The research libraries, however, would receive $200,000
less toward their energy expenses than in 1997. Increases in
the collective bargaining agreement in 1998 are proposed to be
met with $3.4 million in additional funds. The executive budget
also proposes $280,000 in additional spending to operate the newly
renovated Flushing library.
Department of Finance
| |
1997
Adopted |
1997
Forecast |
1998
Executive Budget |
Increase/(Decrease)
Over 1997 Forecast |
| |
|
|
|
Amount |
Percent |
| City |
164 |
164 |
170 |
6 |
3.7 |
| State/Fed |
- |
- |
- |
- |
- |
| Total |
164 |
164 |
170 |
6 |
3.7 |
|
| Headcount |
2,509 |
2,534 |
2,526 |
(8) |
(0.3) |
The Mayor has proposed a $170 million budget in 1998 for the Department
of Finance (DOF). This amounts to a 3.7 percent, or $6 million,
increase from the preceding year. The executive budget adds over
$1.3 million for payment of various leases, including space for
the City Sheriff and Parking Violations Operations. The budget
also includes nearly $3 million for collective bargaining increases
and $500,000 for advertising for the property tax lien sale program.
(For further detail on the tax lien sale program, the Housing
Preservation and Development Section above.)
Department of Citywide Administrative Services
| |
1997
Adopted |
1997
Forecast |
1998
Executive Budget |
Increase/(Decrease)
Over 1997 Forecast |
| |
|
|
|
Amount |
Percent |
| City |
145 |
148 |
152 |
4 |
2.7 |
| State/Fed |
7 |
16 |
11 |
(5) |
(31.2) |
| Total |
152 |
164 |
163 |
(1) |
(0.6) |
|
| Headcount |
1,544 |
1,638 |
1,668 |
30 |
1.8 |
The executive budget for the Department of Citywide Administrative
Services (DCAS) proposes to spend $163 million, a decrease of
$1 million, or 0.6 percent, from the 1997 forecast of $164 million.
In large part, the net change reflects a decrease of $5 million
in State and federal funding offset by an increase of $4.0 million
in City-funded spending. Much of this federal and State funding
decrease, however, is due to the City's practice of not appropriating
certain categorical funding sources at the time of budget adoption.
Instead, the City adds such funds to the budget during the year
as they are received.
The executive budget would add $3.3 million for new needs, while
reducing funding by $4 million in new gap reduction savings proposals,
the largest of which are non-recurring. New needs include $1.5
million to support recurring maintenance on new fire alarm systems;
this funding is in addition to the $1.5 million increase proposed
in the preliminary budget. By early 1998, the City will complete
what has been an approximately $40 million capital investment
effort to bring all 47 City-owned public buildings into fire code
compliance. The proposed level of new operating funding would
cover the total annual maintenance cost of the systems. Additional
security at City buildings is proposed at a cost of $1.1 million.
The specific buildings have not yet been chosen, but it is intended
that they include those with a high volume of in-and-out traffic
or a history of crime. This investment supplements previous investments
in building security that are still in place.
Gap reduction initiatives include two large non-recurring savings
items. Postponement of the planned firefighters written and physical
exams, from 1998 to 1999, would save $1.2 million. This postponement
is driven by new recruit needs, not an effort to produce savings.
DCAS also proposes to save an additional $2.3 million, for 1998
only, based on claims made to the State for reimbursement of retroactive
charges (going back to 1991) related to the cost of building maintenance
and cleaning. The State is now investigating the claims but has
not yet committed the funding.
Finally, the executive budget proposes an additional expense of
$1.7 million in 1998 due to collective bargaining agreements and
$1.1 million for increased heat, light, and power costs.
Department of Parks and Recreation
| |
1997
Adopted |
1997
Forecast |
1998
Executive Budget |
Increase/(Decrease)
Over 1997 Forecast |
| |
|
|
|
Amount |
Percent |
| City |
141 |
146 |
145 |
(1) |
(0.7) |
| State/Fed |
4 |
5 |
5 |
- |
- |
| Total |
145 |
151 |
150 |
(1) |
(0.7) |
|
| Headcount |
2,352 |
2,362 |
2,287 |
(75) |
(3.2) |
The Mayor's budget proposes to spend $150 million for the Department
of Parks and Recreation (DPR), a decrease of $1 million, or 0.7
percent, from the 1997 forecast of $151 million. The programmatic
reductions include the redeployment of 55 Parks Enforcement Patrol
officers and 15 auto mechanics to other City agencies for a savings
of $2.3 million, while an additional $2.3 million would be removed
from the agency's seasonal budget for basic maintenance and cleaning.
The termination of two privatization contracts, one each in the
Bronx and Queens, would result in another $800,000 in annual savings.
Finally, the replacement of City funds with federal funding at
the Brownsville Recreation Center would produce another $700,000
in savings for the City.
These reductions would be partially offset by new spending in
1998 for maintenance and operations. DPR proposes to budget $723,000
for the hiring of 25 full-time workers, some of whom would include
Work Experience Program workers. Increased funding of $1.7 million
is proposed in the budget for the care of the City's half million
street trees in accordance with a 15-year pruning cycle. The
City is also proposing to restore operating subsidies to the main
zoos at Central Park, Prospect Park, and Flushing Meadows Park,
as well as provide funding for the new children's zoo at Central
Park. These funds, which were eliminated in 1997, would total
$7.7 million, down from 1996 levels of $8.1 million.
Department of Cultural Affairs
| |
1997
Adopted |
1997
Forecast |
1998
Executive Budget |
Increase/(Decrease)
Over 1997 Forecast |
| |
|
|
|
Amount |
Percent |
| City |
94 |
95 |
80 |
(15) |
(15.8) |
| State/Fed |
- |
1 |
- |
(1) |
(100.0) |
| Total |
94 |
96 |
80 |
(16) |
(16.1) |
|
| Headcount |
38 |
38 |
38 |
- |
- |
The executive budget proposes to spend $80 million for cultural
institutions and programs, a decrease of $16 million, or 16.1
percent, from the 1997 forecast of $96 million. Of this decrease,
reductions to cultural institutions account for $11.5 million,
which represents 15 percent of their total operating subsidy payments.
Since across-the-board reductions would not be applied against
heat, light, and power (because energy is more an uncontrollable
expense), the reduction would effectively result, on average,
in a 19.5 percent reduction to payments for basic operating expenses
such as security and maintenance. Moreover, in instances where
energy makes up a significant portion of total operating subsidy,
such as Metropolitan Museum of Art (48 percent) and Carnegie Hall
(73 percent), these cuts would be applied toward an even smaller
share of the total regular operating subsidy, and thus generate
an even greater percentage reduction.
This reduction to cultural institutions would be partially offset
by a $2.2 million increase to their energy price reestimates,
which is 13 percent, on average, above 1997 levels. Payments
to cultural institutions would also include an additional $1.0
million adjustment for collective bargaining increases in 1998.
The executive budget also proposes to reduce program services
by $3.7 million, representing a 27 percent reduction from 1997
forecast levels of $13.7 million (excluding Cultural Challenge
funding). Now in its fourth year, the Cultural Challenge Initiative,
a program intended to leverage private funding of the arts, would
be reduced by $250,000, or about 11 percent from 1997 levels.
Department of Juvenile Justice
| |
1997
Adopted |
1997
Forecast |
1998
Executive Budget |
Increase/(Decrease)
Over 1997 Forecast |
| |
|
|
|
Amount |
Percent |
| City |
54 |
63 |
54 |
(9) |
(14.3) |
| State/Fed |
24 |
14 |
25 |
11 |
78.6 |
| Total |
78 |
77 |
79 |
2 |
2.6 |
|
| Headcount |
645 |
588 |
629 |
41 |
7.0 |
The Mayor's budget proposes to spend $79 million for the Department
of Juvenile Justice in 1998, an increase of $2 million, or 2.6
percent, over the 1997 forecast of $77 million. This increase
is due largely to a $10 million federal Emergency Assistance to
Families grant the agency anticipates receiving in 1998 to pay
for juveniles it sends to the State Division for Youth facilities.
This payment was supported by City funds in 1997. Instead of
reducing the budget by a corresponding $10 million in City funds,
$1.6 million of City funds will remain in the agency. The Department
also expects to receive $875,000 more from the State in 1998 than
in 1997 for juveniles in programs that receive a 50 percent State
subsidy.
Department of Probation
| |
1997
Adopted |
1997
Forecast |
1998
Executive Budget |
Increase/(Decrease)
Over 1997 Forecast |
| |
|
|
|
Amount |
Percent |
| City |
45 |
45 |
46 |
1 |
2.2 |
| State/Fed |
21 |
27 |
23 |
(4) |
(14.8) |
| Total |
66 |
72 |
69 |
(3) |
(4.2) |
|
| Headcount |
1,574 |
1,622 |
1,539 |
(83) |
(5.1) |
The Mayor's budget proposes to spend $69 million for the Department
of Probation in 1998, a decrease of $3 million, or 4.2 percent,
from the 1997 forecast of $72 million. This decrease does not
reflect the possible loss of $4 million in State probation aid
resulting from the Governor's budget proposal to reduce State
aid to localities from 32 percent to 26.2 percent. In addition,
the budget does not include an estimated $4 million in State grants
that we expect to be added to the budget during the year. These
grants would be provided for the Intensive Supervision, Juvenile
Intensive Supervision, and the Kings Juvenile Offenders programs.
Department of Business Services/ Economic
Development Corporation
| |
1997
Adopted |
1997
Forecast |
1998
Executive Budget |
Increase/(Decrease)
Over 1997 Forecast |
| |
|
|
|
Amount |
Percent |
| City |
19 |
22 |
21 |
(1) |
(4.5) |
| State/Fed |
5 |
8 |
7 |
(1) |
(12.5) |
| Total |
24 |
30 |
28 |
(2) |
(6.7) |
|
| Headcount |
168 |
180 |
171 |
(9) |
(5.0) |
The executive budget proposes spending of $28 million for the
Department of Business Services (DBS), which includes the budget
for the Economic Development Corporation (EDC). The proposed
spending level represents a decrease of $2 million, or 6.7 percent,
from the 1997 forecast of $30 million. Much of the decrease is
due to the City's practice of not appropriating certain categorical
funding sources, such as federal funds, at the time of adoption.
Instead, the City adds the funds to the budget during the year
as they are received. As proposed in the Mayor's preliminary
budget, significant reductions are planned for the Community Revitalization
(CR) Program and the contract for the Convention and Visitors
Bureau (CVB), in the amounts of $1.1 million and $1.9 million,
respectively. The executive budget proposes to remove all City
funding from the CR program, a program supporting local development
corporations (LDCs), leaving funding only for LDCs that qualify
for federal community development funding. In the case of CVB,
the $1.9 million reduction represents about 60 percent of the
portion of its expense budget that comes from the City.
As a new gap reduction initiative, the executive budget proposes
to reduce EDC's City funding by $5.2 million in 1998. Of this
amount, $1million is a recurring funding reduction, which the
Mayor's office determined was possible based on a more in-depth
analysis of EDC financial plans than had been done in the past.
The same sort of analysis in January of this year led the administration
to draw down what was determined to be a $10 million excess EDC
fund balance.
The above reductions would be offset with increases of $700,000
for heat, light, and power and $136,000 collective bargaining
costs. In addition, the executive budget proposes to add $600,000
in 1998, and $300,000 annually thereafter, for the maintenance
of the Midtown Community Court.
Board of Elections
| |
1997
Adopted |
1997
Forecast |
1998
Executive Budget |
Increase/(Decrease)
Over 1997 Forecast |
| |
|
|
|
Amount |
Percent |
| City |
27 |
31 |
31 |
- |
- |
| State/Fed |
- |
- |
- |
- |
- |
| Total |
27 |
31 |
31 |
- |
- |
|
| Headcount |
312 |
312 |
303 |
(9) |
(2.9) |
The executive budget for the Board of Elections is $31 million,
a decrease of $600,000, or 1.7 percent from the 1997 forecast.
This decrease is due largely to an expected reduction in agency
headcount.
Campaign Finance Board
| |
1997
Adopted |
1997
Forecast |
1998
Executive Budget |
Increase/(Decrease)
Over 1997 Forecast |
| |
|
|
|
Amount |
Percent |
| City |
3 |
4 |
22 |
18 |
450.0 |
| State/Fed |
- |
- |
- |
- |
- |
| Total |
3 |
4 |
22 |
18 |
450.0 |
|
| Headcount |
36 |
36 |
36 |
- |
- |
The Mayor's budget proposes to spend $22 million for the Campaign
Finance Board in 1998, an increase of $18 million, or 450.0 percent,
from the 1997 forecast of $4 million. This increase is driven
by the Board's estimate of costs associated with providing public
matching funds for the 1997 election. (For more detail, please
see our discussion in Chapter 4.)
Chapter
4
Major Issues
This chapter presents discussions of a diverse assortment of issues,
each of which has significant budgetary implications for New York
City.
State Agenda
The Mayor's budget contains a number of assumptions about State
legislative actions that would significantly benefit the City
in 1998. These assumptions, carried in the City's budget, would
require State legislative action and they form the basis of the
City's lobbying agenda in Albany. Specifically, the budget assumes
$294 million in savings from legislation the City has requested
to increase State support for disabled pre-school students, raise
the City's portion of statewide revenue sharing dollars, and reduce
local taxes. In addition, the City's budget assumes $128 million
in savings attributable to both a larger City share of federal
welfare grant funds and State reforms to Medicaid, and $115 million
in State legislative actions to restore cuts proposed by the Governor.
The scale of the Mayor's agenda is ambitious, and the legislative
viability of some items is questionable, such as a $142 million
revenue sharing payment acceleration and a $46 million increase
in the revenue sharing program itself. The City, however, could
stand to benefit from a surge in State revenues. The Governor
recently revised his original projection of State fiscal year
1998 revenues to be $1.5 billion higher than projected in January-significantly
closer to the Assembly's revenue projection. Given the flexibility
that a State budget surplus provides, it is not unreasonable to
expect that at least some of the increased State aid or reforms
assumed in the Mayor's budget will be achieved.
Requested Legislation. The largest requested legislative
action is the proposal to accelerate the March revenue sharing
payment. Commonly known as a revenue spin-up, this proposal would
permit the State to produce a one-time revenue benefit to the
City of $142 million. The State would accelerate payment of its
March 1999 payment to September or December 1998 so that the City
could count it as part of its 1998 budget. There seems to be little
public policy or accounting rationale to support such a move.
The City is requesting the State increase the total amount of
revenue shared by the State with the City under the State's revenue
sharing program. Total State revenue sharing funds have not increased
since State fiscal year 1994-95. The Assembly's adopted 1997-98
budget bill includes a $78 million statewide increase and allocates
$31 million of the additional funding, roughly 40 percent, to
the City in 1998. The Mayor's budget assumes the City will receive
its historical 60 percent share of the statewide increase ($46
million). The request to increase Stock Transfer Incentive Aid
by $25 million is another effort to increase the City's share
of an aid source that has not increased since 1992.
The City's agenda contains a tax reduction proposal as an alternative
to the Governor's local school tax relief proposal (STaR). STaR
would replace local reductions in the school property tax for
homeowners with State aid. Application of this statewide initiative
to the City's unique tax system and housing structure would give
the City a share of aid that is significantly below any reasonable
benchmark for equitable distribution. IBO estimates that City
homeowners would receive less than 9 percent of total statewide
benefits under STaR. (See Chapter 2 for additional information.)
The City's alternative tax reduction proposal takes into account
the City's unique situation, producing benefits to the City of
$47 million, or 40 percent of the statewide total. While the
Mayor's budget assumes the $47 million in revenues, an equal offsetting
entry in tax reductions would prevent failure to enact the City's
proposal from affecting the City's budget balance.
Entitlement Savings Proposals. The Governor's budget
contains $338 million in Medicaid savings for the City. The Legislature,
however, has historically been unwilling to go along with proposed
Medicaid cost containment and savings packages, and this year's
budget negotiations promise a familiar stand-off. (The Assembly's
budget bill restores nearly all of the Governor's savings.) The
Mayor has recognized $51 million of the cost containment measures
as achievable, given the current political climate, while IBO
estimates Medicaid savings of only $40 million. (See Chapters
3 and 4 for additional information.)
The Mayor has also requested that the State increase the City's
share of federal welfare funds under the Temporary Assistance
for Needy Families (TANF) program. Because federal grant funds
are based on 1995 caseload levels, which have been substantially
reduced in New York State over the past two years, a surplus of
about $730 million has materialized. Accordingly, the Mayor has
budgeted $77 million of these surplus TANF funds to help the City
defray its share of welfare-related costs. The prospects of the
City realizing these funds may be improving given ever-increasing
publicity over their use.
Baseline Restorations. State budget negotiations
involve legislative restorations of cuts proposed by the Governor.
The Mayor's baseline assumptions depend on legislative budget
actions in nine areas to restore cuts proposed in the Governor's
budget. For example, the Governor proposes to lower probation
aid through a reimbursement rate reduction that would cost the
City $4.3 million if not restored by the State legislature. Similarly,
the Mayor's budget assumes other State budget restorations for
Medicaid overburden aid, local highway improvement (CHIPS), New
York City Housing Authority operating aid, and aid for summer
school programs. These budgeted baseline restorations total $115
million in 1998.
Public Assistance
While the Mayor's executive budget begins to recognize the effects
of the new welfare law, it largely reflects the expectation that
caseloads for Home Relief (HR) and Aid For Families with Dependent
Children (AFDC), now Temporary Assistance for Needy Families (TANF),
will continue to decrease.16 The budget projects that the number
of HR recipients would fall from 188,000 in March 1997 to 183,000
in June 1997, and then rise rapidly to 222,000 in June 1998 before
falling again to 214,000 in June 1999. The budget also projects
that the number of persons on AFDC (TANF) would decrease steadily
from 725,000 in March 1997 to 710,000 in June 1997, 663,000 in
June 1998, and 633,000 in June 1999, leveling off after that point.
As a result of these expected caseload changes, the budget projects
that total spending for HR would increase from $563 million in
1997 to $625 million in 1998, and then fall to $572 million in
1999, $473 million in 2000, and $474 million in 2001.17 Total expenditures
for TANF would decrease from $1,565 million in 1997 to $1,428
million in 1998, $1,330 million in 1999, and $1,286 million annually
in 2000 and 2001. The Mayor's budget projections depart significantly
from the public assistance projections in the preliminary budget
by more fully accounting for the effects of the new federal welfare
law. This brings the Mayor's projections closer to the IBO's
public assistance forecasts in our Analysis of the Mayor's
Budgetary Proposals, prepared in response to the preliminary
budget. The two current sets of projections are compared in Figure
4-1.
Figure 4-1.
IBO Reestimate of the Mayor's Budgetary Proposals for Public
Assistance
(In millions of dollars)
                                          1997       1998       1999      2000       2001
HOME RELIEF
Persons on Assistance in June
     Mayor                            183,000    222,000     214,000   215,000    215,000
     IBO                              182,000    215,000     219,000   221,000    224,000
     Difference                       (1,000)    (7,000)       5,000     6,000      9,000

Net Cost of Cash Grants
(Including PEGs)
     City
          Mayor                           282        312         286       237        237
          IBO                             282        291         286       245        248
          Difference                        0       (21)           0         8         11

     Total
          Mayor                           563        625         572       473        474
          IBO                             563        583         572       489        495
          Difference                        0       (42)           0        16         21

TEMPORARY ASSISTANCE FOR NEEDY
FAMILIES
Persons on Assistance in June
     Mayor                            710,000    663,000     633,000   634,000    634,000
     IBO                              713,000    690,000     671,000   668,000    665,000
     Difference                         3,000     27,000      38,000    34,000     31,000

Net Cost of Cash Grants
(Including PEGs)
     City
          Mayor                           371        260         244       233        232
          IBO                             371        269         266       255        253
          Difference                        0          9          22        22         21

     Total
          Mayor                         1,565      1,428       1,330     1,286      1,286
          IBO                           1,566      1,465       1,417     1,376      1,370
          Difference                        1         37          87        90         84

TOTAL PUBLIC ASSISTANCE
Persons on Assistance in June
     Mayor                            893,000    885,000     847,000   849,000    849,000
     IBO                              895,000    905,000     890,000   889,000    889,000
     Difference                         2,000     20,000      43,000    40,000     40,000

Net Cost of Cash Grants
(Including PEGs)
     City
          Mayor                           653        572         530       470        469
          IBO                             653        560         552       500        501
          Difference                        0       (12)          22        30         32

     Total
          Mayor                         2,128      2,053       1,902     1,759      1,760
          IBO                           2,129      2,048       1,989     1,865      1,865
          Difference                        1        (5)          87       106        105
SOURCE: Independent Budget Office.
While the overall trend is still downward, the Mayor's projections
now include an assumption that 58,000 individuals will join the
HR rolls in the fall of 1997 as a result of federal welfare provisions
making most legal aliens ineligible for Supplemental Security
Income (SSI). IBO's assumptions are slightly more optimistic,
assuming that 50,000 persons will transfer from SSI to HR at that
time, resulting in a June 1998 projection of 215,000 compared
to the Mayor's 222,000. In the out-years of the financial plan,
IBO projects somewhat higher HR caseloads than the Administration
due to the ongoing effects of the federal welfare law on future
immigrants.
Similarly, the Mayor's projections now take into account the likely
movement of significant numbers of persons from SSI to TANF as
a result of the new welfare law, but they assume that this will
be more than offset by continued rapid decreases in the family
assistance rolls over the next two years as a result of City policy
changes. The Mayor projects a June 1998 TANF caseload of 663,000.
IBO, however, forecasts less rapid decreases resulting in a caseload
of 690,000, or 27,000 persons higher than the Mayor's projection.
While caseloads for both HR and TANF continue to decrease, a high
degree of uncertainty accompanies future caseload projections
given both the failure of the State to implement its welfare reform
plan and the possible changes to the new federal law resulting
from the recent budget agreement. These issues are discussed
below.
Albany. At the time this analysis was completed,
there were two formal welfare plans under consideration by the
Legislature: one proposed by the Governor last November and one
developed by the Assembly and approved by that body as a one-house
bill on April 1. The significant differences between the two
plans make it difficult to predict the outlines of a final agreement.
These differences are summarized in Figure 4-2.
Both of the welfare reform plans would increase the number of
public assistance categories from the current two to three in
the case of the Governor's plan and five in the case of the Assembly
plan. Both plans would place time limits on eligibility for certain
cash assistance programs. The Governor's plan would also decrease
benefit levels over time for family cash assistance while the
Assembly plan would maintain current benefit levels. In both
plans some categories of recipients would be limited in whole
or in part to non-cash forms of assistance.
Washington. On May 2, 1997, the Clinton
Administration reached agreement with the Republican Congressional
leadership on a plan to balance the federal budget in five years.
The agreement includes funds to preserve SSI for many disabled
immigrants who were scheduled to lose their benefits in August
as a result of a provision in the new federal welfare law.
The details of the agreement are still not clear. However, preliminary
information obtained from the Congressional Budget Office indicates
that the agreement could exempt up to 80 percent of the legal
aliens who were scheduled to lose SSI in the coming months. Nationwide,
this would include 200,000 disabled recipients as well as an estimated
two-thirds of the 300,000 individuals who are currently qualified
on the basis of age but are now expected to qualify as disabled.
These figures include only legal aliens who entered the country
prior to the passage of the welfare law. It is not clear if the
agreement covers immigrants who arrive after that date, but recent
statements attributed to Congressional leaders suggest that it
does not.
If the SSI provision of the budget agreement is implemented it
would have a significant impact on the New York City budget, reducing
total welfare expenditures by as much as $80 million in 1998.
Figure 4-2.
Summary of New York State Public Assistance Plans
       Current System               Governor's Plan               Assembly's Plan

Two-tiered system including  Three-tiered system           Five-tiered system
AFDC for families with       including:                    including: TEAF for families
minor children and HR for    NY Works for most families;   for five years; SNAF for
others.                      TDA for those aged 60-64,     families beyond five years;
                             the temporarily disabled,     TEA for childless adults for
                             and caretakers for the        two years; SNA for childless
                             disabled; and Article XVII    adults beyond two years; and
                             Safety Net for others.        DSA for those aged 60 and
                                                           over, the disabled, and
                                                           caretakers for the disabled.

No time limits on            Five year limit on            Five year limit for TEAF;
eligibility or benefit       eligibilty for NY Works.      then families move to SNAF.
levels.                      Benefit levels for NY Works   Two year limit for TEA; then
                             start to decline after 18     childless adults move to
                             months. After five years      SNA. No time limits on
                             families could receive        benefit levels.
                             Article XVII Safety Net.

Grants are in cash, except   Grants are in cash for NY     Grants are in cash for TEAF,
in cases of direct payments  Works and TDA. No cash        TEA, and DSA. For SNAF and
to landlords.                assistance for Article XVII   SNA, utilities would be paid
                             Safety Net; recipients would  by direct vendor payment,
                             receive in-kind or voucher    and rent would be paid by
                             assistance to cover such      two-party check or by direct
                             basic needs as food and       vendor payment to landlord.
                             shelter.                      For the remaining grant,
                                                           called basic needs
                                                           assistance, at least 80
                                                           percent would be accessible
                                                           only through an electronic
                                                           transfer system.

Numerous statewide special   Individual special grant      All special grants are
grants are available for     categories are proposed by    maintained, without caps.
eligible recipients.         localities and approved by
                             the State. There is a cap on
                             total State funding for
                             special grants.
| PROGRAM DEFINITIONS: |
AFDC (Aid to Families with Dependent Children)- the current system of cash grants to families with minor children.
HR (Home Relief) - the current system of cash grants to individuals
and families without minor children.
NY Works (New York Works) - proposed system of cash grants
to families with minor children. Limited to five years.
TDA (Temporary Disability Assistance) - proposed system of
cash grants to those 60-64, the disabled and their caretakers.
Article XVII Safety Net Assistance - proposed system of non-cash
assistance to those ineligible for NY Works or TDA.
TEAF (Transitional Economic Assistance for Families) - proposed
system of cash grants to families with minor children. Limited to five years.
SNAF (Safety Net Assistance for Families) - proposed system of mostly non-cash assistance to families with minor children who reach TEAF limit.
TEA (Transitional Economic Assistance) - proposed system of cash grants to individuals and families without minor children. Limited to two years.
SNA (Safety Net Assistance) - proposed system of mostly non-cash assistance to individuals and families without minor children who reach TEA limit.
DSA (Disability Support and Assistance) - proposed system of cash grants to those 60 and over, the disabled and their caretakers. |
Medicaid
The Mayor's executive budget for the Human Resources Administration's
(HRA) Medicaid program has undergone significant changes since
the preliminary budget. The preliminary budget assumed adoption
of the Governor's budget proposals to contain Medicaid costs.
As a result, HRA was expected to save $3 million in 1997, $260
million in 1998, and $223 million each year through 2001.
The executive budget, however, reflects more modest expectations
of State savings and brings the Mayor's projections much closer
to IBO's estimate. The Administration now projects savings due
to State actions to range more conservatively from $51 million
in 1998 to $104 million in 2001. Consequently, the executive
budget projects that the City will spend $2,119 million on Medicaid
in 1998, $2,184 million in 1999, $2,258 million in 2000, and
$2,341 million in 2001.
IBO continues to project that Medicaid expenditure growth rates
will increase at a slightly faster pace than estimated by the
Mayor. IBO projects that overall City expenditures on Medicaid
will grow by 3.67 percent annually over the Financial Plan period
while the executive budget provides for an average yearly growth
rate of 3.06 percent. More specifically, we expect that expenditure
growth for areas such as personal care and prescription drugs
will outpace the Mayor's projections. As a result, IBO estimates
City spending on Medicaid will total $2,150 million in 1998, $2,217
million in 1999, $2,306 million in 2000, and $2,402 million in
2001. The difference between the Mayor's and IBO's Medicaid projections
are illustrated in Figure 4-3.
IBO's current Medicaid projections have incorporated modest cost
savings based on our assessment of several initiatives. Given
the likelihood of Medicaid managed care and the probability of
legislative approval of a few of the Governor's proposals, IBO
projects that these initiatives will decrease City expenditures
by $40 million in 1998 rising to $99 million in 2001 compared
to our reestimate of the preliminary budget. Although the State
still awaits the federal waiver necessary to mandate the enrollment
of Medicaid recipients into managed care plans, it appears highly
likely to be granted in time to affect 1998 spending. In addition,
IBO expects that certain initiatives proposed by the Governor
to produce minor savings in hospitals and nursing homes will be
enacted by the State legislature. In contrast, the Mayor's executive
budget still anticipates savings-namely from unspecified fraud
prevention activities and rate appeal moratoria-that we expect
will either not be adopted or not achieve the estimated levels
of reductions in Medicaid spending.
More generally, whether the conversion of the Medicaid program
from a fee-for-service system to a managed care environment will
generate the desired savings and maintain quality is uncertain
at this time. On the one hand, the centerpiece of the City's
Medicaid managed care initiative is mandatory enrollment and the
participation of Home Relief clients and the subsequent increase
in federal revenue is likely to reduce City Medicaid expenditures.
On the other hand, more attention must be paid to factors beyond
enrollment if managed care is to prove successful in reducing
costs without eroding service quality. These factors include
but are not limited to provider incentives, quality assurance,
and administrative oversight, all of which carry programmatic
and budgetary ramifications for a successful Medicaid managed
care program, but have not been fully addressed.
Figure 4-3.
IBO's Reestimate of the Mayor's Budgetary Proposals for HRA's
Medicaid Program
(In millions of dollars)
                                          1997       1998       1999      2000        2001

Medicaid Cost Projections (City
Funds)
          IBO                            2,080      2,150      2,217     2,306       2,402
          Mayor                          2,076      2,119      2,184     2,258       2,341
          Difference (IBO - Mayor)           4         31         33        48          61
SOURCE: Independent Budget Office.
HHC's New Affiliation Contracts and
Health Care Quality Assessment
The executive budget proposes to increase New York City's total
contribution to the Health and Hospitals Corporation (the Corporation
or HHC) to $702 million from the 1997 forecast of $682 million.
This $20 million increase, however, follows nearly $350 million
in reductions in the City's total contribution since 1995. Overall,
the budget projects that HHC's gross revenues, which were $3.6
billion in 1995, will fall to $3.2 billion in 1998.
In order to reduce expenditures to meet falling revenues over
the past few years, the Corporation has successfully implemented
multiple cost saving initiatives. While these initiatives have
improved HHC's financial condition, concerns remain about the
effects they have had on the quality of care. One of the most
noteworthy of these initiatives is the revision of HHC's affiliation
agreements-contracts in which HHC pays private medical institutions
for the operation of municipal beds. The new contracts will save
the Corporation at least $180 million over the next four years
and introduce productivity measures that will permit assessments
of the impact of managed care and budget changes on the performance
of the affiliates.
Background. Two primary factors prompted
the revision of the contracts in the last year.18 First, many of
the HHC facilities did not communicate effectively with their
affiliates, producing a situation that has been characterized
as having "a pervasive sense of mistrust."19 Among other
things, HHC could not confirm concerns about affiliate operations
because there were limited auditing opportunities for investigating
how the affiliates used HHC's dollars. Second, there were concerns
that productivity at Corporation facilities was not on par with
national averages. The United Hospital Fund cited the following
instance: "An affiliate had 165 physicians on the payroll
providing the level of patient services that actually required
only 54 physicians."20
In order to address these issues, the new contracts revise the
methodology used to determine the payment HHC provides the affiliates.
The affiliates formerly received a flat fee not linked to the
volume of services provided and had discretion over the money
they received. Under the new methodology, Relative Value Units
(RVUs) will determine the level of payment the Corporation will
provide each affiliate. The RVU methodology, devised initially
for the Medicare program, will permit HHC to evaluate the quantity
of resources used by the affiliates.
With this new payment methodology, HHC gains greater control over
its affiliates which are themselves restructuring to survive in
the new health care environment. In addition, according to these
new contracts, the Corporation can, on a monthly basis, evaluate
its affiliates to observe whether they are meeting productivity
targets which the Corporation and each affiliate selected collaboratively.
Fines may also be levied by the Corporation on an affiliate should
it fail to meet the established targets.
Cost Savings. The Corporation's actual payments
to its affiliates were $534 million in 1995 and $508 million in
1996. When the 1997 budget was adopted, it was anticipated that
affiliation agreements would cost $486 million in 1998 and $500
million in 1999. The 1998 executive budget now estimates that
the new contracts will cost significantly less: the Corporation
is expected to pay the affiliates $440 million in 1998 and $420
million in 1999.
According to projections made by the Administration together with
HHC budget staff, the revised affiliation contracts generate the
only savings the Corporation will be certain to capture in the
years to come. As can be seen in Figure 4-4, these projections
anticipate that, in each of the next couple of years, costs from
the new contracts will represent a smaller portion of total expenditures.
Personnel costs, including fringe benefits, are projected to
grow steadily from $1.9 billion in 1998 to $2.1 billion in 2000.
Likewise, costs for non-personnel items will increase from $732
million in 1998 to $770 million in 2000. Therefore, with decreased
revenue ensured as managed care continues to favor reimbursement
for less expensive care, the expected savings from the revised
affiliation agreements will be critical for the Corporation to
avoid annual deficits.
Figure 4-4.
Affiliation Agreement Expenses and Total HHC Expenditures
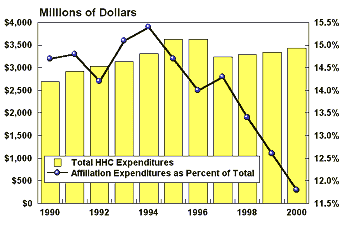
SOURCE: Independent Budget Office.
The new contracts may also have positive implications for patient
care. In the past, affiliates have been charged with focusing
more on their teaching needs than on patient care. By measuring
productivity, HHC can monitor the affiliates to ensure that patients'
needs come first. Problems with these measures, as with most
of the available systems of health care performance measurement,
however, may inhibit evaluations of quality of care at HHC.
Assessing Quality in Health Care. Managed
care and concerns about the growth of health care costs spurred
the creation of systems of health care quality measurement. One
widely used is the Health Plan Employer Data and Information Set
(HEDIS) measures constructed by the National Committee on Quality
Assurance (NCQA) and designed for employers and health plans.
Meanwhile, as a major purchaser of health care, the federal government
has developed its own quality of care indicators. For example,
the Health Care Finance Administration (HCFA) has developed statistical
models to evaluate quality through surveys of mortality rates.
While there is variation in the new contracts, most of the contracts
contain "quality of care performance indicators," including
the number of two-year-olds fully immunized documented (at least
95 percent) and the number of women between 51 and 64 who have
mammograms performed (at least 90 percent). The new contracts'
"quality of service" indicators will track the number
of timely emergency consults and the number of charts completed
within thirty days of discharge.
The new contract's productivity measures, like the more established
models, however, demonstrate the difficulties in measuring health
care quality. Quality of care can be a very subjective concept.
If one relies on consumer satisfaction, quality of care is subject
to the varying preferences of individuals. A more consistent
source might be a physician's adherence to technical standards,
although even this may fluctuate dramatically given resources
available, the setting where the care is given, and the case history
of the patient. Additionally, performance indicators are often
described in medical terminology that may not be understood by
non-physicians.
Even the quality of care models such as the HEDIS measures face
substantial hurdles. The focus of many of these models is not
on outcomes, which refer to the end results of care, because they
can be ambiguous. For example, a patient's death does not necessarily
reflect lower quality of care. A patient may die despite receiving
the best care possible. Meanwhile, process measures, which describe
the nature and quantity of care provided, tend not to account
for variations in patient characteristics. A consumer may also
find it difficult to assess a hospital's service if it receives
a high score for one process and a low score for another.
Finally, these models do not address possible variations in the
population a hospital serves. Public hospitals provide a disproportionate
share of health care to the indigent,21 who are likely to be sicker
than other population segments. Failing to account for this variable
does not permit a fair comparison between public hospitals and
their private counterparts. These models also rely on the ability
of a hospital to collect a huge range of data on patients. A
hospital simply may be disinclined or unable to do this consistently
and accurately. Moreover, the advent of managed care has aggravated
problems with performance measurement in health care. Treatments
for some diagnoses may have changed, for example, given managed
care's emphasis on outpatient care rather than on inpatient care.
The result, then, is too few cases available from new or altered
care settings-an insufficient sample size-to determine the cause
of the outcome achieved.
Taken together, the revision of the affiliation contracts facilitates
the assessment of the performance of the Corporation. The projected
cost savings and their impact on the City budget can be monitored
and tracked. In addition, while better measures would be difficult
to find, the productivity measures initiated as part of these
affiliation contracts represent a significant step towards permitting
evaluations of quality of care.
Administration for Children's Services
The agency's reform plan, entitled ACS Plan of Action,
addresses long-standing dysfunctional systems, practices, and
organizational culture that have prevented the City from effectively
serving its most vulnerable children and families. Implementation
of the Plan has been underway since its release in December 1996.
The executive budget proposes $35.7 million for continuing costs
to implement the reorganization plan. This new funding would
provide additional resources for automation support and other
program enhancements. ACS would receive $949,000 to provide staff
with support for using the State Child Welfare Automated Information
System. This system is used to automate child welfare information
for purposes of tracking cases through the system and providing
data for calculating the City's reimbursement from the State.
The remaining $5.8 million are for an additional 13 new positions
and various programmatic improvements such as enhancement of the
medical unit for comprehensive health and mental health assessment,
and the development of an interagency unit designed to facilitate
ACS' collaborations with other City agencies. Funding for preventive
planning to help create strong neighborhood network services and
protect children before abuse occurs remains unchanged at its
1997 level of $939,754.
Total funding requested for the ACS restructuring initiative is
$37.7 million over two years: $2.4 million in 1997, and $35.7
million in 1998. Through the new funding and reform plan, the
agency has made strides in modernizing its work environment.
Among other things, the agency's technological capacity has been
enhanced, paper work backlogs have been reduced, and more effective
operations within the divisions of child protection, family permanency,
and legal services have been facilitated. However, some areas
of concern persist.
The agency's responsibility for child care will increase substantially
as a result of the transfer of the Agency for Child Development
(ACD) into ACS. While ACS was previously responsible for child
protective services, foster care, adoption and Head Start, it
will now have the additional responsibility of providing child
care to about 60,000 children in New York City. This number represents
the total population currently in ACD group day care, family day
care, informal care, and Head Start. Given that recent estimates
indicate that only 16 percent of eligible children in the City
receive publicly subsidized child care, the agency will need to
address anticipated child care needs of low income families and
public assistance recipients.
The child care requirements resulting from recent changes in welfare
programs raise issues regarding the types of child care the City
provides as it implements the new law. The executive budget proposes
to spend $17.8 million for 8,700 new day care slots related to
the work requirements of the Temporary Assistance for Needy Families
program. These slots, however, are allocated to the Office of
Employment Services (OES), which administers day care slots for
the children of parents who are either on public assistance and
involved in employment-related activities or who have recently
left public assistance.
The new slots are expected to be provided primarily through informal
day care arrangements.22 On average, informal day care costs 51
percent less than group day care slots and 24 percent less than
family day slots, both of which are regulated. While about 88
percent of children receiving publicly funded day care through
OES are in informal day care, less than one percent of children
receiving day care through ACD are served through such arrangements.
Among other things, the expansion of informal day care due to
welfare reform may place even more children in day care environments
without the safeguards of ACD and Department of Health regulations
or monitoring.
Student Enrollment and School Capacity:
September 1997 Condition and Beyond
Figure 4-5.
Actual and Projected Student Enrollment, 1987-2001
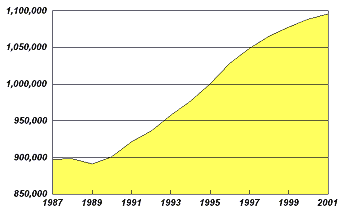
SOURCE: Independent Budget Office; Office of Management and Budget.
Public school enrollment is expected to continue to grow through
the duration of the financial plan period and beyond. In the
last five years, Board of Education (BOE) enrollment has grown
by over 100,000 students to 1,049,000 in 1996-97 (excluding long-term
absences). This growth has contributed to what BOE estimates
was an overload of more than 86,000 students when schools opened
in September 1996, despite the addition of more than 18,000 new
seats over the previous year.23
For 1997-98, BOE and the Administration project an increase of
over 16,000 new students, bringing total enrollment to 1,065,000.
Teachers and guidance counselors are being added to the operating
budget to support this increase. Some operating resources are
also provided to lease new space. Most of the resources for new
space, however, are found in the capital budget and do not produce
new seats immediately.
While the Mayor proposes new capital budget spending for the 1997-99
fiscal year period, there is likely to be continued overcrowding
for the foreseeable future. The additional new seats planned
in September 1997 will provide for expected growth but only slightly
reduce existing overcrowding. In 1999 and 2000, the Mayor's plan
may have a greater impact, depending on enrollment growth patterns.
Implications of Overcrowding. Even though overcrowding
is often discussed in units of seats, overcrowding in schools
does not mean that students are without desks. It means that
more students are present than the educational facilities were
designed to support. As a result, some schools have had to conduct
classes in libraries or makeshift arrangements in spaces, such
as cafeterias or gymnasiums, that were not designed to act as
classrooms. In other cases, class sizes have been increased;
this strategy, however, has prompted the teachers' union to file
several thousand grievances for overcrowding. A third measure,
employed in a few cases around the City, is the implementation
of double-session schools, where some students attend school in
the morning for an abbreviated day of four hours and others attend
in the afternoon for the same period of time.
Besides the possible negative educational impact of each of the
above strategies-especially the double-session schools where students
are actually receiving less instructional time-overcrowding generally
strains the capacity of buildings to adequately serve students.
It should be noted that overcrowding is affecting many more than
86,000 students this year; the total population of overcrowded
schools is much larger.
Projection of September 1997 Condition. The Mayor's
budget would add significantly to existing plans to spend $418
million for 28,000 seats of new school capacity from 1997 to 1999.
Specifically, the Mayor would add $717 million for an additional
60,000 new seats.24 Because the proposal is concentrated on transportable
and modular units and leased and rehabilitated space, the seats
would be available sooner and at less cost than would be possible
with new school construction. On the other hand, the seats would
also probably have a shorter useful life than would be possible
with new construction.
Figure 4-6.
New Capacity By Type, 1997-99
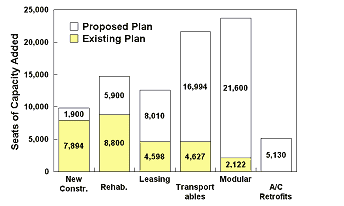
SOURCE: Independent Budget Office; Board of Education.
Of the 88,000 projected new seats in the plan, a total of 24,000
are planned to be available by September 1997 for the new school
year. Given existing overcrowding of 86,000 students and the
16,000 new students expected, BOE can still expect an overload
of at least 78,000 students. The remaining 64,000 seats are projected
to be provided by the beginning of the 1999-2000 school year.
Over the same time period, enrollment is expected to increase
by 23,000. Thus, while overcrowding might be reduced by as much
as 41,000 students; the system would still face an overload of
37,000 students for the 1999-2000 school years.
Exacerbating Factors and Other Considerations.
In addition to enrollment growth, other factors, such as the uneven
nature of enrollment growth, exacerbate current and future conditions.
In recent years, enrollment has grown disproportionately in certain
districts while holding steady or even dropping in others. The
pattern is expected to continue as enrollment is projected to
grow most where overcrowding is already a problem. If BOE's projections
are accurate, the pattern of enrollment growth will be such that
more seats will be needed than simply the net number
of students entering the system. There is expected to be an increase
of students in overcrowded districts and a decrease of students
in underutilized districts.
An additional difficulty is the magnitude of BOE's other capital
investment needs. Major investments are required for basic state
of good repair needs (for example, replacing leaky roofs) and
facility upgrades (such as installation of electrical and telecommunications
wiring necessary to support computers). Although efforts are
being made on all three fronts-state of good repair rehabilitations,
facilities upgrades, and capacity increases-limited capital funds
have forced BOE and the City to make difficult choices in the
capital plan, to the extent more funds for rehabilitation means
less for enrollment.
In fact, despite enrollment growth, capacity needs have had to
remain a secondary consideration and facility upgrades have gotten
even less priority. BOE's current five-year (1995-99) capital
plan focuses most of its attention and dollars on rehabilitation.
But unattended state of good repair needs can both reduce existing
capacity and become much more expensive over time. In recognition
of this need, the entire $1.39 billion added to the capital budget
last year by the City Council and Mayor is devoted to work on
building envelopes, including windows, exterior walls,
and roofs.
Claims for Prior-Year Education Aid
The issue of State reimbursement of prior-year education expenditures
remains unresolved, but may be addressed by the State legislature
in the 1997-98 session. At stake for the City are millions of
dollars in claims with significant implications for the City's
budget.
Background. State law provides a mechanism
for the State to partially reimburse school districts for expenditures
made in prior years related to a variety of services such as transportation
and special education. But getting reimbursed can be a long and
arduous process. Historically, school districts have not submitted
their claims in a timely manner. Making matters worse, the State
approves and pays these claims only they have made their way through
a process that often takes years to complete. As school districts
fell increasingly behind in submitting their claims, it became
increasingly difficult for the State to plan its expenditures
for the year.
In response, the State established a schedule of deadlines in
the 1994-95 State budget for school districts to submit their
prior-year claims. There was, however, no provision in the new
law to require the State to provide reimbursement to school districts
in a more timely manner. Thus, while the Board of Education (BOE)
and other school districts have been filing their claims expeditiously
given the new statutory deadlines, the State has not been coming
up with the money to pay for the increase in claims. The effect
of the deadline has been to increase the amount of claims submitted
without increasing the outflow of reimbursement funds, exacerbating
the backlog of prior-year expenditure reimbursement.
Implications for the City Budget. The State's
failure to increase the appropriations to pay for claims authorized
by the State has significant implications for localities, like
the City, that carry these reimbursements for prior-year claims
as receivables on their balance sheets.
Hurdles to Resolving this Issue. A major obstacle
to resolving the issue lies in the state aid formula itself, which
limits the total amount of statewide prior-year reimbursement
to only $21.8 million in the current year. Current law further
limits the City's share of these funds to 40 percent, or a maximum
of about $8.7 million per year. Given the large sums of money
owed to the City, this created limitation would stretch reimbursement
of the City's submitted claims over a 75-year period.
Difficulty in resolving this issue is compounded by apparent differences
between State and City officials over the amount of money owed
by the State. According to the State Education Department (SED),
the State owes the City $108.8 million in aid for prior-year claims
for services provided between 1989 and 1991, based on audits that
have been completed to date. The SED still must audit an additional
$547.5 million worth of City prior-year claims made between 1989
and 1995.
According to BOE and the City Comptroller, however, the State
owes the City a total of $900 million in prior-year claims retroactive
to 1989, including $244 million in past special education expenditures
which are reimbursed through a separate formula. The summation
of those claims audited and approved to date, those claims that
still need to be audited, and the special education claims equal
the $900 million in prior-year aid estimated by BOE and the City
Comptroller.
Resolving this issue remains on the agenda in Albany. Given a
recently strong revenue stream, the State now has an opportunity
to clean up prior-year expenditures for the City. An agreement
to schedule annual appropriations for the City could resolve the
problem over a number of years and provide assurance to the financial
community that the State will pay prior-year receivables carried
by its localities.25
Bronx Garbage Exportation
As part of its effort to close the Fresh Kills landfill by the
end of 2001, the Department of Sanitation (DOS) is preparing to
implement the first stage of residential waste exportation. When
Fresh Kills ceases operations, all waste that is not recycled
must be sent either upstate or out of state for disposal. The
City will soon issue contracts to private waste companies for
transportation and disposal of the 1,750 tons of trash per day
generated in the Bronx. The program is scheduled to begin in July
1997 with expansion to the other boroughs incrementally over the
next four years.
Exporting garbage will cost the City more than the current practice
of dumping at Fresh Kills. Funds have been added over the past
two years at different stages of the budget process. Figure 4-7
summarizes the funds included in the executive budget for this
purpose and their sources.
Figure 4-7.
Funding for Waste Exportation
(In thousands of dollars)
January 1996 Financial Plan    7,500
1998 Preliminary Budget       12,366
1998 Executive Budget         10,000
Total funds for waste
exportation                   29,866
SOURCE: Independent Budget Office.
Figure 4-8 details the various components and projected costs
of the waste exportation program. The costs of privatizing waste
disposal in the Bronx has two components. First, private companies
hired to export the garbage will charge the City on a per-ton
basis established by the forthcoming contracts. While the final
figures are not yet available, the City received bids ranging
from $46.64 to $66.50 per ton. In addition, DOS must hire 34
additional staff to manage and monitor these contracts.
However, exporting waste is expected to produce some offsetting
savings in DOS. The City will close the Bronx marine transfer
station (MTS) and reassign uniformed MTS personnel currently at
the facility to other areas of the Department, resulting in overtime
savings in those areas. The reduced flow of residential garbage
to Fresh Kills should also result in lower landfill operating
costs, including reductions in headcount (due to attrition) and
savings in overtime for workers at the landfill.
Figure 4-8.
Estimated Net Cost of Waste Exportation from the Bronx
(In thousands of dollars)
| Estimated Costs: |
| Waste export contracts | 28,216a |
| Contract management | 1,650 |
| Total Costs | 29,866 |
| Estimated Savings: |
| Overtime savings due to redeployment of MTS staff | (1,155) |
| Headcount reduction at landfill | (1,126) |
| Overtime savings at Fresh Kills | (1,025) |
| Total Savings | (3,306) |
| Estimated Net Cost | 26,560 |
SOURCE: Independent Budget Office. |
| NOTE: (a) Assumes export of 1,700 tons of garbage per day, 302 days per year. |
Based on the estimated amount of the waste export contracts, the
per-ton cost would be about $55, which is within the lower range
of the bids received by the City. Assuming this price applied
to all of New York City, exporting all residential waste would
cost about $145 million to $210 million, depending on the tonnage.
Future exportation costs, however, will depend on the success
of waste reduction and recycling initiatives and the market for
landfills and incinerators outside of New York City. To the extent
that contract costs are higher, the total DOS budget could possibly
increase by as much as 40 percent. For a more detailed discussion
of possible cost scenarios, please refer to IBO's New York
City's Fiscal Outlook, February 14, 1997, pages 46-48.
Uniformed Personnel Overtime
IBO has analyzed the uniformed personnel overtime expenditures
from 1992-1997 of the Police Department (NYPD), Fire Department
(FDNY), Department of Correction (DOC) and the Department of Sanitation
(DOS). The first year that uniformed and civilian overtime amounts
were budgeted separately was 1992. Since then, actual overtime
expenditures have been consistently higher than budgeted amounts.
The amount by which actual expenditures have exceeded budgeted
amounts has ranged from a low of $38.8 million, or 20.9 percent,
in 1992 to a high of $177.5 million, or 97.1 percent, in 1994.
The executive budget allocates about $286 million for uniformed
overtime in 1998.
Figure 4-9 illustrates total uniformed personnel overtime allocations
compared to total expenditures from 1992 to 1998. IBO's reestimate
of overtime is based on an analysis of actual expenditures and
recent experience.
Figure 4-9.
Uniformed Personnel Overtime
Adopted vs. Actual, 1992-1998
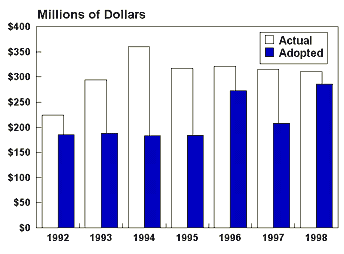
SOURCES: Independent Budget Office; NYC Comprehensive Annual Financial Report of the Comptroller, FY 1992-1996.
NOTES: Uniformed personnel includes NYPD, FDNY, DOS, and DOC. 1997 actual is an estimate based on Financial Information Systems Agency data. 1998 adopted number is from the executive budget. 1998 actual is IBO's estimate of overtime expenditures.
For 1997, a total of $208.3 million was included for uniformed
personnel overtime at budget adoption. In our analysis of the
1998 preliminary budget, we estimated that uniformed personnel
overtime would be $315 million in 1997. In the executive budget,
the Administration has revised its forecast of uniformed personnel
overtime and now expects such expenditures to be about $310 million.
Based on historical spending trends and the current difficulties
in reducing overtime, IBO estimates that overtime expenditures
will exceed the level proposed in the executive budget by about
$25 million.
Judgments and Claims
Spending for judgments and claims reflects the City's costs for
personal injury and property damage tort claims as well as certain
contract liabilities. The City is self-insured, meaning that
claims are paid from available resources. It accounts for these
costs on a settlement basis-essentially "pay-as-you-go."
The executive budget estimates expenditures of $304.6 million
in 1997 and requests $325.1 million in 1998, $348.5 million in
1999, $372.7 million in 2000, and $405.0 million in 2001.
Spending associated with tort claims stems from the number of
incidents resulting in settlements against the City and the award
attributed to them. As can be seen in Figure 4-10, expenditures
for judgments and claims increased from $161.7 million in 1988
to $298.7 million in 1996, an increase of $137.0 million, or 84.7
percent. During this time period, settlements and judgments with
a value of $1 million or greater have had a significant impact
on this increase. Although they account for a small proportion
of the total number of personal injury settlements, they account
for a large share of the cost.
Figure 4-10.
Judgments and Claims
Adopted vs. Actual, 1988-1998
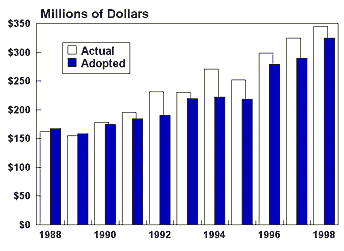
SOURCES: Independent Budget Office; NYC Comprehensive Annual Financial Report of the Comptroller, FY 1988-1996.
NOTES: 1997 actual is an estimate based on Financial Information Systems Agency data. 1998 adopted number is from the executive budget. 1998 actual is IBO's estimate of expenditures.
Our analysis indicates that although the average cost for personal
injury and property damage settlements for the first ten months
of 1997 has declined as compared to the same period in 1996 and
1995, the volume of claims settled has increased significantly.
For the first ten months of the current year, 7,730 personal
injury and property damage claims have been settled. This compares
to a total of 7,028 claims settled in the first ten months of
1996 and 4,986 claims settled in 1995. Even more significant
is the fact that, although the settlement volume as well as the
number of claims disposed of without any monetary liability have
increased, there are over 80,000 cases outstanding. While only
a portion of these cases will eventually result in monetary judgments
against the City, they nonetheless represent a significant potential
liability to the City.
In order to identify areas of improvement in managing these issues,
the City has engaged the consulting firm of Price Waterhouse to
conduct a comprehensive examination of the policies, methods,
and procedures for processing and litigating claims. The study
is expected to be completed by August 1997 and will identify areas
for improving the current litigation process and reducing the
budgetary impact of tort claims on the City. Pending our review
of the report and the implementation of its recommendations, IBO
estimates that actual expenditures will exceed budgeted amounts
by approximately $20 million annually.
Labor
Transitional Labor Savings. At the adoption
of the 1996 budget, the City, working in partnership with labor,
anticipated budgetary relief through transitional productivity
efficiency and labor savings. This budgetary relief consisted
mainly of health benefits savings, pension savings, rescheduled
welfare fund contributions and an early retirement program. At
that time it was estimated that $600 million would be saved in
1996, $400 million in 1997, and $200 million in 1998.
Most of the components of these initiatives have been put in place
and will be successfully implemented. However, IBO estimates
that $35 million in 1997 savings, anticipated from the participation
of the uniformed employee unions, may not be realized because
of the uncertainty of current contract negotiations. For example,
the Patrolmen's Benevolent Association and the City have agreed
to binding arbitration to settle their contract impasse. This
process could take several months and the value of the transitional
labor savings associated with the eventual contract settlement
cannot be determined. A failure of the City to reach agreement
with the uniformed employee unions on a part or all of the anticipated
savings could reduce the amount of the current year surplus the
Administration plans to use to prepay 1998 expenses.
Labor Reserve. The labor reserve provides
funds for costs associated with collective bargaining agreements
for City employees and employees of covered organizations, as
well as for costs associated with bargaining agreements negotiated
by organizations whose employees provide services to the City
on a contractual basis. The executive budget provides for the
transfer of $256 million from the labor reserve to the budgets
of various agencies and covered organizations to pay the cost
of collective bargaining agreements between the City and municipal
unions in 1998.
The City's financial plan has also been adjusted so that the annualized
cost of pay increases received by City employees in 1997 and 1998
are included in the 1999, 2000 and 2001 financial plan of the
agencies, as opposed to being carried in the labor reserve. The
cost of any increases effective after 1998 as well as the annualized
value of those increases are carried in the financial plan of
the labor reserve.
The Administration, however, has not used this method of funding
for the collective bargaining adjustments of covered organizations
(Health and Hospitals Corporation, Off Track Betting Corporation,
Transit Authority, Housing Authority, Fashion Institute of Technology
and the Community Colleges). The executive budget provides funding
for collective bargaining increases effective in 1997 and 1998
for the covered organizations as well as the annualized value
of these increases in 1999-2001. However, increases effective
in 1999 and subsequent years are not funded in the labor reserve,
as is the case for City agencies, or in the financial plan of
the covered organizations. As a result, covered organizations
would be required to self-fund collective bargaining increases
that have traditionally been provided by the City. Based on our
review of the proposal, IBO assumes that the City will ultimately
be responsible for paying the bargaining increases resulting in
additional costs to the City of $104 million in 1999, $224.5 million
in 2000, and $230.7 in 2001.
Public Transportation Fare Changes
Public transportation in the City will undergo a number of significant
changes based on recent announcements of the Metropolitan Transportation
Authority (MTA) and the Administration.
MTA Proposals. The MTA plans to eliminate
two-fare zones for bus and subway riders, beginning in July.
Under this plan, riders who take both a bus and a subway to reach
their destination will be provided a free transfer. According
to the MTA, elimination of the bus to subway transfer is estimated
to result in lost income of about $160 million per year. While
it will not have a direct impact on the City's budget, this amount
represents almost 10 percent of New York City Transit's (NYCT)
total income from passenger fares. In addition, NYCT will also
face increased operating costs to run additional service for the
increased demand that is anticipated.
In January, the MTA plans to offer eleven rides for the price
of ten to MetroCard users, thereby lowering the customer's per-ride
cost from $1.50 to $1.36. The MTA has also indicated that it
is working on plans to tie MetroCard with the commuter railroads
and New Jersey Transit commuters who transfer to the subways.
Administration Proposals. The Mayor has
proposed two major transportation initiatives. First, the preliminary
budget included a proposal that would duplicate the MTA's free
transfer program for private bus users. This would result in
a $27 million revenue loss for the City. Second, the Mayor recently
announced his intention to eliminate the 50 cent fare on the Staten
Island Ferry beginning in July of this year to coincide with the
elimination of two-fare zones for bus and subway riders.
The proposal to eliminate the Staten Island Ferry fare comes on
the heels of decades of efforts to raise the fare. Staten Island
Ferry riders paid 5 cents from 1905 to 1972. In 1972, the fare
was increased to 10 cents and remained at that level until 1975.
The fare was then increased to 25 cents, where it remained for
the next fifteen years. During the period of the late 1970s through
the 1980s there were various proposals to further increase the
fare as a revenue producing measure during economic downturns
and periods of fiscal stress. Finally, the fare was increased
to the current amount of 50 cents in August of 1990. Subsequent
proposals to further increase the fare were unsuccessful.
At present, the ferry has a total annual operating cost of $25
million. The fare brings in about $5 million in revenue to offset
a portion of operating expenses. The remaining costs are paid
with general City revenues. The Administration has stated that
elimination of the fare will cost the City no more than $1 million
per year. The $4 million difference is based on the assumption
that revenue would have been lost anyway with the introduction
of a free transfer to the ferry. However, it is not clear that
the City budget reflects an adjustment for this $4 million revenue
loss. The elimination of the Staten Island Ferry fare means that
the City will now fully subsidize the entire cost of operating
the ferry and will suffer a $5 million annual revenue loss.
There are reasonable grounds to question and support both the
MTA's and the Administration's proposed changes in the price of
the City's public transportation services. On the one hand, while
it may seem unfair for people to pay two or three fares, the market
adjusts for the effects of multiple fare zones, location, and
other factors in prices for homes and other goods that benefit
residents. Such a change in fare structure also represents a
somewhat arbitrary transfer of wealth to a particular subset of
people that includes both the wealthy and the poor. On the other
hand, to the extent that the changes in fare structure make driving
less appealing, they may result in increased use of public transportation.
The reduction in the traffic congestion and air pollution caused
by driving would reduce the external costs associated with the
present commuting options faced by residents.
Campaign Finance
The Mayor's executive budget requests a total of $52.2 million
in 1998 for the primary and general election needs of the Board
of Elections (BOE) and Campaign Finance Board (CFB). This represents
an increase of $18 million, or 51.4 percent, from the combined
1997 forecast for both agencies. The majority of the City's costs
for the 1997 election will be funded in the 1998 budget via appropriations
to the BOE, which manages the City's elections process, and the
CFB, which implements the City's campaign financing law.26 The
last citywide election, which occurred in fiscal year 1994, was
funded mainly through the 1994 budget. As can be seen in Figure
4-11, the 1998 request of $52.2 million represents an increase
of $6.9 million, or 15 percent over actual 1994 expenditures of
$45.3 million.
Figure 4-11.
City Spending for the 1993 and 1997 Elections
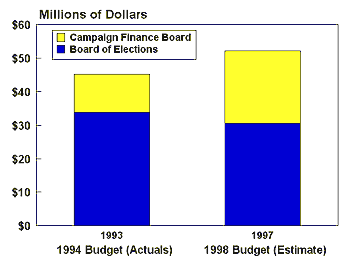
SOURCE: Independent Budget Office.
Board of Elections. The Administration requests
$30.5 million for the BOE in 1998. These funds would be spent
on meeting BOE's State and federal legal mandates such as examining
candidate petitions, registering voters, and keeping current voter
registration lists, in addition to costs more closely associated
with election day such as transporting voting machines to polling
sites. The requested appropriation represents a decrease of $3.3
million or 10 percent from 1994 spending levels. The projected
decrease in spending is largely the result of lower costs resulting
from increased computerization which has improved efficiency of
BOE operations.
Campaign Finance Board. The Administration requests
$21.7 million for the CFB to oversee the City's campaign financing
law and provide matching public funds to candidates. This amount
represents an increase of $10.2 million, or 88 percent, over CFB
spending in 1994. Of the total requested, $15 million would go
directly to candidates for citywide office (Mayor, Comptroller,
Public Advocate), Borough President, and City Council, who participate
in the City's matching public funds campaign financing program.
The remaining $6.7 would go to administration and other agency
expenses.
According to the CFB, the budget request is driven by the expectation
that there will be an overall increase in the competitiveness
for various offices, resulting in higher campaign spending. As
of April 30, 1997, the final filing date for participating in
the program, 186 candidates have requested to participate in the
City's public campaign financing program. The number of participants
who have filed for public funding is about the same as in the
1993 election. The first disbursement of public funds are scheduled
to go to candidates on July 15, 1997.
New York City's Year 2000 Challenge
The "year 2000 problem," also known as the "millennium
bug," refers to the inability of older computers, or legacy
systems, to properly interpret dates after 1999. Due to the high
costs associated with slow processing speeds and limited memory
of first-generation mainframe computers, early software generally
stored dates as six-digit fields (mm/dd/yy), rather than eight-digit
fields (mm/dd/ccyy).
While this format has served us well since the 1960s, it poses
considerable problems for date-related functions after 1999.
Because the year 2000 is treated as "00" in a six-digit
field, non-compliant computer systems will interpret 2000 as being
less than 1997, 1998, and so forth. Computations involving the
years 1997 to 2000, for example, may produce results based on
a period of 98 years as opposed to the actual four years.
Since many of the City's functions depend on complex information
technology (IT) systems, some of which may not be 2000 compliant,
critical public services could be compromised. Some of the services
that may be affected include Emergency Medical Service dispatch,
birth certificate processing, and traffic management. The possibility
of large-scale data corruption or system failure makes it imperative
for the City to address the year 2000 challenge as expertly and
expediently as possible.
IBO projects that the total cost of the City's efforts to correct
the date recognition problem could range as high as $150 million
to $200 million dollars over the next three years. Assuming that
these costs would be spread evenly within this period, the plan
would require the City to budget an average of $50 million to
$67 million in each of the fiscal years from 1998 to 2000.
Cost Estimates of the City's Year 2000 Plan.
There are two basic factors that determine the total cost
of the City's year 2000 plan: size (number of lines of
code) and per unit rate (cost to repair each line of code).
Figure 4-12.
Initial Total Cost Estimates of the Year 2000 Plan
(In millions
of Dollars)
| Number of Lines of Code |
Average Cost per Line of Code |
| |
$0.42 |
$0.64 |
$1.10 |
$1.50 |
$2.00 |
| 75 million |
31.5 |
112.5 |
150.0 |
48.0 |
82.5 |
| 100 million |
42.0 |
110.0 |
150.0 |
200.0 |
64.0 |
| 125 million |
52.5 |
137.5 |
187.5 |
250.0 |
80.0 |
| SOURCE: Independent Budget Office. |
Lines of Code. An initial cost estimate of the City's
year 2000 problem is $110 million, based on 100 million lines
of code (LOC) and a per unit price of $1.10.27 IBO's research
indicates that estimates of LOC can be greatly overstated. For
example, the State of Minnesota found that the initial estimate
of LOC in its systems was overstated by more than 50 percent.
If the above estimate were off by this degree, the cost of the
City's year 2000 plan would be $55 million, at the per unit price
of $1.10.
Conversely, if the actual number of lines of code were greater
than the above estimate, the final project cost would also increase
substantially. If the actual number of LOCs in the City's systems
were 125 million, for example, the total costs associated with
the City's year 2000 plan would be $137 million, assuming the
per unit price is accurate.
The Administration's audit of the City's computer systems is presently
underway and should be completed this June. While our research
indicates that the current estimate of 100 million lines of code
is not unreasonable;28 at present, the major factor we believe would
increase the current cost estimate is that the per unit rate of
$1.10 appears to be understated.
Per Unit Price. Our research found per line costs that
were both lower and higher than the $1.10/LOC estimate. At the
low end, New York City Transit reported a cost of $0.42/LOC in
its year 2000 compliance initiative. Transit's low cost is partly
due to earlier modifications to its central control system, and
the fact that a substantial portion of the code conversion and
testing process was done in-house. Similarly, the State of Minnesota
reported a cost of $0.64/LOC. At the higher end, the Gartner
Group, an IT advisory firm, recently reported labor costs of $1.50/LOC.29
Some quotes were as high as $5-$8/LOC, although they did not
appear to be representative.
Other Factors. There are a number of other factors that
could increase the cost of New York City's year 2000 plan, but
cannot be priced out at this time. First, the sheer vastness
of the City's computer system makes it more difficult to fix than
the other systems in our survey. Second, complex IT systems,
such as New York City's, require massive amounts of data to be
shared between city, state and federal agencies. Over time, this
situation has created huge stores of code linkages (which allow
programs to interface with one another), that must also be amended
and tested for compatibility.
Third, the City operates a preponderance of legacy systems, many
of which have not been upgraded nor even adequately maintained
since their inception. Fourth, competition for increasingly scarce
programming resources in the private sector and the possible loss
of personnel from the City's technology-literate workforce will
increase year 2000-related labor costs, which are up 30 percent
in the last year alone. Finally, the City must also be prepared
to purchase more powerful hardware and non-computer durables that
would be capable of processing the more advanced code.
Conversely, there are mitigating factors that might decrease the
cost of the year 2000 plan. These factors include the degree
to which the City's systems do not need repair.30 For example,
a number of applications in use at City agencies are already 2000-compliant.
A second factor would be the effort to reduce the number of data
centers operated by the City. The recent consolidation of a number
of IT systems into the Department of Information Technology and
Telecommunications (DoITT) may lower costs by centralizing the
efforts needed to achieve year 2000 compliance. Lastly, the use
of in-house resources as opposed to procuring such services in
the private sector can also reduce the final project cost. For
example, New York City Transit found that the cost of using internal
staff was 50 percent less than that of private contractors for
the same job.
IBO expects that the per unit price will more likely fall between
$1.50/LOC and $2.00/LOC. The lower end cost quotes noted above
are unlikely to be realized by the City as a result of various
factors such as the age, size, and complexity of its current systems.
The two higher end figures are more current and more accurately
reflect the effects of supply and demand for the service as the
deadline approaches. While quotes in the $5 to $8 range per line
of code were found not to be representative of the going rate,
rates of this magnitude suggest that the average price per LOC
could be higher than anticipated.
Based on the above information and using the estimate of 100 million
LOC, IBO projects that the cost of the City's year 2000 plan is
likely to be between $150 million and $200 million over the next
three years, averaging $50 million to $67 million in each fiscal
year from 1998 to 2000.
Appendix
A
Gap Sheet Details
IBO's Budgetary Estimates
(In millions of dollars)                  1997       1998       1999      2000       2001

Revenue
Taxes
     Property                           7,210      7,208       7,381     7,624      7,866
     Personal Income                    4,333      4,481       4,721     5,004      5,281
     General Sales                      2,923      3,049       3,170     3,282      3,392
     Business Income                    2,419      2,118       2,208     2,381      2,505
     Real-estate Related                  775        815         859       907        958
     Other Taxes (with Audits)          1,531      1,558       1,573     1,587      1,603
     Tax Reduction Program                  -      (240)       (407)     (434)      (448)
     Proportionate State Tax                -       (47)       (254)     (472)      (722)
     Relief
                       Total Taxes     19,191     18,942      19,251    19,879     20,435

Miscellaneous Revenues
     (Net of Intra-City Revenue)        2,997      2,960       2,417     2,384      2,378

Other Revenue
     Unrestricted Intergovernmental
       Aid Proportionate State Tax
       Relief                               -         47         254       472        722
       All Other Unrestricted Aid         641        741         599       599        599
     Other Categorical Grants             386        292         292       293        294
     Inter-Fund Revenues                  244        265         265       262        262
     Disallowances                       (15)       (15)        (15)      (15)       (15)

               Total Other Revenue      1,256      1,330       1,395     1,611      1,862

Total City Revenues                    23,444     23,232      23,063    23,874     24,675

State and Federal Categorical
Grants                                 10,661     10,830      10,900    11,047     11,339

TOTAL REVENUE                          34,105     34,062      33,963    34,921     36,014

Expenditures

City Funded (Net of Intra-City         23,471     23,323      25,171    26,784     27,573
Sales)
State and Federal Categorical          10,661     10,830      10,900    11,047     11,339
Grants

TOTAL EXPENDITURES                     34,132     34,153      36,071    37,831     38,912

SURPLUS/(GAP)                            (27)       (91)     (2,108)   (2,910)    (2,898)
SOURCE: Independent Budget Office.
NOTE: IBO's budgetary estimates are based on adoption of the
policies and programs proposed in the Mayor's 1998 executive budget. All amounts are before out-year gap closing initiatives.
IBO's Reestimate of the 1997 - 2001 Financial Plan
(In millions of dollars)                  1997       1998       1999      2000       2001

Gap as Estimated By Mayor                   -          -     (1,990)   (2,881)    (2,704)

IBO Reestimates
Revenues
   Taxes
        Property                         (10)         15          70        63         11
        Personal Income                    17        148         141       144        157
        General Sales                       5         30          37       (1)       (27)
        Business Income                    39         67          80       153        189
        Real-estate Related                 1          6           3         3         16
        Tax Reduction Program               -        (3)        (10)      (11)       (13)
   Miscellaneous Revenues
     Airport Rent                           -      (270)       (215)         -          -
     Collections Initiative                 -       (20)        (20)      (20)       (20)

                    Total Revenues         52       (27)          86       331        313

Expenditures:
     Public Assistance                      -         12        (22)      (30)       (32)
     Medical Assistance                   (4)       (31)        (33)      (48)       (61)
     Education                              -          -           -      (13)      (138)
     Overtime                             (5)       (25)        (25)      (25)       (25)
     Judgments and Claims                (35)       (20)        (20)      (20)       (20)
     Transitional Labor Savings          (35)          -           -         -          -
     Labor Reserve                          -          -       (104)     (224)      (231)

                Total Expenditures       (79)       (64)       (204)     (360)      (507)

Total Reestimates                        (27)       (91)       (118)      (29)      (194)

Gaps Under the Mayor's Executive
     Budget as Estimated by IBO          (27)       (91)     (2,108)   (2,910)    (2,898)
SOURCE: Independent Budget Office.
NOTE: All amounts are before out-year gap closing initiatives.
Appendix
B
The following Independent Budget Office staff prepared the revenue
and expenditure projections in this report:
Economic Analysis Division
Michael Jacobs            Business and Personal Income Taxes

George Sweeting           Property Taxes

Luan Lubuele              Econometric Modeling and Education

David Belkin              Sales Taxes
Budget Analysis Department
Terri Matthews            Debt Service

Tim Mulligan              State and Federal Categorical Aid

Frank Posillico           Budget Projections
Health and Human Services
Paul Lopatto              Medicaid and Public Assistance

Deborah Ahrens            Health and Social Services

Jonathan Cortell          Health and Social Services

Ritta McLaughlin          Social Services

Sofía Quintero            Medicaid
Housing, Education and Infrastructure
Patrick Killackey         Board of Education

Eric Dixon                Housing and Buildings

Nancy Penska              Board of Education and City University

Martha Prinz              Transportation Services

Joyce Sun                 Libraries, Parks, and Culturals
Uniformed Services
Richard Greene            Overtime, Judgments and Claims, and Labor Reserve

Ian Brown                 Sanitation

Paul Greaves              Public Safety and Judicial

Jenell Horton             Environmental Protection, Judicial, and Elections

Bernard O'Brien           Public Safety and Judicial
Other
Beth Moodie               General Support

Indera Segobind           General Support

Deanice Jenkins           General Support
FOOTNOTES:
| 1 |
All economic data are reported on the basis of calendar years, while all revenue data are on a fiscal year basis. |
| 2 |
The Blue Chip consensus forecast is based on a survey of 40 to 50 private-sector economists. |
| 3 |
Because New York City has a mature economy with a relatively stable population, long-run City employment growth is generally lower than employment growth nationwide. |
| 4 |
Seasonally adjusted payroll employment. Source: Federal Reserve Bank of New York. |
| 5 |
Unless otherwise noted, the revenue forecasts for specific taxes do not include audit payments. Audit payments for all taxes are projected by OMB as a separate tax revenue item. |
| 6 |
The estimated cost of the lower Manhattan program’s tax abatement has increased since the preliminary budget was released in January. The 1998 cost is $1 million higher; for 2001 it is $15 million higher. Given that the increase is included in the baseline, one might conclude that the higher cost is attributable to revised estimates as to the number of properties participating in the program. In reality, the increased cost assumes that new legislation extending and expanding the program’s benefits will be enacted. Rather than identify these changes as part of the tax reduction program, the executive budget obscures the fact that any changes are contemplated by simply including the higher costs as part of the baseline budget with no explanation for why they differ from the preliminary budget. |
| 7 |
Technically, the budget also distorts the baseline in its treatment of this program. The coop and condo abatement was enacted as a three-year interim program beginning in 1997, pending development of a longer-term solution leading to full equalization of tax burdens for all owner-occupied housing. Although the abatement expires in 1999, the cost remains in the baseline for 2000 and 2001. |
| 8 |
County and industry data on taxable sales and purchases is reported biannually by the New York State Department of Taxation and Finance, Office of Tax Policy Analysis. |
| 9 |
PEGs refer to new initiatives undertaken as part of the Program to Eliminate the Gap. In most areas of the budget they represent expenditure reductions. However, in the revenue budget they usually represent new tax enforcement projects. |
| 10 |
Product sale data for New York City were provided by the Retail Division of the Bureau of the Census, U.S. Department of Commerce. The estimate of the under-$500 share of apparel sales comes from the New York City Department of Finance. |
| 11 |
At present the exemption is measured after applying a 25 percent discount factor so that the exemption level is usually expressed as $40,000. Under the new proposal, the exemption would be computed before applying the discount factor. |
| 12 |
Rent subject to tax is discounted by 25 percent under current law. The proposal would increase the discount to 35 percent. The tax is then computed as six percent of the discounted rent. Because of the discounting, the effective tax rate would decline from the current 4.5 percent to 3.9 percent under the proposal. |
| 13 |
The CRT liability year covers June 1st to the following May 31st. September 1, 1998 marks the start of the second quarter of the 1998/99 CRT liability year. |
| 14 |
IBO, School Tax Relief and Education Aid Proposals: Impacts on New York City, April 1997. |
| 15 |
IBO, Analysis of the Mayor’s Budgetary Proposals. |
| 16 |
Both the Mayor’s and IBO’s projections assume that the present HR and AFDC (TANF) programs will emerge essentially intact or that these populations will merely be redistributed into three or five categories with no impact on the overall census or cost. They also assume that grant levels will not be reduced, and the new federal welfare law will not be substantially revised by Congress. The recent federal budget agreement casts some doubt on the latter assumption. |
| 17 |
Projected expenditures for HR and, to a lesser extent, AFDC drop substantially in 2000 and 2001 due to the inclusion of a PEG based on the City’s new naturalization initiative known as “Citizenship NYC” which would assist legal immigrants in becoming American citizens. The PEG assumes that by 2000, 75 percent of legal aliens who would lose federal SSI benefits due to their citizenship status will regain these benefits by attaining citizenship and thus leave the HR or AFDC rolls. The effects of this PEG are included in the Mayor’s expenditure projections but not in the caseload projections. |
| 18 |
To date, seven of the affiliation agreements have been revised. The Corporation has renegotiated contracts with the following affiliates: New York Medical College, Saint Barnabas Hospital, Woodhull Medical Group, Montefiore Medical Center, Columbia University College of Physicians and Surgeons, Mount Sinai School of Medicine, and the New York University Medical Center. |
| 19 |
Barondess Commission. Review of the City’s Hospital System. New York: 1993, p. 43. |
| 20 |
Report of the City Hospital Visiting Committee. The State of New York City’s Municipal Hospital System FY 1996. New York: United Hospital Fund, 1996, p. 10. |
| 21 |
It has been reported that despite representing 20 percent of the health care system in New York, HHC accounts for over 39 percent of Medicaid inpatient days and nearly 35 percent of all uninsured or self-pay days. Charles Brecher. Privatization and the Public Hospitals. New York: Twentieth Century Fund, 1996. |
| 22 |
Informal day care is unregulated home-based care provided by a relative or acquaintance. Providers enroll with ACD or OES to receive payment but are not licensed, monitored, or required to meet the health and safety standards required of ACD family and group day care providers. |
| 23 |
“Chancellor’s 1997-98 Budget Request,” p. 15. |
| 24 |
The preliminary budget describes the investment as $500 million for over 64,500 seats from 1997 to 1999. However, 5,000 seats will be drawn not from capital investments but from implementing year-round education at schools that have air-conditioning to support it. The actual cost of the seats is estimated to be $717 million. The City arrives at $500 million by subtracting $387 million in costs covered by funds shifted forward from 2000, adding $161 million in costs for investments in new computers and lead abatement, and rounding. |
| 25 |
It should be noted that, in the case of the City, these appropriations would probably be directed to the City’s coffers, not BOE’s, since the City has covered BOE for its anticipated reimbursements of prior-year expenditures. |
| 26 |
The Board of Education and the Police Department provide critical support on election day. The Board of Education opens public schools across the City from 6am to 9pm and cleans the facilites after the polls close. The Police Department assigns one police officer to each polling site to observe during voting hours and to transport the election results, in addition to providing guard duty for the counting of the paper ballots. The Department’s computers generate poll information seen on television. |
| 27 |
Eristoff, Andrew S., “Preparing the City’s Computers for the Year 2000: Summary of Oversight Findings and Recommendations,” Task Force on Technology in Government, December, 1996, pg. 9. |
| 28 |
The 100 million LOC size estimate covers only IT systems that belong to mayoral agencies; it does not include year 2000-related needs of covered agencies, such as Board of Education, Health and Hospital Corporation, Transit Authority, and City University of New York. A full analysis of the City’s year 2000 plan should also include the cost of repairing the date recognition problem within the systems of the covered agencies. |
| 29 |
Caldwell, Bruce and Bob Violino, “Year 2000 Costs Climb,” Information Week, April 7, 1997. |
| 30 |
The City’s year 2000 plan will also not include the cost of the IFMS 2000 plan, which is a separate technology initiative to upgrade the City’s financial accounting system. The 1998 capital budget proposes an additional $185 million for this purpose. |