January 1998
IBO's Forecast of City Revenues and Expenditures
for
Fiscal Years 1998 through 2001
New York City Independent Budget Office
Preface
January 1998
January 1998
IBO's Forecast of City Revenues and Expenditures
for
Fiscal Years 1998 through 2001
New York City Independent Budget Office
Preface
January 1998
Let's face it. A government report discussing economic forecasts, tax collections, and spending projections is probably not something that most New Yorkers would stay up at night reading. And even if someone were so inclined, that person would probably have to be an economist or budget analyst to really understand everything contained in such a report. Until now. We have written this report in easy-to-understand, non-technical language to provide both interested citizens and government officials a better understanding of the city's budget outlook.The New York City Charter directs the Independent Budget Office (IBO) to publish a report by February of each year giving our view of how much the city is going to collect in taxes and other revenues and how much it's going to spend. We have issued New York City's Fiscal Outlook well in advance of the deadline so that readers have this information before the 1999 budget adoption process gets underway. We are not trying to predict future policy and budget decisions to be made by the Mayor and the City Council, nor are we recommending any particular course of action. Instead, we are providing a forecast of what the city's finances would look like if existing spending policies and tax laws are allowed to run their course over the next few years. Such a forecast provides an objective starting point and serves as a benchmark for consideration of the Mayor's soon-to-be-released 1999 budget.
The report begins with an overview, followed by our national and local economic outlook, a forecast of city revenues, and concludes with a discussion of our spending projections. We're going to follow this report up in March with an analysis of the Mayor's preliminary budget. Stay tuned.
So if you've gotten this far, turn up that night light and keep going-this report takes a typical reader only about an hour to read.
Chapter 1
New York City's budget outlook continues to improve but serious long-term fiscal challenges remain.
| Key Findings:
The city's budget outlook continues to improve
Long-run revenue growth will be insufficient to sustain current spending policies.
|
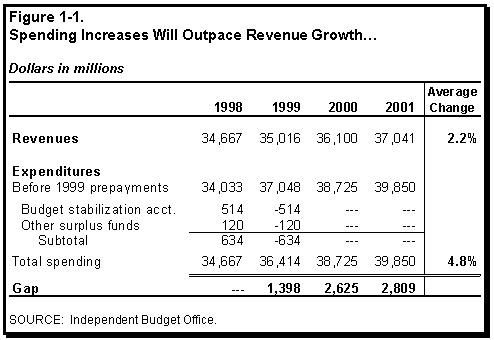
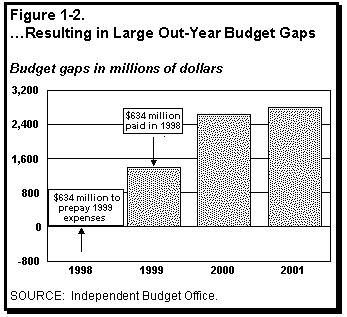
The city is in particularly good shape for the current fiscal year. In addition to $514 million reserved in a budget stabilization account, we forecast the city will end 1998 with a surplus of $120 million. Because the city is forbidden by state law to carry excess funds over from one year to the next, we have assumed that all of these funds will be used to prepay expenses that would otherwise be incurred next year-thereby lowering 1999 spending needs by $634 million. The city also maintains a general reserve fund of $200 million to cover any unanticipated current year expenses. All reserve funds not spent for 1998 expenses will also be used to prepay 1999 expenses.Assuming continuation of current spending policies and tax laws, the city will face a deficit of $1.4 billion in 1999-roughly $1.1 billion less than we forecast a year ago. As shown in Figure 1-1, spending needs will grow more than twice as fast as projected revenues from 1998 to 2001 leading to sizable-though smaller than previously forecast-gaps for 2000 and 2001. These gaps are illustrated in Figure 1-2.
Economic and Revenue ForecastsCity tax receipts fundamentally depend on the strength of the U.S. and city economies. As the national economic expansion heads into its eighth straight year, we expect U.S. economic growth to slow (see Chapter 2). Real gross domestic product will rise 2.5 percent over the coming calendar year, a rate of growth just equal to the most recent consensus forecast but well below the 3.7 percent growth rate the nation enjoyed in 1997. Slower U.S. growth will reduce wage and price pressures, keeping inflation in check.
We project that slower national growth, coupled with a more moderate year on Wall Street, will cause personal income and employment growth in New York City to gradually decelerate in 1998 and the first half of 1999. Local economic growth is expected to pick up in late 1999 and strengthen over the remainder of the forecast period.
Revenue Forecast. IBO's revenue forecast is discussed in Chapter 3. We project that total city revenues-the sum of taxes and non-tax receipts such as state and federal grants-will rise at an average annual rate of 2.2 percent over the 1998 to 2001 fiscal year period. This generally sluggish revenue growth is attributable to a mix of factors, including a gradual deceleration in economic growth through the first half of calendar year 1999, the impact of recently enacted tax cuts, and constraints on increases in the real property tax.
Highlights of our tax revenue forecast include the following:
- Strong economic growth, coupled with record Wall Street earnings, are boosting tax collections during the current fiscal year. Even after accounting for over $300 million in recent tax cuts, tax revenues will increase 2.2 percent in 1998; without the cuts, tax revenues would rise 3.6 percent.
- In 1999, weaker economic growth and a new round of property-related and business tax cuts will slow the increase in collections to 1.5 percent.
- Despite a rebounding local economy in 2000 and 2001, state tax relief and sales tax reductions will hold tax revenue growth to an average annual rate of 2.1 percent. (While the state's tax relief program will reduce the city's personal income and real property tax collections, total city revenues will not be affected because the state will reimburse the city for the loss.)
Expenditure ForecastChapter 4 displays IBO's spending estimates assuming continuation of existing policies. We project overall spending will increase an average of 4.8 percent each year from 1998 through 2001. We have calculated future costs for most programs and agencies by adjusting current spending levels for both inflation and any pay raises scheduled for city workers. For programs with costs driven principally by factors beyond the immediate control of the city-such as public assistance and Medicaid (caseloads) and education (enrollment)-we have developed our own models to predict future costs.
Highlights of our spending projections include the following:
- Falling caseloads will cause public assistance costs to decrease over the next year, although the number of welfare recipients-and resulting costs-will stabilize from 1999 through 2001. Beyond 2001, we expect city and state costs to rise as some recipients reach the five-year limit for federal assistance and begin to transfer to non-federally funded programs.
- After double-digit growth rates of the late 1980s and early 1990s, Medicaid spending will grow at an average annual rate of 2.7 percent.
- Board of Education spending will grow significantly due to surging enrollment at city schools, rising labor costs, and spending associated with increases in categorical aid from the state and federal governments.
- Debt service costs will rise significantly due to high levels of capital spending over the past ten years (after a period of post-fiscal crisis capital retrenchment), and the former practice of refinancing outstanding bonds that had the effect of increasing out-year costs.
Chapter 2
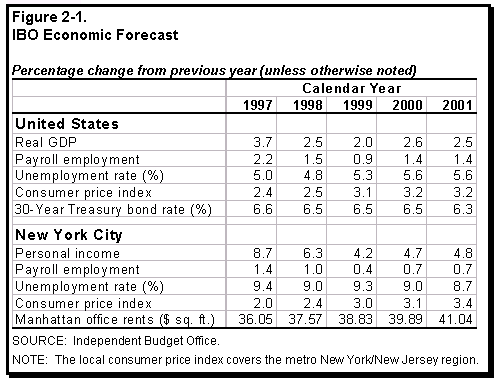
National and local economic trends affect both revenues and expenditures, and thus play a major role in determining the city's fiscal condition. IBO expects U.S. economic growth to moderate over the next few years, which will in turn slow growth in the city's economy. Figure 2-1 summarizes IBO's economic forecast.1
Recent DevelopmentsNearly one year ago, we published our first economic forecast. Since then, both national and local economic growth have been significantly stronger than we and most other analysts expected.
U.S. economic growth surged in 1997. IBO projects that real gross domestic product (GDP) grew at a rate of 3.7 percent for the year, the fastest rate since 1988. Despite such rapid growth, the rate of inflation as measured by the consumer price index (CPI) actually fell, from 2.9 percent in 1996 to 2.4 percent in 1997.
It was also a very good year for the New York City economy. Personal income, fueled by securities industry earnings, rose 8.7 percent in 1997. Employment also grew robustly, not just in the financial sector but in a broad range of city industries. We estimate that, on a year-over-year basis, total city employment increased by 46,600 jobs in 1997, the strongest employment gains in a decade.
The National Outlook
U.S. economic growth will gradually decelerate over the coming year. We estimate that real GDP will increase 2.5 percent in 1998, a growth rate equal to December's Blue Chip consensus forecast. This slower economic growth is primarily attributable to the continuing currency and financial crisis in Asia, which is expected to slow the domestic economy by constraining U.S. exports and boosting U.S. imports. Growth will remain weak early in 1999 but begin to strengthen during the second half of the year. For the period 1999 through 2001, real GDP is forecast to increase at an average annual rate of 2.4 percent.Slower U.S. economic growth will reduce wage and price pressures, keeping inflation in check without the need for monetary policy tightening. IBO forecasts that the CPI will rise just 2.5 percent in 1998 and will increase an average of 3.2 percent per year from 1999 through 2001.
The City OutlookSlower growth in the U.S. economy, coupled with a more moderate year on Wall Street, will cause economic growth in New York City to decelerate in 1998 and into the first half of 1999. Employment and personal income will grow more slowly than in 1997, while the regional inflation rate will rise but generally remain just below the national rate.
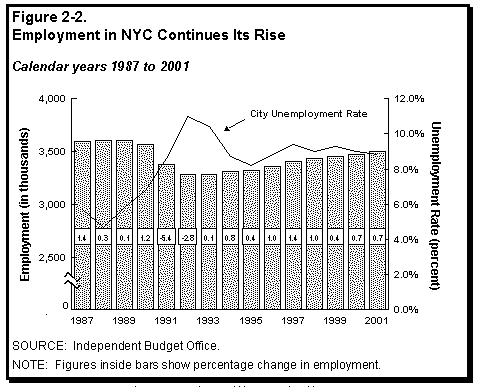
Employment Growth Moderates. Although IBO does not expect the performance of the city's economy in 1998 to match the very strong growth the city enjoyed in 1997, we still expect employment to post solid gains during the new year. As illustrated in Figure 2-2, total employment in the city will increase by 1.0 percent or nearly 34,000 jobs in 1998, roughly equal to the increase in 1996. For the 1999 through 2001 period, total employment will increase more slowly, rising at an average rate of nearly 20,000 jobs a year.
The rate of unemployment in New York City will decline slightly to 9 percent in 1998 and drift generally downward through 2001. The city's unemployment rate, however, will remain well above the national average for the entire forecast period.
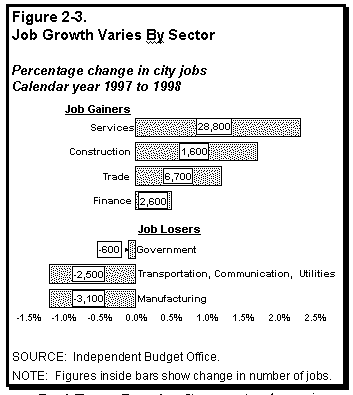
Job Growth Uneven. Employment growth in 1998 will vary widely across industry sectors. As shown in Figure 2-3, the fastest growing sector-both in percentage and absolute terms-is expected to be services. For example, despite restructuring of the hospital industry, health services will add about 10,000 jobs to the city's economy in 1998. Employment in education, social, and business services is also expected to increase strongly. Other sectors projected to boost city employment in 1998 include: trade (particularly retail trade, expected to add 6,500 jobs); finance (adding jobs despite continued restructuring in the banking industry); and construction.
Among sectors with declining 1998 employment, IBO expects the government sector to shed a small number of jobs in New York City, with the downsizing limited to federal employees. Employment increases in the communications industry will only partly offset employment declines in transportation. Finally, the manufacturing sector will lose 3,100 jobs in 1998, a larger decline than in 1997, but well below the losses of the early 1990s.
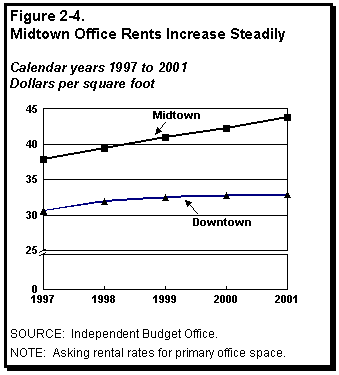
Real Estate Remains Strong. As shown in Figure 2-4, the market for primary office space in Manhattan is expected to remain strong throughout the forecast period. Midtown office vacancy rates will continue to decline, with asking rents rising to $39.46 per square foot in 1998 and reaching $43.74 in 2001. In contrast, although downtown vacancy rates have fallen sharply and will continue to decline, rents are forecast to remain largely unchanged through 2001.Two of the strongest segments of the residential real estate market are high-end Manhattan rentals as well as co-ops and condos. Rents in market-rate buildings have risen sharply in the last 18 months, spurring the construction of new buildings and the conversion of older office buildings for residential purposes. Renters and buyers increasingly priced out of the Manhattan market are expected to gradually push up prices in other parts of the city.
Demographic Trends. New York City's population will increase at the very gradual rate of 0.1 percent annually through 2001, similar to its trend in recent years. Although the city is expected to remain a popular destination for international migrants, out-migration will continue to constrain population growth.
Chapter 3
In this chapter, we forecast revenues from tax collections and other sources including aid from the federal and state governments. These revenues are used to fund the programs and agencies discussed in Chapter 4.Our projections assume existing tax and intergovernmental aid policies continue through 2001. For the many city tax laws with fixed expiration dates, we have assumed extension of any law that has been renewed at least once in the past.
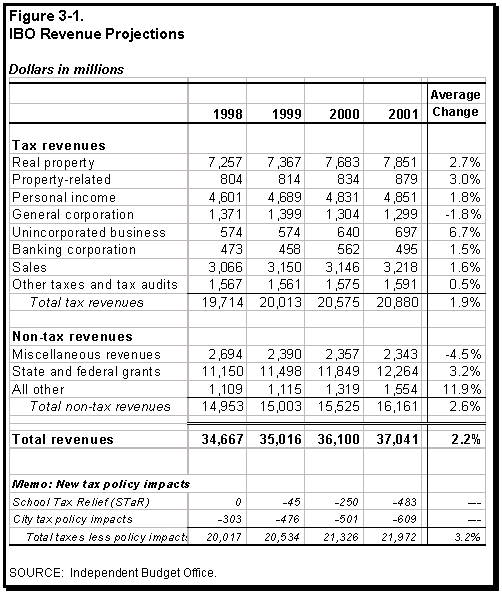
As shown in Figure 3-1, estimated revenues will increase by an average of 2.2 percent annually over the 1998-2001 period.
City Taxes by Source
Property and property-related taxes, personal and business income taxes, and general sales taxes account for over 90 percent of all city tax collections and about half of total revenues. Recent cuts in real property and business taxes, coupled with a cooling off of the local economy, will result in tax revenues growing at a relatively slow pace of 1.5 percent in 1999. State tax relief and sales tax cuts will hold overall tax revenue growth to an average annual rate of 1.9 percent through 2001. As shown at the bottom of Figure 3-1, without these reductions overall tax revenues would grow an average of 3.2 percent from 1998 to 2001.
Real property taxes are the city's single largest revenue source. Collections will be $7.4 billion in 1999, 37 percent of total tax revenues. Beginning in 1999, the state's new School Tax Relief (STaR) exemption will cut homeowner property taxes, but assuming that the co-op and condo tax abatement will expire as scheduled, total property tax revenues will still rise to $7.9 billion in 2001, with growth averaging 2.7 percent annually.
Property-related taxes include revenues from taxes on commercial rents, real property transfers, and mortgages. Collections will total $814 million in 1999, rising to $879 million in 2001. Larger exemptions and rate cuts in the tax on commercial rents will limit growth in these taxes to an average of 3.0 percent; without them, revenues would be $86 million higher in 2001 and average growth would be 4.9 percent.
Personal income taxes are the city's second largest source of tax revenue. They will account for $4.7 billion in 1999, or 23 percent of tax collections. Growth through 2001 will be slowed by income tax credits and rate cuts under STaR, as well as by a slowdown in income growth. With the STaR tax reductions, city personal income tax revenues will rise to $4.9 billion by 2001, an average growth rate of 1.8 percent annually. Without STaR, revenues would have risen to $5.2 billion and average growth would have been 4.2 percent.
Business income taxes include the general corporation tax, the banking corporation tax, and the unincorporated business tax. These three taxes will account for $2.4 billion or 12 percent of total tax revenues in 1999. Due to slower economic growth and cuts in the general corporation and unincorporated business taxes, growth through 2001 will average only 1.0 percent.
Sales taxes apply to sales of goods and selected services. The 4 percent city tax will generate over $3.1 billion in 1999, 16 percent of total tax revenues. Eliminating taxes on the sale of clothing items costing under $100, set to begin in December 1999, will reduce the average annual growth of city sales tax collections to 1.6 percent through 2001; without such cuts, average growth would have been 3.4 percent.
Real Property Tax
The tax owed on real estate in New York City depends on the type of property, its value for tax purposes (as calculated by the city's Department of Finance on the annual assessment roll), and the applicable tax rate.2
Since 1983, the property tax has been based on four tax classes: Class 1, made up of one-, two-, and three-family homes; Class 2, composed of apartment buildings with more than three units, including cooperatives and condominiums; Class 3, made up of the real property of utility companies; and Class 4, composed of all other commercial and industrial property.
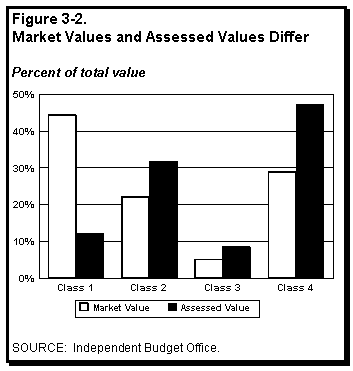
Because assessment rates and, to a lesser extent, tax rates vary from class to class, there are wide differences between each class's share of total market value, assessed value actually subject to tax, and tax burden. As shown in Figure 3-2, Class 1 accounts for 44 percent of market value in the city, but only 12 percent of assessed value. In contrast, the other three classes each account for greater shares of the assessed value than of market value, and therefore bear a disproportionately large share of the property tax burden.
Outlook for Assessments. IBO projects total assessed value on the 1999 roll will grow by 2.5 percent over 1998. Because of limits in the tax code that prevent the city from taking into account all of the appreciation in property values, this assessment growth is slower than the increase in market values and expansion in the overall city economy.3
The fastest growth in 1999 assessments will occur in Class 2 apartment buildings-particularly for high-end Manhattan rentals and, to a lesser extent, newer Manhattan condos.
Despite a projected increase of better than 5 percent in market-rate rents for new leases in prime office buildings, the total valuation for Class 4 is projected to lag the other classes, showing barely 1.3 percent growth for 1999. This seeming discrepancy is explained by a number of factors: because assessment changes in Class 4 are phased in over five years, only a portion of a property's improved economic condition is captured each year; a relatively small number of new leases will be signed at higher rents this year; continued weakness of rents in older office buildings; and slow growth of values in other segments of Class 4, such as industrial properties.Revenue Forecast. While the total value on the assessment roll is the key determinant in predicting revenues, other factors include the cost of tax abatements (which reduce property tax liability without lowering the assessed value of affected parcels), delinquencies, collections from prior years, and refunds.
Several tax policy changes will affect property tax collections through 2001. First, abatements under the co-op/condo tax relief program are scheduled to increase by 70 percent over their 1998 level, reaching $155 million. This tax cut was enacted as a temporary, three-year program and is scheduled to expire after 1999. Our forecast assumes that the abatement will not be extended. Second, abatements under the downtown revitalization program are expected to reach $30 million in 1999-up from $14 million in 1998-and then $44 million and $50 million in 2000 and 2001.
Collections will also be affected by STaR, which reduces property taxes for homeowners statewide. We expect STaR to reduce city property tax receipts by $10 million in 1999, $64 million in 2000, and $122 million in 2001. The state will reimburse the city for these forgone receipts, however, so STaR is not expected to have an impact on total city revenues.
After accounting for these factors, property tax revenues will be $7.4 billion in 1999, an increase of 1.5 percent over 1998. In 2000 and 2001, revenues will grow more rapidly, increasing at an average annual rate of 3.2 percent.
Property-Related Taxes
Commercial Rent Tax. A series of tax policy changes in recent years have significantly altered the incidence of the commercial rent tax and reduced revenues from over $700 million in 1994 to $358 million projected for 1998. The tax is now only assessed on rents paid by commercial tenants in Manhattan below 96th Street. As of June 1997, leases under $100,000 per year are exempt from the tax and liability is phased in for leases between $100,000 and $140,000. The effective tax rate is currently 4.5 percent of the annual rent but is scheduled to fall to 3.9 percent in September 1998.
For 1998, the increase in the exemption threshold will cost the city $31 million. Therefore, despite growth of 4 percent in revenues from taxpayers not affected by the change in policy, commercial rent tax collections will decline to $358 million in the current year. With the new rate cut taking effect, revenues will fall to $334 million in 1999 and $345 million in 2001.
Transfer and Mortgage Recording Taxes. Historically, the real property transfer tax and the mortgage recording tax have shown great volatility, swinging with the state of the local real estate market and changes in long-term interest rates. Under IBO's forecast of continued growth in the city's economy, both residential and commercial property markets are expected to strengthen through 2001, thereby buoying receipts from these two taxes. In contrast, our projection that long-term interest rates will show only small declines from 1997 levels dampens revenue growth.
For 1998, revenues will increase very strongly, reaching $240 million for the property transfer tax and $206 million for the mortgage tax. For 1999 through 2001, we project growth in both taxes to remain strong, although not quite as robust as in 1998. For the property transfer tax, revenues will be $259 million in 1999, increasing to $288 million in 2001. For the mortgage tax, revenues are projected to be $221 million in 1999, growing to $246 million in 2001.
Personal Income Tax
The taxable income of resident individuals, estates, and trusts is subject to the city's personal income tax. The tax is progressive, with higher incomes taxed at higher rates. The rates reflect a combination of a base rate and two surcharges.4 Currently, the top marginal tax rate is 4.46 percent, which joint filers pay on taxable income above $90,000 per year. (The top rate kicks in at lower income levels for single and head of household filers.) The New York City earnings of non-resident commuters are also subject to the tax, at a rate of 0.45 percent on wage income and 0.65 percent on net income from self-employment.Tax Policy Changes. Over the next several years, city personal income tax collections will reflect the impact of tax policy changes and the strength of wage and non-wage income growth. Beginning in tax year 1997, city residents who are proprietors or partners in businesses paying the city's unincorporated business tax are entitled to a partial credit against their personal income tax liability. As a result, city tax receipts will be $55 million less in 1998 than they would have been without the credit, with the revenue loss increasing to $68 million by 2001.
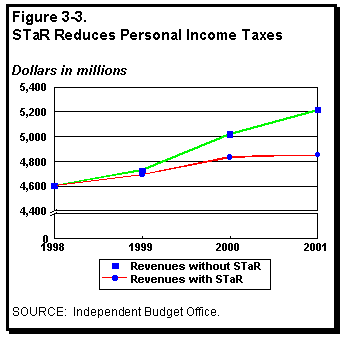
The STaR program will have an even bigger impact on city personal income tax receipts, although total city revenues will not be affected by the program. The personal income tax component of STaR combines a 10 percent rate reduction with a flat $125 per household ($62.50 for single filers) refundable tax credit. As illustrated in Figure 3-3, STaR will reduce city personal income taxes by $35 million in 1999, $186 million in 2000, and $361 million in 2001. Under the terms of the program, however, the city will be reimbursed by the state for these lost collections.
Revenue Forecast. Sustained local economic growth, a booming stock market, and a sharp increase in capital gains (profits realized from the sale of assets) have fueled personal income tax collections in the last few years. For the current year, collections net of refunds will be $4.6 billion-$240 million or 5.5 percent greater than in 1997. For 1999, however, IBO forecasts a more moderate growth rate of 1.9 percent, bringing personal income tax collections to $4.7 billion. A slower expansion of local income and employment, a cooling off of Wall Street's bull market, a reduction in realized capital gains, and the impact of tax policy changes are factors behind the modest growth.
Even though local economic conditions are expected to improve in the out-years of the forecast period, personal income tax collections will not increase much because of the growing impact of STaR. We forecast collections will be $4.8 billion in 2000 (3 percent growth) and $4.9 billion (0.4 percent growth) in 2001.
Business Income Taxes
General Corporation Tax
Most of the revenue collected from the general corporation tax (GCT) is derived from a tax of 8.85 percent on the portion of net income a corporation allocates to the city. The tax will account for $1.4 billion in 1998, or 7 percent of total tax revenues. (The GCT also yields very substantial audit revenue-$386 million in 1998.)Tax Policy Changes. Three recent initiatives are expected to reduce general corporation tax collections by $87 million in 1999. Two of these initiatives allow corporations to reduce the portion of their income taxable by the city. The third initiative gradually eliminates compensation paid to most officers from one of the alternative bases of the tax.
Another change expected to reduce collections is the establishment of limited liability companies (LLCs), a new form of business organization that offers some of the benefits of incorporation. As firms make increasing use of LLCs, the number of corporations in the city will be reduced. Increasing use of LLCs will reduce corporation tax revenues by $33 million in 1998, $52 million in 1999, and $118 million by 2001. Much of this lost revenue will be offset, however, by the taxation of LLCs under the city's unincorporated business tax.
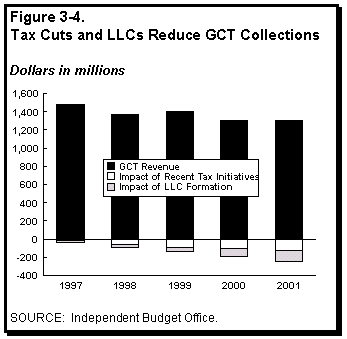
Revenue Forecast. After experiencing double-digit rates of growth in the last two years, collections will decline to $1.4 billion in 1998, a 7.2 percent reduction from 1997. For 1999, revenues will increase by $28 million, or 2.1 percent, over 1998. As shown in Figure 3-4, most of the decline from the unusually high level of 1997 collections is attributable to the growing impact of the three tax cuts and the establishment of LLCs. A slowdown in the earnings growth of city corporations also underlies the decline in revenue. Revenues will stabilize at $1.3 billion per year in 2000 and 2001.
Unincorporated Business Tax
New York City levies a four percent tax on the income of non-corporate business entities located in New York City, such as sole proprietorships, partnerships, and limited liability companies. Over two-thirds of tax collections are from businesses in the legal, financial, and health services industries.
Tax Policy Changes. In recent years many businesses have had their tax liabilities significantly reduced or even eliminated by increases in the unincorporated business tax credit. The credit provides a tax break to those sole proprietors and partnerships with relatively small liabilities. (For example beginning in 1997, sole proprietors with business incomes of $55,000 or less do not incur any unincorporated business tax liability.) As a result of the recent expansion in the tax credit, annual collections will be roughly $40 million less than if the credit had not been increased.5
Revenue Forecast. Sustained economic expansion and a turnaround of financial firms' profits have caused unincorporated business tax payments to increase by about 20 percent in each of the last two years. Continued economic strength and Wall Street's bull market are causing collections to increase in 1998, but at a slower rate. Unincorporated business tax revenues will increase 2.4 percent in 1998, yielding $574 million net of refunds.
Growth in personal income, employment, and business profits in New York City are all expected to slow during calendar year 1998, causing collections to level off at $574 million in fiscal year 1999. With economic growth expected to pick up in the out-years of the forecast period, unincorporated business tax receipts will reach $697 million in 2001.
Banking Corporation Tax
The bank tax will generate $473 million in 1998, accounting for 2.4 percent of total tax revenues. (Like the general corporation tax, the bank tax also yields a good deal of audit revenue-$100 million in 1998.)
The bank tax has been an unstable, unpredictable revenue source. Collections increased by 44.6 percent in 1996 and then fell slightly in 1997. This results from the underlying volatility of bank profits, the fact that the tax has a relatively small number of payers, and the ability of these payers to move income from one tax year into another to minimize their liabilities.
Revenue Forecast. IBO expects a continuation of the big swings witnessed in the bank tax. Because recent growth in bank earnings have not been reflected in bank tax revenues to date, we estimate collections will increase sharply. For 1998, revenues will rise to $473 million, an increase of 31.3 percent, but fall to $458 million in 1999, a 3.3 percent decline. For 2000 and 2001, we expect revenues of $562 million and $495 million, respectively.
Sales Tax
The city's tax on sales of goods and services has remained unchanged since it was raised to 4 percent in July 1974. (The total combined 8.25 percent rate also includes a 4 percent state tax and a 0.25 percent public transportation surcharge.) The sales tax base exempts most food products, medical services and supplies, mortgage and rental payments, and interstate and international telephone services. Almost all personal, professional, legal, business, and financial services are also exempt.
City sales tax revenues are largely a function of household spending, with expenditures by businesses, commuters, and tourists also playing an important role. Household spending, in turn, is largely determined by disposable income, although consumer confidence is also a contributing factor.
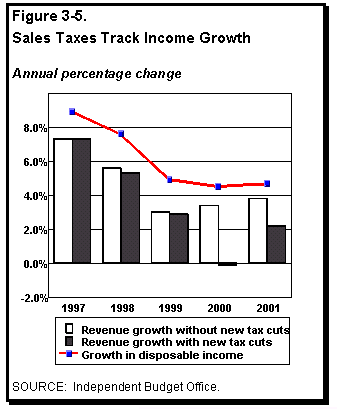
Revenue Forecast. With the city's economy continuing to expand briskly and consumer confidence at a twenty-year high, sales tax revenues will grow by a strong 5.3 percent in 1998. Collections will approach $3.1 billion for the year, a gain of $154 million over 1997.6Revenue growth will be 2.8 percent in 1999 due to decelerating economic growth and consumer confidence falling back to more normal levels. If the recent sales tax cuts had not been enacted, collections would rise 3.4 percent and 3.8 percent over the following two years. As Figure 3-5 shows, these growth rates mirror disposable income growth.
Tax cuts, however, will have a significant impact on sales tax revenues over the coming years. Starting December 1, 1999, sales of apparel priced under $100 (except footwear) will be exempt from both city and state sales taxes. This will reduce city collections by about $125 million in 2000 and $180 million in 2001. The relatively high part-year cost estimate for 2000 reflects both the typical seasonal distribution of clothing sales and the likely substantial postponement of sales from November to December 1999 to take advantage of the exemption.7
After accounting for these tax cuts, city sales tax revenues will remain flat in 2000 and grow by $71 million, to over $3.2 billion, in 2001.
Other Taxes
Other taxes will provide nearly $1.6 billion in annual revenues through 2001. These collections come from a variety of sources (such as taxes on hotel rooms, cigarettes, and utilities), payments in lieu of taxes, and revenues from tax audits. Most audit revenue is received from business taxpayers. Over two-thirds of each year's nearly $700 million in expected audit revenue comes from Department of Finance audits of corporate taxpayers of the general corporation and banking corporation taxes.
Non-Tax Revenues
Miscellaneous revenues comprise nearly 300 different non-tax sources, both recurring (such as licenses, fees, permits, and water and sewer charges), and non-recurring (such as proceeds from assets sales). Revenues from all miscellaneous sources will decline from $2.7 billion in 1998 to $2.4 billion in 1999, changing little each year thereafter.
Based on a review of the largest miscellaneous revenue sources, two items currently budgeted to provide significant revenues beginning in 1999 are unlikely to be realized.8 First, while the city hopes for a large back rent settlement with the Port Authority for lease of the city's airports ($315 million in 1999), the issue has been under arbitration for quite some time. Because there is little evidence that the issue will be resolved in the city's favor, our revenue forecast does not include these funds. Also excluded is $20 million annually the city hopes to receive from Department of Finance initiatives to consolidate collection, licensing, and adjudication functions. Because these consolidation efforts have long been planned and long delayed, we do not expect them to occur during the forecast period.
State and federal categorical grants comprise nearly one-third of the funds spent by the city each year. IBO's projections of these categorical grants are based upon currently enacted legislation and historical trends. Categorical grants from the state and federal governments will be $6.7 billion and $4.8 billion, respectively, in 1999.
Overall, state grants will grow at an average annual rate of 2.9 percent through 2001. Four agencies-the Board of Education (BOE), Department of Social Services (DSS), Administration for Children's Services (ACS), and Department of Mental Health-account for almost 90 percent of state categorical grants. The largest share, over 65 percent, goes to BOE. State grants to the Board will grow at an average annual rate of 3.3 percent through 2001. This forecast reflects both the routine growth of state formula aid and additional education commitments enacted in the current state budget. In contrast, state grants to DSS will decline slightly in 1999 and grow modestly in 2000 and 2001, due to reductions in welfare caseloads.
Federal grants will grow at an average annual rate of 3.7 percent-faster than the growth in state grants. Nearly three-quarters of all federal grants are received and spent by DSS, BOE, and ACS. Grants to DSS will decline by 1.4 percent in 1999 and then remain relatively flat through 2001. In contrast, average annual increases in federal grants to both BOE and ACS will be nearly 5 percent.
Other non-tax revenues will total $1.1 billion per year in 1998 and 1999, increasing to $1.6 billion by 2001. A significant portion of these revenues consists of unrestricted intergovernmental aid, including $327 million in per capita revenue sharing expected from the state in 1999. The state reimbursement for STaR will be $45 million in 1999 and will grow to $483 million in 2001. Although the mechanism for the state to compensate the city for the cost of the tax reduction program has yet to be tested, IBO's projections assume a full and accurate reimbursement.
Chapter 4
In this chapter, we forecast spending for all city programs by assuming that existing policies continue through 2001.We have calculated future costs for most programs and agencies by adjusting current spending levels for both inflation and any pay raises scheduled for city workers. For programs with costs driven principally by factors beyond the immediate control of the city-such as public assistance and Medicaid (caseloads) and education (enrollment)-we have developed our own models to predict future costs.
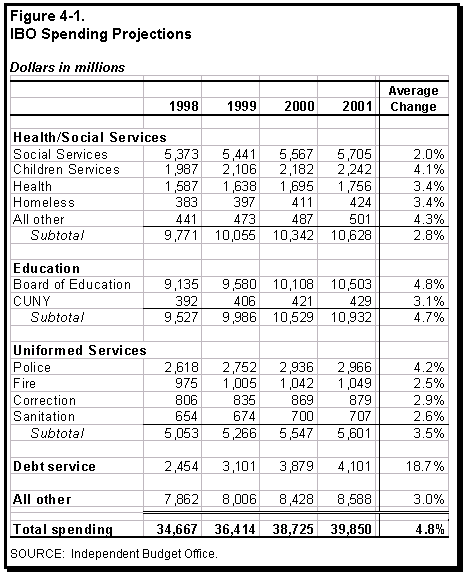
As illustrated in Figure 4-1, estimated spending will increase by an average of 4.8 percent annually over the 1998-2001 period.
Spending by Program Area
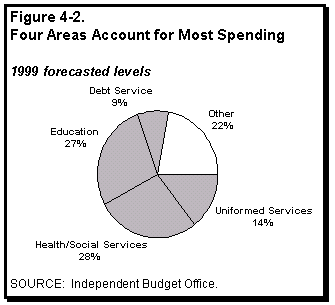
As shown in Figure 4-2, over three-quarters of the city's budget is used to pay for health and social services, education, uniformed services, and debt service.
Health and Social Services costs comprise $10.1 billion, or 28 percent of our spending forecast for 1999. Continuing declines in public assistance caseloads and reductions in the growth of Medicaid costs will contribute to a relatively slow average growth rate of 2.8 percent annually.
- Social Services. The city provides cash and medical assistance to needy individuals and shelter and support services to victims of domestic violence, people with AIDS, and the elderly.
- Administration for Children's Services. This agency's main responsibility is to care for neglected and abused children. Such care includes foster care, adoption, protection, and child support enforcement services.
- Health. The city provides funding to support the Department of Health, the Department of Mental Health, and the Health and Hospitals Corporation.
- Homeless Services. The city provides food, shelter, clothing, and other services to homeless families and individuals.
Education will account for $10.0 billion, or 27 percent of spending in 1999. Surging enrollment at city schools and rising labor costs will contribute to costs growing at an average annual rate of 4.7 percent through 2001.
- Board of Education. BOE provides elementary and secondary education for the city's children and funds various support services such as meals and transportation.
- City University of New York. The city funds six CUNY community colleges. These schools also receive significant funding from the state. The rest of the CUNY system-ten senior colleges, a graduate center, law school, technical school, and affiliated medical school-are mostly funded by the state.
Uniformed Services spending accounts for $5.3 billion, or 14 percent of spending in 1999. Most of these costs are associated with salaries and fringe benefits of the police, fire, corrections, and sanitation departments. Spending for these activities will increase at an average annual rate of 3.5 percent through 2001, due primarily to rising labor costs.Debt service (payments of principal and interest on money the city has borrowed primarily to fund capital projects) will be $3.1 billion in 1999, or 9 percent of total spending. These costs are forecast to grow at an average rate of 18.7 percent through 2001, although this figure is skewed to some extent by prepayments of debt service costs (see discussion below).
All other costs comprise the remaining $8.0 billion, or 22 percent of our 1999 spending forecast:
- The city will contribute $1.3 billion to employee pensions.
- Fringe benefits provided to city workers will cost $3.4 billion.
- Remaining costs will total $3.3 billion.
These costs are expected to increase moderately through 2001, rising at an average annual rate of 3.0 percent.
Health and Social Services
Social Services: Public Assistance
One of the greatest challenges facing the city over the next several years is the implementation of new federal and state welfare reform laws. These new laws are driving the most radical restructuring of New York's welfare system in the last sixty years.
The new federal law replaces Aid to Families with Dependent Children (AFDC) with a block grant program known as Temporary Assistance for Needy Families (TANF). It also imposes a five-year lifetime limit on families receiving cash benefits and mandates increasingly ambitious work quotas for adult family heads.
The state's new welfare law-enacted in response to federal welfare reform-maintains a two-tiered system of public assistance that largely preserves the benefit levels of the now-replaced Home Relief program.
- Family Assistance is a cash benefit available to needy households formerly eligible for AFDC. The program is funded with TANF funds and contributions from the state and city. Eligibility is limited in most cases to a cumulative total of five years.
- Safety Net Assistance is both a cash and non-cash benefit provided to needy individuals, families reaching the Family Assistance time limit, and certain other persons ineligible for Family Assistance. The state and the city evenly share the costs of the program.
Caseload Projections. We have projected public assistance caseloads through 2001 as shown in Figure 4-3.
Since 1995, favorable economic conditions and the city's pre-existing welfare reform efforts have reduced public assistance caseloads. Looking to the future, the ambitious new work requirements mandated by federal law have provided the city with further impetus to expand work programs for adult recipients of Family Assistance, increasing the incentive for some recipients to leave the rolls. Moreover, a federal prohibition against using TANF funds for assistance to immigrants arriving in this country after August 22, 1996, will limit growth in Family Assistance caseloads that would otherwise occur given continuing immigration into the city.
Accordingly, the number of households receiving Family Assistance is expected to drop steadily through 2001. This downward trend is expected to slow as the new federal requirements ultimately result in a caseload that is smaller but increasingly needy and difficult to place in private employment. Implementation of the five-year limit will make 68,000 Family Assistance recipients ineligible in 2002, even if the state exempts the maximum number of households from the time limit based on hardship. If the state chooses not to do so, the number of recipients cut off from Family Assistance could total as many as 192,000.
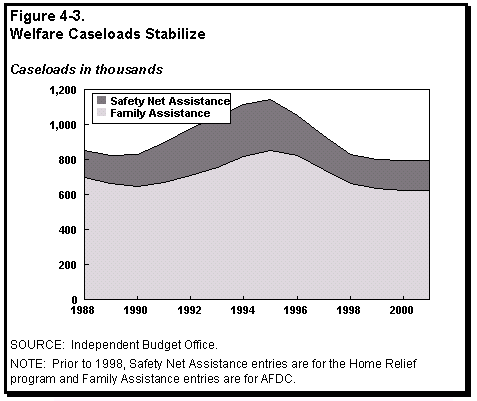
Needy individuals deemed ineligible for Family Assistance, including immigrants, may be eligible to receive help under the state- and city-funded Safety Net Assistance program. The near-term caseload trend for this program mirrors that of Family Assistance, with the number of recipients falling steadily through 1999. Unlike Family Assistance, however, the trend reverses in 2000 and caseloads begin to grow. As with Family Assistance, we expect the Safety Net Assistance caseload to become increasingly made up of very needy and hard to employ individuals. Spending Forecast. We forecast public assistance spending in 1999 will be $1.8 billion, a 3.9 percent decrease from 1998. Spending for Family Assistance will continue to decline steadily after 1999 but such reductions are expected to be offset by increases in Safety Net Assistance costs. Consequently, overall costs are expected to remain stable from 1999 through 2001. Beyond 2001, we expect Safety Net Assistance caseloads-and costs to the city-to rise as the first cohort of Family Assistance recipients reaches the five-year limit and begins to transfer to the non-federally funded program.Social Services: Medicaid
Medicaid is the main government program to fund medical care for those unable to afford private care. In New York State, Medicaid costs are shared by the federal, state, and local governments. The city's share of costs averages about 23 percent. Eligibility is typically granted to those receiving cash assistance through the Family Assistance, Safety Net Assistance, or federal Supplemental Security Income programs.
The city pays its share of costs for its nearly 1.7 million Medicaid recipients through two agencies:
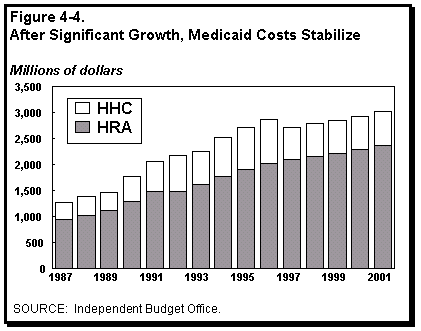
- Human Resources Administration. HRA reimburses the state for the city's share of Medicaid services provided at privately operated facilities. HRA Medicaid spending will increase from $2.2 billion in 1998 to $2.4 billion in 2001, an average growth rate of 3.3 percent.
- Health and Hospitals Corporation. The city provides funds to HHC to cover the city's share of costs for providing medical care to Medicaid recipients in the city's public hospitals. Payments to HHC are expected to remain stable at about $650 million through 2001.
As shown in Figure 4-4, Medicaid expenditures by the city more than doubled between 1987 and 1996. Several factors contributed to this dramatic increase: expensive technology and treatments increased health care costs; federal law enacted in the 1980s put pressure on states to increase reimbursement rates and expand coverage to new populations; and the economic recession of the early 1990s generated new demand for Medicaid services, as did the AIDS epidemic and an increase in the elderly population.
In recent years, city and state officials have stepped up efforts to contain Medicaid costs. Managed care-which caps rates for services and focuses on outpatient care in place of more expensive inpatient care-has slowed cost increases to well below those experienced under the traditional fee-for-service system. Costs will also be held in check as welfare reform implementation decreases the city's public assistance caseload, thereby reducing the pool of Medicaid-eligible individuals.
Spending Forecast. IBO forecasts that overall Medicaid spending in 1999 will be $2.9 billion, a 2.3 percent increase from 1998. This slow growth will continue over the financial plan period with increases averaging 2.7 percent annually. Our forecast reflects the expectation that continued cost containment measures will prevent growth rates from reaching the double digits of prior years.
Education
Board of Education
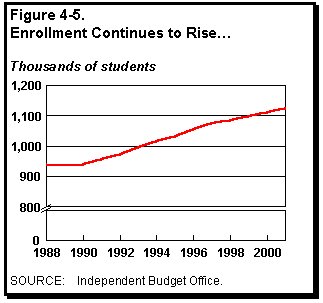
BOE provides primary and secondary education to nearly 1.1 million children residing in New York City. Through a network of more than 800 elementary and middle schools and 200 high schools, the Board provides general and special education instruction along with various support services.
Enrollment Growth. As illustrated in Figure 4-5, enrollment of primary and secondary students has been increasing at a rate of about 20,000 students annually since 1990. Much of this increase is a result of an influx of immigrants into the city in recent years. We estimate this trend will moderate to a rate of about 13,000 new students entering city schools each year through 2001, with most growth anticipated at high schools.
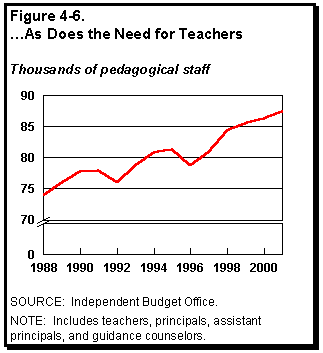
Staffing Levels. As shown in Figure 4-6, we forecast BOE will hire more teachers and other staff to meet the needs of the growing number of students. The need for additional teachers is heightened by state regulations limiting the number of daily periods a teacher can conduct classroom instruction. Moreover, agreements between the city and the teachers' union set maximum student:teacher ratios at 34:1 for high schools, 33:1 for middle schools, and 32:1 for elementary schools. (BOE policy is 28:1 for early grades K to 3.) Within this regulatory framework, rising enrollments translate into the need for additional teachers. In 2001, BOE will spend $130 million above current costs to pay for new teachers.Special Education. Special education enrollment, presently totaling 161,000 students, is contributing to our forecast of increased BOE spending. BOE costs for special education instructional support and related administrative needs rose dramatically between 1988 and 1997. The cost of meeting expanded statutory and court-ordered mandates caused special education spending to more than double, growing at an average annual rate of 7.6 percent. Future spending on special education is projected to continue to grow through 2001, although at a more moderate rate, as the growth in full-time special education students slows.
Spending Forecast. We estimate that BOE spending will be $9.6 billion in 1999, an increase of 4.9 percent from 1998. Spending will continue to grow at an average rate of 4.8 percent annually over the financial plan period, reaching $10.5 billion in 2001. Much of this growth can be attributed to the spending of additional funds expected to be received from the state and federal governments, surging enrollment at city schools, and rising labor costs. In addition, we assume a number of education programs funded for the first time in 1998 will be extended. These programs include, among others, Project Read, Project Smart Schools, and Project Arts. These three programs cost $175 million in 1998.
Uniformed Services
PoliceOne of the most basic responsibilities of any local government is to provide police services to its citizens. Accordingly, it is not surprising that New York City spends a significant portion of its budget, nearly 8 percent, on the NYPD.
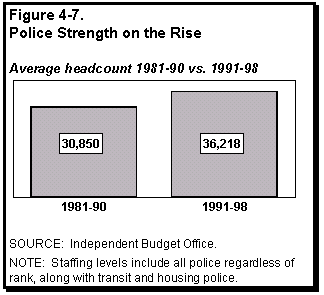
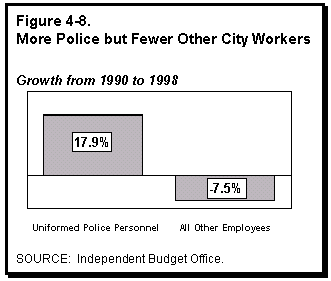
Staffing Levels. Figure 4-7 shows that uniformed police staffing in New York City has expanded substantially in the 1990s. The force now has over 38,000 officers. As shown in Figure 4-8, the city's decision to significantly expand its police force in the 1990s is even more noteworthy when compared to the reduction of other city employees over the same period.
A major turning point in force size was the implementation of the Safe Streets, Safe City initiative enacted in 1991 to combat rising crime by hiring thousands of additional police officers. The initiative was funded primarily through a personal income tax surcharge, which was recently extended through December 31, 1998.
Current Crime Levels. In sharp contrast to the latter half of the 1980s, the 1990s has been characterized by falling crime rates in the city. Serious crimes, as measured by the FBI, fell by 46 percent between 1990 and 1996, with murder falling by an even greater percentage. In 1990, there were 2,245 murders in New York. Since then, the number of murders has declined every year so that by 1996 the number had fallen to 983. Recently released FBI statistics from the first six months of 1997 indicate that these favorable trends are continuing.
Spending Forecast. Assuming no change in current force size, we estimate that NYPD spending will increase by an average of 4.2 percent annually, rising from $2.6 billion in 1998 to about $3.0 billion in 2001. Salary increases stemming from a recently arbitrated collective bargaining agreement, inflation, and projected increases in spending on programs funded through state and federal grants account for most of the expected growth.
| How Many Police Officers Are Needed?
It is clear that the city has more police and less crime now than it did a decade ago. What is less clear, however, is how much of the decline in crime is attributable to rising police force levels, more effective deployment of police resources, or some combination of the two. To what extent have factors such as demographic shifts, alterations in drug consumption patterns, rising rates of incarceration of offenders, or some combination of these and other factors contributed to the declines in reported crime? These questions continue to be the focal point of vigorous debate. IBO is in the process of analyzing data from across the country related to the relationship between the size of police forces and the incidence of crime. At this point, our preliminary review of data from other large American cities has yielded the following:
|
Debt ServiceThe city borrows money by issuing bonds primarily to pay for physical improvements to schools, roads, and other public facilities. Debt service is the repayment of borrowed funds.
Spending Forecast. Debt service costs will increase quite significantly through 2001, but year-to-year comparisons are misleading because our forecast assumes the use of $634 million in 1998 revenues to prepay 1999 debt service costs. (Complicating matters further, about $1.3 billion in 1998 debt service costs were prepaid in 1997.) While it is important that our forecast include such prepayments to show expected cash-flows for the city, it is not possible to gain a clear understanding of debt service trends and costs unless prepayments are factored out.
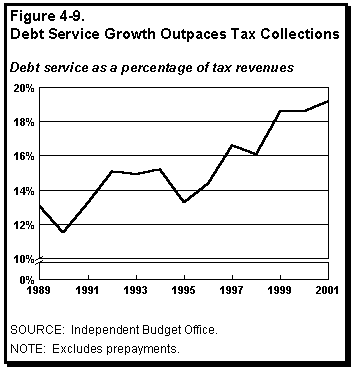
Figure 4-9 presents debt service as a percentage of city tax revenues, with prepayments omitted to illustrate underlying debt service trends. (That is, amounts prepaid are treated as if they are paid in the year in which they are actually scheduled.)
After remaining fairly stable at around 12 or 13 percent through 1991, debt service has since increased every year except one. Continuing this trend, the debt burden is projected to increase from about 17 percent in 1997 to 19 percent in 2001. Much of this increase results from high levels of capital spending over the past ten years (after a period of post-fiscal crisis capital retrenchment), the former practice of refinancing outstanding bonds that had the effect of increasing out-year costs, and sluggish revenue growth.
Capital Expenditures. Spending on capital projects generates the debt service costs included in the operating budget. Capital expenditures are forecast to remain at levels roughly consistent with spending in recent years. Average annual spending from 1998 through 2001 is projected to be $4.8 billion, while average spending from 1988 to 1997 was $4.1 billion.
Budget Stabilization Account. As part of the adopted budget for 1998, as modified in December, $514 million has been allocated to a budget stabilization account. Although some observers have referred to this account as a rainy day fund, there are two major differences.First, the city is legally prohibited from carrying forward funds from one fiscal year to the next. Accordingly, unlike a true rainy day fund, the budget stabilization account must be fully spent each year. The city can, however, replenish the account in the subsequent year by providing additional appropriations. Second, while most statutorily created rainy day funds require a fiscal emergency-an economic or revenue downturn-to occur before any funds can be used, the budget stabilization account does not.
Supplementary Information on City Labor Costs
Personnel Costs. More than half of the city's budget is used to pay the salaries and fringe benefits of its employees. Salaries account for about three-quarters of personnel costs while fringe benefits comprise the remainder. Personnel costs will rise at an average annual rate of 4.2 percent, reaching $20.2 billion in 2001.
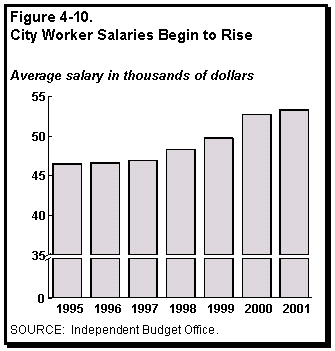
As illustrated in Figure 4-10, the average salary of a city employee, excluding fringe benefits and pensions, was stable from 1995 through 1997, but has since begun to rise and will continue to climb through 2001. This trend results from the way recent collective bargaining agreements were structured- providing no increases in the first two years of the contract but significant raises thereafter.
We have not assumed additional raises for city workers once existing labor agreements begin to expire in 2000. Each one percentage point raise for city employees in 2001 would cost about $200 million annually.
Overtime. City-wide initiatives have been undertaken in recent years with varying degrees of success to reduce overtime expenditures. While the city has been aggressively attempting to reduce overtime, programs have been implemented that necessitate its use. For instance, the Police Department's initiative to combat drug trafficking and crime in neighborhoods relies heavily on the use of overtime. We forecast overtime costs through 2001 will be nearly $500 million annually.
| 1 | Please note that all economic data in this chapter are presented on a calendar year basis. |
| 2 | When we refer to market values and assessments, we are including only taxable property. The assessed value for tax purposes reflects the required phase-in of assessment changes for apartment, commercial, and industrial buildings. |
| 3 | For a discussion of constraints on city property tax growth, see New York City's Fiscal Outlook, (IBO, February 1997) pp. 29-34. |
| 4 | While the surcharges are legally temporary and scheduled to sunset, they have each been renewed by the city and state at least once; IBO's forecast, therefore, assumes they will continue. |
| 5 | In addition, starting with tax year 1997, resident payers of the unincorporated business tax are entitled to a credit against their personal income tax liability. (This affects the city's collection of personal, as opposed to business, income taxes.). |
| 6 | The 1998 number is net of an estimated $7 million revenue loss during the one-week tax exemption for under-$100 clothing sales in September 1997, but does not factor in the projected loss from a proposed additional one-week exemption for under-$500 sales in January 1998. |
| 7 | The extent to which clothing sales tax cuts stimulate additional spending and city tax revenues was examined in IBO's fiscal brief, Would Clothing Sales Tax Cuts Pay for Themselves? (IBO, June 1997). |
| 8 | Two additional one-time items are unlikely to be realized in the current fiscal year and are excluded from our revenue forecast: the recovery from the federal government of FICA over-payments made by the city from 1986 to 1991 ($20 million), and $200 million from the sale of the Coliseum by the Metropolitan Transportation Authority. |