Beyond Meal Status: A New Measure for Quantifying Poverty Levels in the
City's Schools
October 2015
Beyond Meal Status:
A New Measure for Quantifying Poverty
Levels in the City Schools
PDF version available
here.
Summary
For many years,
eligibility for free or reduced-price lunch has served
policymakers, researchers, and advocates as the primary means
for quantifying the socioeconomic status of students in the
city’s public schools. But there are a number of concerns about
using meal status as a measure of poverty—from the considerable
number of forms that are incomplete or not returned, to the use
of a 1960s-era nationwide definition of the poverty line that
does not account for New York City’s high cost of living as the
basis of eligibility for free or reduced-price meals.
To address these and
other shortcomings of the meal subsidy approach to quantifying
student poverty, IBO has developed a measure that reflects the
income of a typical household in a particular geographic
community. This approach is not a measure of individual
household incomes of students, but rather a measure of the
incomes in the communities in which students live. We do this
based on the median household income of the census tract where
students reside. This approach can also be used to characterize
a community’s poverty status by comparing the community’s median
income level to a particular income threshold. In this report,
IBO uses the poverty threshold calculated by the NYC Center for
Economic Opportunity—which has developed a well-respected
alternative way to measure poverty in the city—as a benchmark
for our new school community income metric.
This background paper
presents details on the development of our community income
measure and how we ensure the reliability of our indicator. The
paper then applies our measure to school year 2012-2013. Among
our findings:
-
Citywide, the
average student’s community income is about $47,800, with
the community income for about a quarter of students at
roughly $30,900 or less and another quarter at $60,300 or
more.
-
The average
school community income ranges from a low of about $16,440
at P.S. 150 in Brownsville to a high of nearly $168,090 at
P.S. 89 in Tribeca.
-
The 7.5 percent
of schools with the largest share of students living in poor
communities serve student populations where between 80
percent and nearly 99 percent of students live in areas
where the community income is below the NYC Center for
Economic Opportunity’s poverty threshold. Conversely,
roughly a third of schools have a student population where
less than 10 percent come from such communities.
While eligibility for
free or reduced-price meals can reflect the income of a
student’s household, that household exists within a broader
community that also affects a student’s identity and school
performance. IBO’s new measure begins to capture that
community’s socioeconomic status.
Introduction
Policymakers and researchers
often analyze the interaction between socioeconomic status and
educational performance. The metric most commonly used relies on a
student’s eligibility for free or reduced-price lunch, a federally
funded program run by the U.S. Department of Agriculture. A student’s
meal subsidy status is treated as a proxy for poverty; that is, if a
student is eligible for free or reduced-price lunch, that student is
considered to be from a low-income household. The meal eligibility
metric measures an individual student’s socioeconomic status, and
reflects that student’s particular household characteristics. But a
student’s household also exists within a broader community—a community
that helps to mold that student’s identity and therefore affects
educational performance. In this paper, IBO introduces one measure that
begins to capture a community’s socioeconomic status using the median
household income of the community as reported by the U.S. Census Bureau.
This paper will be organized
as follows. First, we will review the New York City Department of
Education’s (DOE) process for identifying students who are eligible for
free or reduced-price lunch and our concerns with using meal eligibility
as a measure of poverty. Second, we introduce our new measure of
community income and detail how we ensure reliability for our indicator.
Third, we present three separate distributions of community income in
New York City—a distribution of all households in the census dataset, a
distribution of public school students, and a distribution of public
schools. We also look at how changing the unit of analysis across these
distributions (households to students to schools) changes the
distributions of community income. Finally, we introduce a way to
identify students who come from poor communities and aggregate to the
school level to calculate each school’s share. We compare IBO’s measure
with the widely used measure based on meal eligibility.
Background on the Use of Free or
Reduced-Price Lunch
The process by which a
student’s meal subsidy status is determined is two-fold. First, the DOE
automatically grants students eligibility for free lunch if they are
cross-matched to one of the following lists maintained by the city’s
Human Resources Administration: children in households that receive
public assistance either through Temporary Assistance to Needy Families
or food stamps; children in foster care; children who are migrant,
homeless, or runaway; or children enrolled in Head Start.1
For other students, eligibility is determined by a school meals
application that is submitted by parents or guardians to the school.
Self-reported information on household size and income earned by each
adult living in the household is used to determine if students qualify
for free lunch (household income below 130 percent of the poverty
guideline for that household size) or reduced-price lunch (household
income between 130 percent and 185 percent of the poverty guideline).2
In New York City public schools, the
overwhelming majority of students are classified as poor: roughly 80
percent of students qualify for free or reduced-price lunch.3
There are four main concerns about the use of a student’s meal subsidy
status as a measure of poverty. First, the school lunch eligibility
measure is binary—a student is classified as either “eligible for free
or reduced lunch” or not. It does not allow us to differentiate among
students within those two broad categories. Second, the self-reported
form is an imperfect measure of household income, especially since many
students do not return the form. Students that are deemed ineligible for
subsidized meals due to a missing or incomplete form are assigned to the
full-price lunch status. However, these students tend to perform
academically more like students who qualify for free lunch rather than
students who qualify for-full price lunch based on a completed form.4
Therefore, the group of students considered ineligible for free or
reduced-price lunch may not be as homogenous as it may seem, and may in
fact include many students who would be deemed eligible if proper
documentation was available. Third, many schools are increasingly
participating in federally funded programs to provide free meals to all
students in a school—through the Universal School Meals program or a
similar program for middle schools in the city—regardless of an
individual student’s meal status. As these programs expand, schools have
less of an incentive to collect the forms from each and every student.
The final concern relates to the U.S. Census
Bureau’s definition of the poverty line, which is based on assumptions
from 1963. To determine who is in poverty, the price of a low-cost food
budget, which was designed for different family compositions, is
multiplied by three. This calculation assumes that food generally
accounts for one-third of a family’s expenses, as was the case when the
measure was developed, whereas today food expenditures account for less
than one-seventh of what a family spends.5
Furthermore the measure does not vary geographically or reflect relative
cost of living differentials, which is of particular relevance in New
York City. In 2012, the nationwide poverty line for a family of two
adults and two children was $23,283. Despite these limitations, however,
a student’s meal subsidy status is still the only measure of an
individual student’s socioeconomic status that is generated by the DOE
and therefore the most widely used.
Community Income Measure
For the 2015 edition of
the Education Indicators report, IBO is introducing a measure that is
meant to reflect the income of a typical household in a particular
geographic community as a supplement to the traditional meal
subsidy-based measure of student poverty. It is important to stress that
this is not a measure of the income level of individual families, like
the free or reduced-price eligibility measure, but rather a measure of
income in the community in which students live. IBO’s goal was to create
a measure of income reflective not just of students from the
lowest-income communities in city public schools, but one that can be
used to analyze students at all points along the income distribution,
thereby capturing a student’s relative socioeconomic status. Of course,
this continuous measure can also be used to create any number of binary
measures, such as low-income/not low-income, high-income/not
high-income, or middle income/not middle-income. Therefore, we feel that
this neighborhood-based income measure is more versatile than the
individual measure of poverty that is commonly used.
IBO has created a measure of income based on
the median household income of the census tract where students reside
using data from the U.S. Census Bureau.6
A census tract is a geographic area representing between 1,200 people
and 8,000 people, and optimally covering 4,000 people.7
There are 2,167 census tracts across the city’s five boroughs. In order
to use data at the census tract level, IBO obtained five-year estimates
from the 2012 American Community Survey (ACS), covering data from 2008
through 2012. The ACS produces estimates over one-, three-, and
five-year time spans. Using the five-year estimates allowed us to work
with the largest sample size, the most reliable data, and obtain
precision for small geographic areas, such as the census tract.
Five-year estimates for 2012 include data from surveys sampled each year
from 2008 through 2012.8 The
total sample size was 215,308 housing units over the 5 years,
representing more than 3 million households. For each year, median
household income covers the preceding 12 months and represents pretax
income in 2012 inflation-adjusted dollars. The U.S. Census Bureau caps
the reported median household income for a census tract at $250,000.
One concern with using median household income
data from the ACS is that it is an estimate based on surveys of a
representative sample of the city’s households. Unlike the school meals
application that is distributed to every student, the ACS is
administered only to a representative sample of New York City’s
households. As with all samples, estimates derived from the ACS have an
associated margin of error. The margin of error for the census measure
can be quantified. In order to use only the most reliable ACS data, IBO
has excluded those estimates with large margins of error. There is also
a margin of error associated with city data on meal subsidy status, but
it cannot be quantified because only a portion of school meals
application forms are properly filled out and returned.
IBO balanced the tradeoff between including
the largest possible number of census tracts in our analysis and using
only estimates that we deemed reliable. There were no reported income
estimates for 55 census tracts (2.5 percent of the city’s tracts) in the
original data file because the U.S. Census Bureau considered those
estimates to be unreliable, most likely due to very small sampling
sizes; these census tracts were excluded from our analysis. IBO also
excluded income data from other tracts where the margin of error
exceeded a particular threshold. To do this, IBO calculated the
coefficient of variation (CV), which can be interpreted as the percent
of sampling error associated with an estimate. The CV is calculated from
the published estimates for each census tract and their margins of
error.9 A census tract with a
relatively small CV is a tract with a more reliable estimate of income,
usually reflective of a large sample size. For census tracts where the
median income is capped, the margin of error is missing, and therefore
the CV cannot be calculated. Based on several U.S. Census Bureau
publications, the
American Community Survey User Guide
suggests the following implications for the quality of an estimate based
on CV thresholds: CV less than or equal to 15 percent is considered
good; CV between 15 percent and 30 percent is considered fair; CV
greater than 30 percent is considered poor (to be used with caution).
Although there is no hard-and-fast threshold that is used universally,
IBO excluded income data for those census tracts where the margin of
error was missing or the CV exceeded 30 percent (108 census tracts).10
In all, 163 census tracts were excluded leaving us with reliable income
data from 2,004 census tracts. IBO chose to only present data from this
set of census tracts in this paper and in our
Education Indicators
report.
The distribution for this set of census tracts
weighted by the number of households represented in each tract showed
that the 2012 median household income averaged $58,860, compared with
median household income of about $52,400 for the city as a whole. There
is a large degree of variation in the distribution, with almost $234,000
separating the census tract with the lowest median household income from
the census tract with the highest median household income. Median
household income ranges from $9,700 in a census tract in the
Seagate-Coney Island neighborhood in Brooklyn up to more than $243,000
in a census tract in the Upper East Side-Carnegie Hill neighborhood in
Manhattan. The median household income for a quarter of the city’s
households is roughly $36,800 or below. At the other end of the
spectrum, another quarter of the city’s households live in areas with a
median household income that is more than double that—$75,400 or more.
Identifying Community Income for
Public School Students Citywide and by Borough
Using home addresses
for the city’s 1,100,285 public school students (including students in
charter schools) in the 2012-2013 school year, IBO was able to identify
the 2012 median income of households in each student’s tract of
residence. We refer to this measure as the student’s “community income”
to differentiate it from the traditional measure of poverty derived from
the school meals application forms.11 Of the 1.1 million students, only
148 (0.01 percent) were from census tracts with no reported median
income data. Similarly, relatively few students were from census tracts
with a missing CV or one that exceeded 30 percent (34,649 students, or
3.1 percent of all students). Both groups of students are excluded from
the summaries presented below—leaving 1,065,488 students.
Citywide, the average student’s community income is about $47,800 (see
Table 1, below). The community income for a quarter of the city’s
students is roughly $30,900 or below. At the other end of the spectrum,
another quarter of the city’s students live in areas with a community
income that is almost double that—about $60,300 or more.
At the borough level, while the minimum
student community income in each borough is roughly the same, there is
already a considerable difference by the 25th percentile that persists
throughout the distributions, especially for students in the Bronx. When
ranked by community income, students in the lowest 25 percent of the
distribution in the Bronx, Brooklyn, and Manhattan come from communities
where the income level is at least $14,600 below that of the lowest 25
percent of community income in both Queens and Staten Island. Those
patterns remain the same for the median (50th percentile) of student
community income, with the Bronx, Brooklyn, and Manhattan trailing
Queens and Staten Island; the Bronx lags far behind the other boroughs.
Half of the 243,402 students in the Bronx live in communities with an
income level below $29,200. At the other end of the spectrum, half of
Staten Island’s 66,600 students live in communities with an income level
of $74,900 or above.
Turning to the 75th percentile of the income distribution, students in
the Bronx come from communities with income levels that are nearly
$12,100 lower than in Brooklyn, the next lowest borough. In every
borough except Staten Island, there are big increases in community
income levels between the 50th and 75th percentiles of the distribution
and—as is typically the case in income distributions—the borough’s means
are greater than their medians. Staten Island is unusual in having a
mean student community income below its median. This is due to one
census tract in an industrial neighborhood in West New Brighton (serving
less than 1 percent of the borough’s students) that has a community
income well below the other census tracts on Staten Island, bringing
down the borough’s average.
Looking at the full borough-level
distributions, Manhattan has the greatest intra-borough student
community income variation with the poorest neighborhood located in
Midtown South and the richest neighborhood (excluding those census
tracts whose community income was capped) located on the Upper East
Side. Even excluding the lowest and highest income census tracts within
the borough-level distributions, Manhattan has the largest difference in
community income of the tracts at the 25th and 75th percentiles.
|
Table 1. Distribution of Student Community Income, 2012-2013
|
|
Borough
|
Number of Students
|
Minimum
|
25th Percentile
|
Median
|
75th Percentile
|
Maximum
|
Mean
|
Difference 25th-75th Percentile
|
|
Bronx
|
243,402
|
$13,556
|
$22,404
|
$29,167
|
$40,254
|
$105,682
|
$33,100
|
$17,850
|
|
Brooklyn
|
328,799
|
$9,675
|
$32,210
|
$40,559
|
$52,315
|
$170,481
|
$44,161
|
$20,105
|
|
Manhattan
|
124,865
|
$11,270
|
$27,668
|
$36,236
|
$66,944
|
$243,622
|
$52,006
|
$39,276
|
|
Queens
|
301,827
|
$13,958
|
$46,806
|
$55,399
|
$66,500
|
$137,621
|
$57,094
|
$19,694
|
|
Staten Island
|
66,595
|
$14,413
|
$57,396
|
$74,861
|
$83,226
|
$105,150
|
$69,863
|
$25,830
|
|
Citywide
|
1,065,488
|
$9,675
|
$30,893
|
$43,598
|
$60,263
|
$243,622
|
$47,823
|
$29,370
|
|
SOURCES: IBO analysis of U.S. Census Bureau American Community
Survey Five-Year Estimates 2008-2012 and Department of Education
data
New York City Independent Budget Office
|
Aggregating to the School Level
IBO aggregated across
students in each school to calculate a measure of average school
community income. After identifying the community income for each
student as described above, IBO calculated the school measure as the
average income for the students it served. Those schools missing data
from more than one-fifth of students, either because the student’s
census tract lacked information on the margin of error or because the
tract had a coefficient of variation greater than 30 percent, were
excluded from the analysis. Notably, none of the excluded schools were
high schools, which draw students from across the city and beyond the
school’s physical neighborhood due to the choice process. Finally, we
limit our analysis to schools in districts 1 through 32 that serve
students in grades kindergarten through 12, including charter schools.12
The final sample of schools includes 1,685 schools serving 982,816
students. We report school summaries citywide as well as by the grades
served: high schools and all other schools. Our definition of a high
school is a school that serves any students in any one of the high
school grades—9 through 12.
Citywide, the average school community income
is $44,919 (see Table 2 below). That is roughly $3,000 less than the
average across students, which implies that there is a substantial
concentration of low-income students in many schools. This trend is also
evident when looking at the median school, which has an income level of
$40,559, also about $3,000 less than the median for students. The
average school community income ranges from a low of $16,441 at P.S. 150
in Brownsville in Brooklyn’s district 23 up to high of $168,089 at P.S.
89 in Tribeca in Manhattan’s district 2. The average community income at
Manhattan’s P.S. 89 is more than 10 times the average community income
at Brooklyn’s P.S. 150. A quarter of the city’s schools have a community
income level at or below $33,200; at the other end of the spectrum, a
quarter have an income level at or above $52,600. The difference in
average community income for the school at the 75th percentile and the
school with the highest income is over $115,500, which implies that
there are also some schools with very high concentrations of high-income
students. The difference at the low end of the distribution (between the
minimum and 25th percentile) is a much lower $16,800, or about
one-seventh the difference at the high end.
Contrasting high schools with all other
schools, it is clear that there is significantly less variation among
high schools than there is for other schools, especially when looking at
the top quarter of the distribution. The range in the school average
income level for the school at the 75th percentile and the school with
the greatest income level is much greater for non-high schools (about
$112,000) than for high schools (about $41,000). The difference between
the average community incomes for the schools at the 25th and 75th
percentiles also reflects the greater variation among schools other than
high schools.
|
Table 2. Distribution of Average School Community Income,
2012-2013
|
|
Type
|
Number of Schools
|
Minimum
|
25th Percentile
|
Median
|
75th Percentile
|
Maximum
|
Mean
|
Difference
25th-75th Percentile
|
|
High Schools
|
550
|
$23,289
|
$33,778
|
$39,387
|
$46,542
|
$87,756
|
$41,868
|
$11,490
|
|
All Other Schools
|
1,135
|
$16,441
|
$32,820
|
$41,588
|
$55,760
|
$168,089
|
$46,397
|
$19,441
|
|
Citywide
|
1,685
|
$16,441
|
$33,244
|
$40,559
|
$52,559
|
$168,089
|
$44,919
|
$17,380
|
|
SOURCES: IBO analysis of U.S. Census Bureau American Community
Survey Five-Year Estimates 2008-2012 and Department of Education
data
New York City Independent Budget Office
|
City, Student, and School
Distributions of Community Income
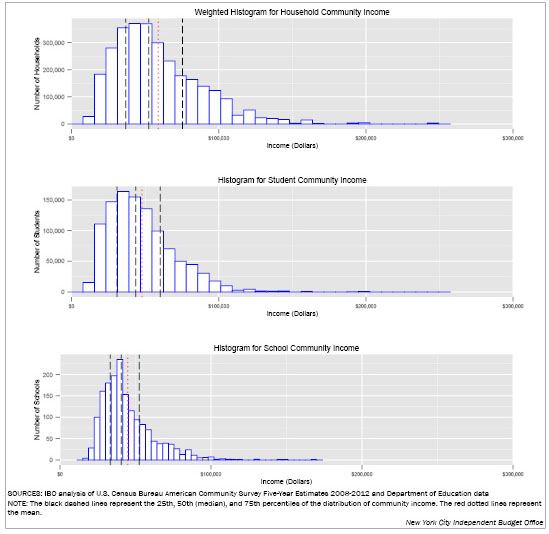
The respective distributions
of community income from all city households, to all New York City
public school students, to all city public schools show that while the
shapes are similar, the peak of the distribution moves slightly more
towards the lower end of the income spectrum as we move from one metric
to the next. All three distributions are right-skewed, which means that
the right side of the distribution extends far from the peak, or mode,
of the distribution. As a result, the median falls above the peak, and
the mean exceeds the median.
Classifying Students Who Come from
Poor Communities
In addition to providing
information about the relative level of community income based on where
a student lives, this measure can also provide an absolute measure of
community poverty by comparing the community’s median income level to a
particular income threshold. As discussed above, IBO felt that the
poverty threshold used by the U.S. Census Bureau does not accurately
reflect the true cost of living in New York City.
Instead of using the
poverty line calculated by the U.S. Census Bureau, IBO chose to use a
poverty threshold calculated by the NYC Center for Economic Opportunity
(CEO), an initiative under the Office of the Mayor. The CEO was launched
by Mayor Michael Bloomberg in 2006. Its mission included an initiative
to develop a more accurate way to measure poverty and count the poor in
New York City. Since August 2008, the CEO has published an annual report
that discusses the methodology behind the CEO-calculated threshold for
poverty and compares conditions in the city using the CEO threshold and
the U.S. Census Bureau’s official threshold. The annual report was
officially mandated in the New York City Charter in December 2013.
The CEO threshold is
calculated based on a five-year moving average of what families spend on
basic necessities, including food, clothing, shelter, and utilities, and
additionally accounts for higher housing costs in New York City.13
The CEO threshold was intended to be used in conjunction with the CEO
income measure, which, in addition to pretax cash income, also includes
the cash-equivalent of in-kind transfers such as food stamps and housing
assistance. The CEO income measure additionally deducts income and
payroll taxes and nondiscretionary spending costs such as commuting,
child care, and out-of-pocket medical expenses. IBO is unable to
replicate CEO’s adjustments to income data and therefore relies on
available median household income data.14
While the size of the median household in a census tract can vary, IBO
chose to use the CEO threshold amount of $31,039 based on a family of
four (two adults and two children) since that composition is widely
used.15 The ratio of the CEO
threshold to the official threshold for that specific family composition
was 1.333 in 2012.
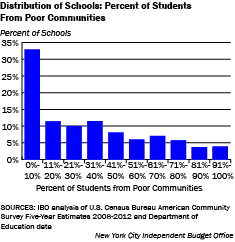
For each of the 982,816 students in the 1,685
schools in our sample, IBO classified a student as coming from a poor
community if the median household income in the census tract where the
student resided was below the CEO threshold. For each school, IBO
calculated the share of students who come from poor communities. Roughly
a third of schools serve a student population where less than 10 percent
come from poor communities. In another third of schools, from 10 percent
to 40 percent of students come from poor communities. The 7.5 percent of
schools with the largest share of students from poor communities serve
between 80.0 percent and 98.8 percent poor students.
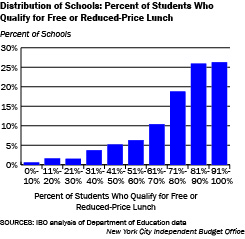
IBO compared the distribution of schools by
this new metric with the distribution of schools by the percent of
students who are eligible for free or reduced-price lunch based on
federal guidelines. There are two key differences in the two measures:
the unit of analysis (census tract versus family) and the treatment of
the threshold for defining poverty. First, the unit of analysis for meal
subsidy eligibility is based on an individual student’s family income
level (taking into account the number of people in the family), whereas
IBO’s metric is based on the median income level of households within
the community where the student resides. By construct, using the median
household income in the community means that only those communities with
a particular concentration of poor households will be classified as
poor. Second, the income measure for meal subsidy eligibility is
multiplied by 1.3 or 1.85 in determining free or reduced-price lunch
eligibility, respectively. Because the guideline is multiplied by a
factor, many city students come from families with reported income below
the guideline. When determining if a community is poor, IBO used the
CEO’s threshold directly when comparing against the median income from
the community. Based on these differences in the construction of the
measures, we would expect that the meal subsidy eligibility measure
would classify many more students as poor—and thus eligible for free or
reduced-price lunch—than IBO’s measure of the percent of students who
come from poor communities.
As expected, more than half of the schools
serve a student population where more than 80 percent qualify for free
or reduced-price lunch. Another roughly 20 percent of schools serve from
70 percent to 80 percent of students who qualify. On the other end of
the spectrum, just 3.6 percent of schools have 30 percent or fewer
students who qualify for free or reduced-price lunch. The distribution
of schools using this metric is highly skewed towards the high end of
the distribution—that is, most schools serve very high shares of
students who qualify for free or reduced-price lunch.
While schools tend to be concentrated at one
end of the distribution regardless of which measure of poverty we use,
IBO’s measure of the percent of students from poor communities allows us
to better differentiate among schools because fewer schools are
concentrated at one end. Roughly two-thirds of schools are relatively
evenly distributed in terms of the share of students from poor
communities—ranging from 10 percent up to 98.8 percent. In contrast,
more than 70 percent of schools serve from 70 percent to 100 percent of
students who qualify for free or reduced-price lunch, limiting our
ability to differentiate among schools.
Conclusion
IBO’s measure of community
income can be a useful tool to better assess the income level of
students’ communities citywide and also to better understand the student
populations that individual schools serve. The distribution of student
community income peaks near the low end of the distribution, but there
are also many students who come from relatively high income communities.
Looking at the schools that students attend, we find that there are many
more schools at the lower end of the distribution. This is consistent
with the fact that some elementary and middle schools serve high
concentrations of students from low-income communities because they tend
to be neighborhood schools. IBO also used this measure to identify
students at the lowest end of the community income spectrum in a process
analogous to the determination of a student’s eligibility for free or
reduced-price lunch based on family income. When aggregating to the
school level, we found that about a third of schools serve at most 10
percent of students from poor communities.
Report prepared
by Sarita Subramanian
with Stephanie Kranes
Appendix
IBO chose to report
separately on the schools that span multiple physical locations or cover
whole geographic districts. Those schools include: district 75 schools
serving only students with disabilities, home-schooled students,
universal pre-kindergarten programs in community-based organizations
(CBOs), and district 79 programs serving overage and under-credited
students. District 75 schools and district 79 programs often span
multiple sites. For each school district, DOE aggregates enrollment in
pre-kindergarten in CBOs and home-school designations. The citywide
distribution of community income for those schools is reported below.
District 75 schools serve students with a similar distribution of
community income as with other city schools reported in Table 2. Among
schools that span multiple locations or cover whole geographic
districts, home-schooled students have the largest range in community
income and the highest mean and median community income. District 79
appears to serve the most homogenous group of students in terms of
income out of all the groups reported, and students in these schools
tend to come from relatively poor communities.
|
Distribution of Average School Community Income for Select
Schools, 2012-2013
|
|
Borough
|
Minimum
|
25th Percentile
|
Median
|
75th Percentile
|
Maximum
|
Mean
|
Difference 25th-75th Percentile
|
|
District 75
|
$28,478
|
$35,913
|
$40,822
|
$53,514
|
$72,315
|
$44,608
|
$11,687
|
|
Home School
|
$25,006
|
$40,254
|
$50,460
|
$62,085
|
$105,856
|
$52,298
|
$18,162
|
|
CBO Pre-K
|
$24,206
|
$36,789
|
$44,551
|
$56,339
|
$73,372
|
$46,271
|
$12,636
|
|
District 79
|
$36,918
|
$38,608
|
$40,417
|
$43,166
|
$44,531
|
$40,676
|
$2,830
|
|
Citywide
|
$24,206
|
$36,918
|
$43,091
|
$56,224
|
$105,856
|
$46,650
|
$13,786
|
|
SOURCES: IBO analysis of U.S. Census Bureau American Community
Survey Five-Year Estimates 2008-2012 and Department of Education
data
New York City
Independent Budget Office
|
Endnotes
1Regulation of the Chancellor #A-810,
“Eligibility
for Free and Reduced-Price Meals,” issued June 29, 2009.
2Eligibility for meal subsidy for students in the 2012-2013
school year was determined in August 2012 based on an estimation of the
2012 poverty line, which the U.S. Department of Health and Human
Services calls the “federal poverty guideline.” This is different from
the official poverty line because the guideline uses historical data,
adjusted for inflation since the last official threshold. The
preliminary official poverty line for 2012 was published in January 2013
and finalized in September 2013.
3“New
York City Public School Indicators: Demographics, Resources, Outcomes,”
New York City Independent Budget Office, May 2013.
4See relevant tables in section 4 of “New
York City Public School Indicators: Demographics, Resources, Outcomes,”
New York City Independent Budget Office, 2011.
5“The
Development of the Orshansky Thresholds and Their Subsequent History as
the Official U.S. Poverty Measure,” Gordon M. Fisher, U.S.
Department of Health and Human Services, May 1992 (partially revised
September 1997). More recent
work by the NYC Center for Economic Opportunity has sought to
provide a more accurate threshold for poverty for New York City.
6IBO also considered using income estimates only of (1)
family households and (2) households with children under the age of 18
(school-age children), but the smaller sample size of both of those
estimates led to high margins of error and IBO considered them
unreliable at the census tract level.
7https:www.census.gov/geo/reference/gtc/gtc_ct.html,
accessed 3/31/2015.
8IBO considered using data at the census block group, but
that data is only available for the decennial census and we prefer to
use the most current data possible.
9The U.S. Census Bureau’s presentation on “Things
that May Affect Estimates from the American Community Survey” guided
IBO’s CV calculations. The CV is the standard error divided by the
estimate times 100 (interpreted as a percent). The standard error is
equal to the published margin of error divided by 1.645, because the
margin of error is based on a 90 percent confidence interval for ACS
estimates.
10IBO also tested the sensitivity of this threshold using CV
of 33 percent and 40 percent, but felt that those thresholds allowed for
too much error in the income estimates.
11Students for whom the DOE did not have an address on file
or whose address was outside of the five boroughs were excluded from the
analyses.
12The schools we report on separately in the appendix but
exclude from the main analysis are: district 75 schools serving only
students with disabilities, home schooled students, universal
pre-kindergarten programs in community-based organizations, and district
79 programs serving overage and under credited students. Schools that
had fewer than 20 students were also excluded.
13“The
CEO Poverty Measure, 2005-2012: An Annual Report from the Office of the
Mayor,” NYC Center for Economic Opportunity (CEO), April 2014.
14We acknowledge that in using median household income data,
our measure counts more students as coming from poor communities than
the full CEO methodology would. Therefore, our rates cannot be compared
with the CEO’s published statistics for New York City and its
neighborhoods. However, we still believe that using the CEO threshold is
more accurate than using the official poverty threshold.
15A family size of four (two adults, two children) was chosen
because it is widely used and probably a reasonable assumption for the
census tracts that are included in our study. Because we exclude tracts
with larger CVs, we also likely exclude tracts for which a different
family structure is more prevalent. Additionally, the National Academy
of Sciences found in 1995 that this was the most common structure among
families with children less than 18 years of age. Citro, Constance F.
and Robert T. Michael (eds). Measuring Poverty: A New Approach.
Washington, DC: National Academy Press. 1995.
PDF version available
here.
Receive
notification of free reports by
e-mail
Text Facebook
Twitter
RSS