Introduction
Every spring, the New York City Water Board sets the rates that customers will be charged for the water and sewer system for the following fiscal year (all years in this report refer to the fiscal year.) The revenue generated from user payments needs to cover the system’s costs and as system costs have been rising, the rates have increased nearly every year. The annual rate setting process brings complaints from homeowners, advocacy groups, and elected officials that the rates are burdensome to water and sewer customers, and calls for greater effort to prevent rate increases. On April 23, 2014, the New York City Department of Environmental Protection (DEP) presented the proposed rates for 2015, which includes an increase of 3.35 percent for the combined water and sewer rate—a smaller increase than the city had previously projected. The current rate of $9.27 per 100 cubic feet of water used would increase to $9.58 per 100 cubic feet with the annual bill for the average single-family home increasing from $991 to $1,025; and for the average unit in a multifamily building the annual bill would grow from $644 to $666. The Water Board will soon hold a series of public hearings on the rate proposal and decide whether to adopt the proposed increase by the end of May.
Part of the rate setting process involves determining the annual rental payment that the Water Board makes to the city for the use of the city-owned water system. A common complaint is that the rental payment is a hidden tax that takes revenue from the ratepaying customers and transfers it to the city’s general fund. Mayor de Blasio, during his term as Public Advocate and while campaigning for Mayor, made this charge, stating in a letter to the Water Board that “the water system should not be used to generate money for the City’s general budget at the expense of home and business owners. Rent paid by the Water Board should be used only to cover costs associated with the water system, and not be used to balance the City’s budget.”
The current rate proposal, the
first from the de Blasio Administration, includes a rental
payment of $233 million to be paid from the Water Board to
the city in 2015—an amount $14 million greater than the 2014
rental payment. However, to hold down the overall rate
increase by offsetting the rental payment’s growth, the
proposal also assumes that the city will return $22 million
of the 2014 rental payment back to the Water Board in
addition to $14 million the city had already committed to
return as part of a pilot program to cap the rental payment.
Of course, efforts to reduce the overall water and sewer
rate increases by reducing or forgiving some of the rental
payment would reduce city revenue, requiring less spending
on other city programs or more revenue from other taxes and
fees.
The rental payment has, in fact, grown in recent years, but
it is only 7 percent of the total revenue that is required
to be collected from city ratepayers. Other costs, such as
growing debt service payments for billions of dollars in
capital spending and rising operations and maintenance (O&M)
costs, including the salaries and fringe benefits of water
and sewer system employees, account for much more of the
additional revenue needed each year than increases in the
rental payment, and are primarily responsible for the
increasing rates.
This report explains the basis of the rental payment, its effect on water and sewer rates, and examines the savings being generated by a three-year pilot effort to cap the growth of the rental payment. Our analysis suggests that changes to the rental payment have little effect on water and sewer rates.
New York City Water and Sewer System Overview
The water and sewer system operates in a unique legal and financial structure in comparison with other municipal services in the city. Since passage of the New York City Municipal Water Finance Authority Act by the New York State Legislature in 1984, the system has functioned through three separate entities: the Municipal Water Finance Authority (also known as New York Water or NYW), the New York City Water Board, and the Department of Environmental Protection. NYW and the Water Board are independent corporate bodies while DEP is a mayoral agency; yet all three bodies are effectively under the control of the Mayor, who appoints the commissioner of DEP, all seven members of the Water Board, and five of the seven members of NYW’s Board of Directors.1 DEP is responsible for the maintenance and operation of the system, NYW issues bonds to finance the extensive capital improvements to the system, and the water board sets rates and collects revenue from the system’s customers. During the annual rate setting process, DEP presents a rate proposal to the Water Board, which then votes to approve the final rate.
Lease and Financing Agreements and the Rental Payment. The lease agreement between the Water Board and the City of New York began on July 1, 1985 and will be in effect for 40 years or until all bonds issued by NYW are paid in full, whichever is later. Under the agreement, the Water Board makes an annual rental payment to the city’s general fund. In part, the rationale for the payment is to reimburse the city for services that the system receives, such as police, fire, and sanitation; similar payments are standard practice among water utilities throughout the country.
In a given year the rental payment is an amount not to exceed the greater of: i) the current year’s principal and interest on general obligation bonds issued by the city for water and sewer purposes prior to the 1984 restructuring of the system, or ii) 15 percent of the current year’s debt service on NYW bonds. Beginning in 2005, the latter has been the larger amount and the city has since used it as the basis for the payment. While the terms of the lease agreement specify that the rental payment is paid “only to the extent requested by the city in each Fiscal Year,” the financing agreement between the city, NYW, and the Water Board requires the board to collect revenues equal to the actual debt service due that year plus an additional 15 percent as a reserve. Thus, if the city chose to not request a rental payment in a particular year, the Water Board would still have to collect the projected debt service plus the extra 15 percent, although the reserve could then be used to mitigate any rate increase for the following year. The city’s general fund would be short the forgone rental payment.
Rising Water and Sewer Rates
Revenue from rates set by the Water Board need to cover the system’s O&M expenses, debt service on the bonds issued by NYW, and the rental payment to the city. Operations and maintenance expenses include a wide range of costs, primarily to bring drinking water from upstate watersheds to over 9 million customers in New York City and surrounding communities and to process the wastewater of New York City residents through the sewer system and at 14 wastewater treatment plants. This includes the salaries and benefits of nearly 6,000 DEP employees, property taxes paid to upstate governments, energy usage costs, chemicals used in the treatment of water, and various other costs. Debt service payments cover interest and principal on NYW bonds, which finance multibillion dollar capital projects including the City Water Tunnel No. 3, extensive upgrades to the Newtown Creek Wastewater Treatment Plant, and the construction of the Croton Water Filtration Plant, as well as more routine projects like the reconstruction of aging sewers.
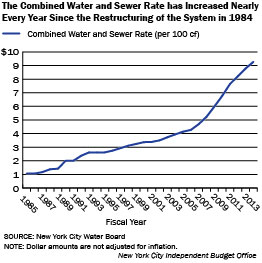
Rising costs have led the Water Board to increase the water and sewer rate every year since 1995, sometimes in excess of 10 percent in a single year. Over the past decade, the rate has increased by 135 percent—from a combined water and sewer fee of $3.94 per 100 cubic feet in 2004 to the current rate of $9.27 per 100 cubic feet for 2014. This current rate works out to 1.2 cents per gallon of water used.
The Water Board approved the 2014 rate based on total required in-city revenue of $3.4 billion, which includes a projected rental payment cost of $241 million.2,3 While the share of the required revenue needed to cover the rental payment is relatively small (7 percent), the amount of the rental payment has grown significantly in the past decade. From 2005, the first year that the amount of debt service on NYW bonds was the basis for setting the payment, through 2013, the most recent year that a payment was made, the rental payment increased by 91 percent, from $109 million to $208 million. The increase in the rental payment is a direct result of the increase in debt service, which grew by 108 percent from $701 million in 2005 to $1.5 billion in 2013. Operations and maintenance costs have grown more slowly, by 40 percent, from $836 million in 2005 to $1.2 billion in 2013. While DEP efforts to control O&M costs have contributed to this slower growth, another key reason is that collective bargaining agreements for DEP employees remain unsettled; 85 percent of active DEP employees have been working under contracts that expired before the end of 2010. Depending on the outcome of negotiations, significant resources may be needed to meet the terms of the new contracts. Since 2005, the growth of the rental payment has on average required an additional $12 million to be raised every year, while debt service and O&M increases have required an average $95 million and $42 million in new revenue each fiscal year, respectively.
|
Debt Service Growth Contributes Most to Rate
Increases
Dollars in millions |
|||
|
Fiscal Year |
Gross Rental Payment |
NYW Debt Service |
O&M Costs |
|
2005 |
$109
|
$701
|
$836
|
|
2013 |
$208
|
$1,458
|
$1,168
|
|
Percent Change |
91% |
108% |
40% |
|
Average Annual Cost Increase (New Revenue Required) |
$12
|
$95
|
$42
|
|
SOURCE: New York City Water Board
NOTE: The gross rental payment is the rental payment
before the imposition of caps, which are in effect
from 2012 through 2014.
New York City Independent
Budget Office |
|||
Rental Payment Cap Pilot Program
After years of contentious rate increases, DEP and the Water Board identified the rental payment as one way that rising costs could be controlled in order to slow future rate increases. A pilot program, one of several initiatives in the effort to limit rate increases, was adopted in the 2013 rate-setting process to cap the rental payment for three years. For 2012, the payment was capped at the 2011 level of $196 million and then allowed to grow by 1.5 percent to $199 million in the second year, and by 3.0 percent to $205 million in the third year; these increases reflected inflation expectations at the time of the agreement.4
To adhere to the NYW bond covenants, protect the bonds’ credit ratings, and raise enough money for sufficient bond coverage, the Water Board still pays the city the full 15 percent of NYW debt service, referred to as “the gross rental payment.” The city then returns to the Water Board the portion of the rental payment made in excess of the capped amount the following fiscal year, which offsets revenue that would otherwise need to be raised through a rate increase. When the caps were first proposed, DEP estimated that these rental payments returned by the city would be $14 million in 2013, $32 million in 2014, and $52 million in 2015—a total savings of $98 million over three years.
What Savings Is the Cap Actually Generating? The $98 million in savings is still projected to be realized over three years, but roughly one-third is attributable to the rental payment cap while roughly two-thirds of this amount—$63 million—is attributable to lower-than-expected debt service costs, and by extension, lower-than-expected gross rental payments. Due to conservative financing assumptions and refinancing of existing debt to take advantage of low interest rates, the gross rental payments were actually lower than projected, $208 million in both 2012 and 2013, which was $2 million less than originally projected for 2012 and $23 million less than projected for 2013. DEP’s most recent assessment from April 2014 projects that the gross rental payments will be $219 million in 2014 (paid at the end of the year) and $233 million in 2015—respectively $38 million and $37 million less than originally anticipated.
With less money paid above the
capped amounts, the amounts returned from the city to the
Water Board will be smaller. The returned rental payment was
$12 million in 2013, will be $9 million in 2014, and is now
projected to be $14 million in 2015. This brings the current
forecast of total savings from the pilot to $35 million over
three years, roughly one-third the original projection.
The cap on rental payments is having a minimal effect on
lowering water and sewer rates. For example, capping the
rental payment was originally expected to reduce the revenue
that the Water Board needed to collect from city ratepayers
to cover its 2014 costs by 1.0 percent. Under these
projections the cap would be responsible for lowering the
2014 water and sewer rate by 9 cents per 100 cubic feet from
what would have been a rate of $9.36 per 100 cubic feet to a
rate of $9.27 per 100 cubic feet. For the average
single-family homeowner, this would have been a savings of
about $9 for the year.
|
Projected
Savings from the Rental Payment Cap
Dollars in Millions |
|||||
|
As First
Proposed in March 2012 |
2011 |
2012 |
2013 |
2014 |
2015 |
|
Gross Rental Payment |
$196
|
$210
|
$231
|
$257
|
$270
|
|
Capped Rental Payment |
|
$196
|
$199
|
$205
|
|
|
Payment in Excess of Capped Amount |
|
$14
|
$32
|
$52
|
|
|
Returned Rental Payment (1-year Lag) |
|
|
$14
|
$32
|
$52
|
|
Actual Payments and Current Projections as of April
2014 |
2011 |
2012 |
2013 |
2014 |
2015 |
|
Gross Rental Payment |
$196
|
$208
|
$208
|
$219
|
$233
|
|
Capped Rental Payment |
|
$196
|
$199
|
$205
|
|
|
Payment in Excess of Capped Amount |
|
$12
|
$9
|
$14
|
|
|
Returned Rental Payment (1-year Lag) |
|
|
$12
|
$9
|
$14
|
|
SOURCES: Department of Environmental Protection’s
2013 Water Rate Proposal Presentation from March 30,
2012; Department of Environmental Protection’s 2015
Water Rate Proposal Presentation from April 23, 2014
New York City
Independent Budget Office |
|||||
While the required revenue did in
fact decrease by 1.0 percent, the rental payment cap was
only responsible for a reduction of 0.3 percent; the bulk of
the savings was instead attributable to the
lower-than-expected debt service expense. The cap was
responsible for reducing the 2014 combined water and sewer
rate by 2 cents per 100 cubic feet from what would have been
a rate of $9.29 per 100 cubic feet. For the average
single-family homeowner, this is a savings of about $3 for
the year.
A more effective rate reduction program might have
guaranteed a certain level of savings rather than a limit on
the amount of the rental payment. The current rate proposal
for 2015 includes an initiative along these lines, which if
approved, will see an additional 10 percent of the 2014
gross rental payment—$22 million—returned by the city in
2015 on top of the projected $14 million returned due to the
cap.
Limitations to Rate Mitigation Through the Rental Payment
While the savings attributable to the rental payment cap have been modest, the larger savings that the cap was originally projected to generate would still have been relatively small in comparison with the recent trend of rate increases ranging from 5 percent to 15 percent every year. Even if there were more significant reductions in the rental payment, the effect on yearly rate increases would be limited; if the rental payment had been eliminated entirely for 2013 and all future years, the 2014 rate would have been 57 cents per 100 cubic feet less than the current rate, savings of about $61 a year for the average single-family homeowner.5 These savings would have been enough to allow the city to avoid a rate increase altogether in 2014.
Yet rate increases would still be necessary in 2015 and yearly thereafter to pay for the increases in the cost of debt service and O&M—by far the biggest drivers of rising water and sewer rates. Eliminating the rental payment would save city ratepayers a total of approximately $200 million every year, but in terms of providing relief from yearly rate increases, eliminating the payment would only have a significant effect for one year.
Unless the pilot program is extended, 2014 is the last year that the rental payment will be capped, although savings from the cap will still be realized for the 2015 rate. While the pilot program has only modestly reduced rate increases, the return to an uncapped rental payment combined with rising interest rates could result in steeper rate increases. DEP’s four-year capital plan of $7.5 billion will require financing for years to come, and with interest rates expected to increase it will likely become harder to generate debt service savings from refinancing, which means growth in the rental payment will continue and likely accelerate.
Considerations for Managing Future Rate Increases
Lowering the rental payment has
only a limited impact on reducing water and sewer rates.
More substantial savings would require reducing debt service
by curtailing the size of the capital program or lowering
the cost of operations and maintenance. Apart from these
options, there are few opportunities for significantly
reducing future rate increases due to the legal structure of
the system. Ratepayers must collectively pay for the full
costs of the system every year—and like most municipal
services, costs rarely decrease over time.
In addition to lowering system costs, the need to raise
rates could also be reduced by capturing revenue that is
missed due to delinquency or under-billing. In recent years,
DEP has taken measures to increase billing accuracy through
expanding automatic meter readings and limiting the number
of properties that receive flat rate billing. They have also
addressed nonpayment by gaining the authority to sell liens
on certain delinquent properties, although many types of
properties—including all single-family homes—are exempt from
this process. Expanding the types of properties eligible for
the lien sale could bring in more revenue and lessen the
need to seek additional revenue in the form of higher rates.
Larger savings that could mitigate rate increases or even result in rate reductions could be realized through changes to the financing structure of the system, more specifically by having some of the system’s fixed costs paid directly by the city rather than by water and sewer revenues. DEP operations that are not tied to drinking and wastewater, such as stormwater management, have a set price regardless of how much water customers actually use. These fixed costs would then be financed like other city services that do not have to cover their costs through user fees. This would, of course, not decrease the costs of providing water and sewer services to city residents; it would simply have more charged to taxpayers rather than to ratepayers. Paying for certain expenses through the city’s general fund rather than user fees could be seen as a more equitable approach because the flat water and sewer rate is the same for every customer and regressive with respect to income.
DEP and the Water Board have also considered changes to the flat rate structure that would not require changing the system’s legal foundation. A rate study commissioned by the city in 2009 suggested the possibility of adding fixed charges to cover some of the system’s fixed costs, separate stormwater charges, and conservation rates, where a customer’s rate would increase after a certain amount of water usage. These options would also not alter the amount of revenue that the Water Board would ultimately have to collect, but they could tie user payments more directly to the costs being generated by the uses of the system. DEP and the Water Board have conducted a small pilot program to charge stormwater fees on certain properties, but beyond this they have not recommended altering the current flat rate structure.
Report prepared by Justin Bland
PDF version available here.
Endnotes
1Four
of NYW’s seven member Board of Directors are ex officio
members. Three of these are city officials who were
appointed by Mayor de Blasio: the Commissioner of DEP, the
Director of the Mayor’s Office of Management and Budget, and
the Commissioner of the Department of Finance. The other ex
officio member is the Commissioner of the New York State
Department of Environmental Conservation. The remaining
three members are public appointees: two of whom are
appointed by the Mayor and one is appointed by the Governor.
It should be noted that being only four months into the
administration of Mayor de Blasio, the current members of
the Water Board and the mayoral public appointees of NYW
were all appointed by Mayor Bloomberg. At the time of this
report’s publication, there are two vacancies on the Water
Board that will be filled by Mayor de Blasio.
2This excludes the 5
percent of total system revenue generated by upstate
customers that is subject to a separate rate-setting
process.
3The estimate of the
rental payment changes as the city updates its financial
plans. This amount, $241 million, represents the estimated
rental payment at the time of the rate setting in May 2013.
It differs from the estimate of $257 million from March 2012
discussed elsewhere in this report.
4The rental payment is
made at the end of the fiscal year, so the 2012 payment
could be capped even though the pilot program was first
proposed near the end of that fiscal year.
5This calculation assumes
a scenario where the rental payment was not requested by the
city in 2013 and the extra 15 percent of NYW debt service
that had to be collected that year was used to reduce the
total in-city revenue that needs to be raised in 2014.
Receive notification of free reports by e-mail