Every year New York City sells liens on approximately 5,000 properties in its annual tax lien sale. The lien debt is comprised of unpaid property taxes, water and sewer charges, and various other charges against properties. The total value of the liens in these sales ranged between $70 million and $110 million annually from 2009 to 2012. There are significant consequences to having a lien sold on a property, including facing a repayment schedule to a third-party lien servicer at an 18 percent interest rate and the risk of foreclosure by the servicer if payments are not made. Property owners who do repay their liens pay substantially more than they originally owed the city. Owners who do not repay their lien debt typically see the amount they owe double after three years and may have foreclosure pursued against their property.
There is a notable set of properties that have liens sold on them multiple times (for separate delinquencies) in the span of a few years. The repayment pattern for these properties is strikingly different than that of properties without prior liens. While the majority of owners of properties with a single lien pay their liens in full, a majority of owners of properties with multiple liens do not make any payments on any of their liens.
The city can ultimately receive more money than was originally owed in delinquencies through the lien sale because owners pay the original debt plus interest and fees. The inclusion of properties in the lien pools with debts that are most likely to be paid off is needed to make bonds backed by the liens attractive to private investors and to increase collections. Determining that a property with new outstanding debt was included in an earlier lien sale can indicate that its new lien will not be repaid and that it is possibly already in the foreclosure process. However, this distinction is not a determining factor in having properties disqualified from the lien pool, leading to the addition of a new debt burden on properties that are already heading toward foreclosure and the sale of collection rights for a debt that is not likely to be redeemed.
Background
New York City has been conducting annual lien sales since 1996 (all years refer to fiscal years) to collect unpaid property taxes and other charges as an alternative to the in-rem process in which the city took direct ownership of delinquent properties along with responsibility for maintenance and operating costs. The sale of liens, or the transfer of the legal claim to collect a debt, generates revenue for the city in two ways: it encourages property owners to settle their accounts in order to be removed from the list of potential lien sale properties, and it brings in cash payments through the actual sale of the liens.
Property owners with delinquencies that are eligible to be sold are first notified 90 days before the next scheduled lien sale and are further notified 60 days, 30 days, and 10 days before the sale date. To be removed from the lien list, property owners can pay off their debts or enter into payment agreements with the city. Terms of the agreements include up to 10 years to repay at an annual interest rate of 18 percent (the same rate charged by the city on all property-related delinquencies) and no down payment is required.1 The Mayor’s Office of Management and Budget (OMB) estimates that from 2008 through 2010, approximately three-fifths of the properties on the 90-day lists were removed in this way. Properties can also be removed from the lists if it is determined that the charges were listed in error or that the property is somehow exempt from the sale. From 2008 through 2010 about one-fifth of the properties on the 90-day lists were in the latter category, according to OMB.
The eligible debts of the remaining one-fifth of the parcels on the original 90-day lists—the properties that are not exempt, have valid charges, and whose owners do not settle their delinquency with the city or enter a payment plan by the sale date—are the liens that are sold. On the sale date, the city adds a 5 percent surcharge and an administrative fee of roughly $200 to the outstanding balance and sells the liens to a tax lien trust, a Delaware statutory trust formed by the city for the purpose of issuing bonds. After the sale, the city no longer owns the liens and no longer has a role in the collection process. The trust sells bonds to third-party investors and uses the proceeds to give the city a cash payment in exchange for the tax liens. The liens are sold at discount, the extent of which varies with every lien sale; on average the initial payment from the trust to the city is about 73 percent of the total value of the lien pool. The trust hires a private collection agent, or ”servicer,” to bill and collect payments from property owners with liens.2 If property owners do not make their required payments to the servicer, the servicer can pursue foreclosure on the properties. The trust pays the bondholders with the tax lien revenue collected by the servicer. After the investors are repaid, any residual interest is then paid to the city.
Since the program’s inception, lien sales have been reauthorized several times. With each reauthorization, there have been changes to the program in terms of the types of properties eligible, to allow additional types of liens to be sold, and to add exemptions to the sale process that protect vulnerable populations from having their properties included in a lien sale.
The types of properties allowed on
the lien lists have changed over time. Eligibility for the
lien sale depends on the building type, the tax class, the
type of lien that would be sold, and whether the property
has reached thresholds for the amount of time delinquent and
the value of the outstanding debt. In addition to these
criteria, properties owned by certain populations, such as
seniors, veterans, the disabled, and low-income homeowners
can be exempted from inclusion in the lien sale, regardless
of the amount owed. Properties can also be removed from the
process at the discretion of the Department of Housing
Preservation and Development (HPD).
The lien sale program first concentrated on delinquent
property taxes but allowed other charges such as water and
sewer fees to be added on if the property had outstanding
property tax charges as well. Standalone liens for water and
sewer charges were allowed in the lien pool under the
December 31, 2007 reauthorization. In the March 16, 2011
reauthorization, standalone liens for the Emergency Repair
Program (ERP), under which HPD performs repairs on
properties with immediately hazardous violations at the
owner’s expense, also became eligible for inclusion in the
lien pool.
A complex set of rules exists for filling the lien sale lists with appropriate properties, including those that are most likely to repay the delinquency and thus increase the marketability of the bonds which finance the purchase of the lien debt. However, there is nothing to prevent properties that have already had liens sold on them from inclusion in a new lien pool. For the purposes of this analysis, we distinguish between properties with a single lien and properties with multiple liens. A review of the repayment patterns of owners of properties with multiple liens suggests that this is a distinct set of property owners within the lien pools that are less likely to pay their outstanding debts after the liens are sold.
Scope, Data, and Limitations
The primary data used for this analysis are the lien lists created by the Department of Finance (DOF) for the four annual lien sales conducted in 2009 through 2012 and monthly lien servicer reports released by the three third-party servicers hired for these lien pools: MTAG Services, XSPAND, and Tower Capital Management. Repayment was tracked for the 2009-2011 sales by matching the monthly servicer reports to the DOF lien sale lists.3 For the 2009 and 2010 sales, repayment was tracked through February 28, 2013 while repayment for the 2011 sale was tracked through June 30, 2013. Therefore, for the 2009 list we are able to analyze 44 months of repayment (July 2009-February 2013). We analyze 32 months for the 2010 sale (July 2010-February 2013) and 22 months for the 2011 sale (September 2011-June 2013). Given the timing of our research, this study does not include analysis of the repayment of the liens in the 2012, 2013, or 2014 sales.
This analysis only tracks repayment for properties that had liens sold and received bills from the private servicers. It does not include properties that were removed from the lien list by entering into payment plans with the city or that were taken off the list before the sale for some other reason. This analysis will refer to properties with a single lien and properties with multiple liens. Properties with a single lien are those that were involved in only one of the four lien sales in 2009 through 2012, while properties with multiple liens were defined as any property that had a lien sold in the 2012 sale that also had at least one prior lien on a separate delinquency sold in either the 2009, 2010, or 2011 sales.
Changes Between the 90-Day and Sale Lists
On average about 24,300 properties were listed on each of the initial 90-day notification lists for the 2009 through 2012 lien sales. As previously discussed, however, liens on only about 20 percent of those properties were actually sold each year. It appears that properties with smaller debts were more likely to be removed, either because their owners entered into payment plans or were taken off the list for another reason.
During our study period, the number of liens on the 90-day list peaked in 2011, the first year standalone ERP charges were included in the sale; 25,937 properties were listed, of which 5,153 were included in the final sale. The 90-day list in 2012 had the fewest liens with 22,111 properties listed, of which 4,093 were included in the final sale. Despite having the fewest liens listed, the 90-day list for 2012 had the greatest debt outstanding of the four pools studied, $700 million.
While the number of properties on the list decreased by about 80 percent between the initial 90-day list and the lien sale for each year of our study period, there was an average decline of 85 percent in total outstanding debt associated with the properties that went to sale. By the sale date, the total outstanding debt of all properties with liens sold was $85 million in both 2009 and 2010, $106 million in 2011, and $73 million in 2012.
|
About 80 Percent of Properties on the 90-Day List
are Removed Before the Actual Sale |
|||
|
Year |
Number of Properties on 90-Day List |
Number of
Liens Sold |
Percent Sold |
|
2009 |
24,111 |
4,792 |
20% |
|
2010 |
24,963 |
4,736 |
19% |
|
2011 |
25,937 |
5,153 |
20% |
|
2012 |
22,111 |
4,093 |
19% |
|
Year |
Total Owed in 90-Day List |
Total Owed
At Sale |
Percent Owed
At Sale |
|
2009 |
$592 million |
$85 million |
14% |
|
2010 |
$454 million |
$85 million |
19% |
|
2011 |
$654 million |
$106 million |
16% |
|
2012 |
$700 million |
$73 million |
10% |
|
SOURCE: Department of Finance
New York City
Independent Budget Office |
|||
The median value of outstanding debt increased from the 90-day list to the sale list in each of the four years. The higher median values in the sale lists suggest that property owners with smaller outstanding charges are more likely to settle with the city or to have their property removed from the lien list in advance of the sale.
|
The Median
Debt at the Sale Date is Greater than the Median
Debt of All Properties Notified 90 Days Before |
|||
|
Year |
Median Lien Value In 90-Day List |
Median Lien Value at Sale |
Percent Increase From List to Sale |
|
2009 |
$5,867 |
$7,170 |
22% |
|
2010 |
$5,859 |
$8,347 |
42% |
|
2011 |
$8,468 |
$9,100 |
7% |
|
2012 |
$7,399 |
$8,364 |
13% |
|
SOURCE: Department of Finance
New York City
Independent Budget Office |
|||
Characteristics of the Liens in the 2012 Sale
The characteristics of the four observed lien sale lists were found to be generally consistent from year to year in terms of lien type, building type, geography, and occupancy status. Most liens included in the sales are for property taxes, most are on residential and rental properties, and the Bronx and Brooklyn are overrepresented in terms of location. Because of this consistency over the four pools—the one major difference is the inclusion of standalone ERP liens beginning in 2011—we have used the 2012 lien pool sale list to describe the characteristics of properties that have liens sold.
Lien Type. The majority of liens sold were on standalone delinquent property tax charges (62 percent). Standalone water and sewer charges comprised the second largest portion of the pool at 22 percent, while 6 percent of the liens were on standalone ERP charges. The remaining 10 percent of the liens consisted of a combination of charges, such as property tax and water combined, as well as other property-related charges determined by DOF.
Property Type. A majority of the liens, 59 percent, were on residential properties, while 25 percent of the liens were on nonresidential properties, and the remaining 16 percent were on vacant lots. Although the sold liens were predominantly on residential property, there is an overrepresentation of nonresidential properties and vacant lots compared with all taxable lots in the city, where only 9 percent are nonresidential and 3 percent are vacant. Excluding vacant lots, the lien pool was split nearly evenly between properties that are income-producing and those that are not (48 percent to 52 percent, respectively.)4 This is very different from the distribution of all taxable lots citywide where only 17 percent are income-producing.
Location. Brooklyn and the Bronx are overrepresented in the lien sale lists when compared with the distribution of taxable lots citywide, while Queens, Manhattan, and Staten Island are underrepresented. Brooklyn contained the greatest share of the properties on the sale lists at 41 percent while only 30 percent of the city’s taxable lots are in Brooklyn and Queens contained the second highest percentage on the lien lists at 27 percent, compared with its 33 percent share of the city’s taxable lots. In contrast, 16 percent of the liens were on properties in the Bronx (which only has 10 percent of the city’s taxable lots), 10 percent were in Staten Island (which has 13 percent of lots citywide), and 7 percent were in Manhattan (which has 14 percent citywide).
There are geographic concentrations of lien sale properties located in the central and eastern sections of Brooklyn (largely in the neighborhoods of Bushwick, Bedford-Stuyvesant, East Flatbush, and East New York) as well as Southeast Queens. Smaller clusters also exist in northern Manhattan around Harlem, the North Shore of Staten Island, and throughout the Bronx.
Repayment of Liens Sold
More than 60 percent of property owners with liens sold in 2009 through 2011 repaid their debts in full during the repayment periods included in this analysis. Another 9 percent had made some payments but continued to have outstanding balances, and 30 percent had paid nothing. Not surprisingly, more property owners from the 2009 sale had paid in full compared with those from the more recent sales—they had 44 months to make payments during our study period, while those included in the 2010 and 2011 sales had 32 months and 22 months, respectively. Overall, liens on residential buildings were paid in full more often than those on vacant or nonresidential properties, as were standalone water, sewer, and ERP liens when compared with the generally more costly property tax liens. Despite the fact that nearly one-third of property owners had not made any payments at all, during the repayment periods measured, collections equaled 91 percent of the total original lien amount, due to the rapid accumulation of interest on unpaid balances as well as surcharges and other fees.
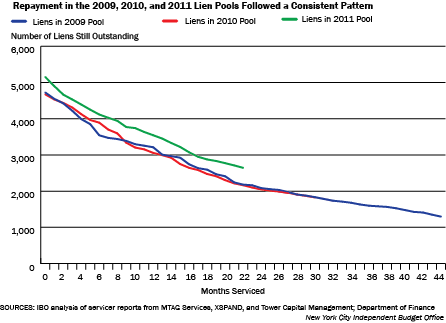
Overall Repayment Trends. Repayment of the three lien pools followed a fairly consistent pattern. The number of liens in repayment with the servicers declined steadily over time, meaning that the number of property owners that had paid their debts in full to the lien servicer grew each month. It took 21 months of billing and repayment for 50 percent of the liens in the 2009 pool to be paid in full. The 2010 lien pool reached this status after 20 months, while the 2011 lien pool had just under half of its liens paid in full after 22 months of repayment (the duration of the repayment period in this study for the 2011 pool).
Forty-four months after the initial sale date, 73 percent of owners with properties in the 2009 lien pool had paid their liens in full, 7 percent had made payments but still owed something, and 21 percent had not made any payments at all. After 22 months of repayment, 49 percent of owners with properties in the 2011 lien pool had paid in full, 10 percent had made some payments, and 41 percent had not paid anything.
With the annual interest rate set at 18 percent, compounded daily, the cost of paying off debt on properties in the lien pool rises quickly. The property owners in the 2009 lien pool who paid in full collectively owed $63 million at the time of the lien sale. During the 44 month repayment period that we studied, interest, surcharges, and fees added to that liability, so that the amount paid by those owners totaled $88 million. On the other end of the spectrum, owners of properties in the 2009 lien pool that made no payments originally owed a total of $14 million, but after 44 months of accruing interest and other charges, the amount they collectively owed more than doubled to $30 million.
Impact of Interest and Fees. The average amount paid by individual property owners rises substantially as time in the repayment process increases. Again, using the 2009 lien pool as an example, the average property owner that paid in full after one year in the repayment process paid an additional 46 percent on top of the original amount owed, while the average property owner that spent two years in the repayment process paid an additional 71 percent, and the average property owner that paid in full after three years paid an additional 83 percent on top of the amount they originally owed.
Cumulatively, owners with properties in the 2009 lien pool who paid their debt in full paid 40 percent more than the original amount they owed in the 44 months after the sale date. Owners with property in the 2011 lien pool who paid their debt in full over the 22 months following the lien sale paid 20 percent more than they originally owed; because they paid more quickly, there was less time for interest to mount up.
Property owners that made no payments at all to the servicer reveal the effect of accumulating interest and fees most dramatically. Cumulatively, owners with properties in the 2009 lien pool who made no payments in the 44 months after the sale date owed 218 percent of the original amount outstanding. Similarly, owners who failed to make any payments on properties in the 2011 lien sale cumulatively owed 132 percent of their original debt 22 months after the sale.
When viewing the 2009 lien pool as a whole, one can see the importance of the interest payments in generating revenue to the lien trust for paying off the bondholders. Despite 21 percent of the properties’ owners having not made any payments, $93 million was collected in the 44 months after the sale—an amount greater than the original delinquency of $84 million and well above the $59 million in bonds sold by the 2009 lien trust.5 Furthermore, while having already collected more than the original amount owed, there was still an additional $40 million outstanding as of February 2013. Similar repayment patterns have occurred in the 2010 and 2011 lien pools, although given the shorter periods of repayment measured, they had yet to collect more than the original delinquent amount by the end of our study period.
|
With Rapidly
Accumulating Interest, More Money Is Collected than
Originally Owed
Dollars in millions |
||||||
|
Paid in Full |
2009 |
2010 |
2011 |
|||
|
44 Months After Sale |
32 Months After Sale |
22 Months After Sale |
||||
|
|
Percent of Original Lien Amount |
|
Percent of Original Lien Amount |
|
Percent of Original Lien Amount |
|
|
Total Original Lien Amount |
$63
|
100% |
$57
|
100% |
$54
|
100% |
|
Total Amount Outstanding |
$0
|
0% |
$0
|
0% |
$0
|
0% |
|
Total Amount Collected |
$88
|
140% |
$75
|
132% |
$65
|
120% |
|
Number of Liens |
3,435 |
73% |
2,958 |
63% |
2,510 |
49% |
|
Still Owe -
Paid Nothing |
|
|
|
|
|
|
|
Total Original Lien Amount |
$14
|
100% |
$17
|
100% |
$38
|
100% |
|
Total Amount Outstanding |
$30
|
218% |
$30
|
180% |
$50
|
132% |
|
Total Amount Collected |
$0
|
0% |
$0
|
0% |
$0
|
0% |
|
Number of Liens |
977 |
21% |
1,271 |
27% |
2,118 |
41% |
|
Still Owe -
Made Payments |
|
|
|
|
|
|
|
Total Original Lien Amount |
$8
|
100% |
$10
|
100% |
$14
|
100% |
|
Total Amount Outstanding |
$10
|
126% |
$9
|
88% |
$10
|
73% |
|
Total Amount Collected |
$6
|
75% |
$8
|
78% |
$8
|
58% |
|
Number of Liens |
318 |
7% |
453 |
10% |
525 |
10% |
|
All Liens
Serviced |
|
|
|
|
|
|
|
Total Original Lien Amount |
$84
|
100% |
$84
|
100% |
$106
|
100% |
|
Total Amount Outstanding |
$40
|
47% |
$39
|
47% |
$60
|
57% |
|
Total Amount Collected |
$93
|
111% |
$83
|
99% |
$73
|
69% |
|
Number of Liens |
4,730 |
100% |
4,682 |
100% |
5,153 |
100% |
|
SOURCES: IBO analysis of servicer reports from MTAG
Services, XSPAND, and Tower Capital Management;
Department of Finance
NOTE: Due to rounding the sum of the parts may not
match the totals exactly and may produce slightly
different percentages.
New York City
Independent Budget Office |
||||||
Repayment by Property Characteristics and Lien Type. Repayment of liens varies by the type of property on which the lien was sold as well as by the type of lien. In each lien pool, owners of residential properties had slightly higher rates of repayment compared with owners of nonresidential properties, while owners of vacant lots had the lowest rates of repayment. Liens on property taxes were paid off at a lower rate than standalone water and sewer liens in all three lien pools as well as ERP liens in the 2011 lien pool—the only pool to include standalone ERP liens. This is likely due to the difference in the value of various lien types. Water and sewer and ERP charges are generally smaller dollar amounts than property tax liens and therefore easier to pay off quickly. Whether or not a property was income-producing did not make a difference in repayment behavior.
Properties Involved in More than One Lien Sale
Properties with multiple liens are defined for this analysis as any property with a lien sold in 2012 that had at least one prior lien on the same property sold between 2009 and 2011. Of the 4,093 liens sold in 2012, 1,769 of them (43 percent) were on properties with one or more liens sold in the recent past; 26 percent of the properties in the 2012 lien pool were involved in one prior lien sale since 2009, 11 percent were involved in two prior lien sales, and 6 percent had liens sold in all three of the prior years. Nonresidential properties were more likely to be involved in multiple lien sales than residential properties. Among residential properties, however, larger rental properties were more likely to be in multiple lien sales than one-, two-, or three-family homes.
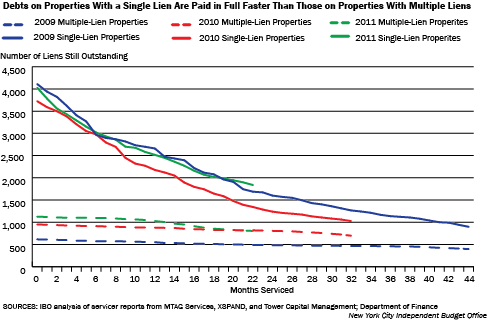
Less Repayment among Properties with Multiple Liens. There is a striking difference in rates of repayment between properties with a single lien and those with multiple liens. In the three lien pools where repayment was measured, properties with multiple liens had a much lower rate of repayment than properties with a single lien. As a result, the number of liens outstanding on properties with a single lien fell steadily over time as owners paid their debts in full, while the number of outstanding liens on properties with multiple liens declined at a considerably slower rate.
In the 2009 lien pool, after 44 months of repayment, 3,209 out of the 4,111 owners of properties with a single lien, or 78 percent, had paid their liens in full. In this same lien pool, only 226 out of the 619 owners of properties with multiple liens, or 37 percent, had paid their liens in full. Of the owners of properties with single liens, 6 percent had made partial payments and 16 percent had not made any payments at all in the 44 months of repayment. Here again the picture is very different for owners of properties with multiple liens, where 12 percent made partial payments and 52 percent made no payments at all.
Big differences in repayments between owners of properties with single and multiple liens can also be seen in the 2010 and 2011 sales. For the 2010 lien pool, after 32 months of repayment, 72 percent of owners of properties with single liens in the 2010 sale had paid in full, but among owners of properties with multiple liens, only 27 percent had paid in full and 61 percent had not made any payments. Similarly, after 22 months of repayment, 54 percent of property owners with one lien in the 2011 pool had paid in full, while only 29 percent of multiple-lien property owners had paid in full and 60 percent had made no payments at all.
SOURCES:
IBO analysis of servicer reports from MTAG Services, XSPAND,
and Tower Capital Management; Department of Finance
NOTE: Graphs show repayment after 44
months for properties in the 2009 lien pool, after 32 months
for properties in the 2010 lien pool, and after 22 months
for properties in the 2011 lien pool.
New York City Independent Budget Office
By the end of the study period, owners of properties with a single lien in the 2009 and 2010 lien pools had paid more than 100 percent of what they originally owed and in the 2011 pool had paid 80 percent. These same property owners with a single lien still had outstanding balances; however , they amounted to less than half of their original debt in each of the three lien pools. Owners of properties with multiple liens, on the other hand, had paid far less than the original amount owed in each of the three lien pools and, in the 2009 and 2010 lien pools, the amount outstanding was more than their original debt.
|
Repayment of Multiple-Lien Properties’ Debts Is Far Behind the
Repayment of the Single-Lien Properties’ Debts
Dollars
in millions |
||||||
|
|
2009 |
2010 |
2011 |
|||
|
44 Months After Sale |
32 Months After Sale |
22 Months After Sale |
||||
|
|
Percent of Original Lien Amount |
|
Percent of Original Lien Amount |
|
Percent of Original Lien Amount |
|
|
Properties With a Single Lien |
|
|
|
|
|
|
|
Total Original Lien Amount |
$72
|
100% |
$64
|
100% |
$72
|
100% |
|
Total Amount Outstanding |
$24
|
34% |
$17
|
27% |
$31
|
43% |
|
Total Amount Collected |
$85
|
119% |
$72
|
112% |
$58
|
80% |
|
Number of Liens |
4,111 |
87% |
3,731 |
80% |
4,027 |
78% |
|
Properties with Multiple Liens |
|
|
|
|
|
|
|
Total Original Lien Amount |
$12
|
100% |
$20
|
100% |
$34
|
100% |
|
Total Amount Outstanding |
$15
|
128% |
$22
|
110% |
$30
|
88% |
|
Total Amount Collected |
$8
|
66% |
$11
|
57% |
$15
|
45% |
|
Number of Liens |
619 |
13% |
951 |
20% |
1,126 |
22% |
|
SOURCES: IBO analysis of servicer reports from MTAG Services, XSPAND, and Tower Capital Management; Department of Finance NOTE: Due to rounding percentages may not reflect the exact calculation of the dollar amounts displayed.
New York City Independent Budget Office
|
||||||
The trend of non-payment by owners of properties with multiple liens generally extends over all of their prior liens. Of properties with multiple liens, 52 percent did not have any payments made on any of their liens during the repayment periods studied. Conversely, 28 percent of the properties with multiple liens had all of their liens paid in full.
Conclusion
The lien sale process has succeeded in encouraging property owners to pay their debt, either by settling with the city before the actual sale or by paying the servicer after the sale. In many cases, after a lien is sold, the servicer, and by extension the city, actually collects a greater amount of money than was originally owed due to interest and fees. However, a significant number of properties have liens sold on them multiple times in a span of a few years. The pattern of repayment is closely related to whether or not a property has had prior liens. While owners of properties with single liens largely pay off in a timely manner, a majority of the liens on multiple-lien properties did not have any payments made on them over a period of up to 44 months after the sale date.
Report prepared by Justin Bland
PDF version available here.
Endnotes
1Through
2010, all properties received an 18 percent annual interest
rate, compounded daily. Beginning with the 2011 lien sale,
the interest rate on properties assessed at or below
$250,000 is 9 percent while for those assessed above
$250,000 the rate remains 18 percent.
2The
servicers charge the same interest rate as the city
repayment plans, including the differential rates based on
assessed value that started with the 2011 lien sale.
3While
every property in the 2011 lien pool was matched to servicer
reports, 1 percent of properties in both the 2009 and 2010
lien pools could not be matched to repayment data. These
properties are excluded from statistics regarding repayment.
4For
this report, income-producing properties are defined to
include rental apartment buildings with four or more units
and commercial properties.
5Once
a lien sale trust has collected sufficient revenue to repay
bondholders and cover its expenses, the remaining revenue is
remitted to the city as residual payments.
Receive notification of free reports by e-mail