
December 2013
PDF version available here.
For the
New Mayor and City Council:
A Big Budget Surplus and Even Bigger
Fiscal Challenges Ahead
Through much of
the summer and early fall, it was asserted with some frequency
that New York’s next Mayor and City Council would inherit a
substantial budget shortfall for the upcoming fiscal year along
with other fiscal challenges. Then in November Mayor Bloomberg
released his quarterly update to the city’s financial plan and a
different story emerged: The Mayor projected a sizable surplus
for the current year as well as a balanced budget for next year,
fiscal year 2015.
Based on IBO’s
most recent economic forecast and tax revenue and spending
projections, the city’s near-term fiscal outlook appears even
stronger than expected by the Bloomberg Administration. Under
the contours of the Mayor’s budget plan, IBO anticipates the
city will end the current fiscal year with a surplus of $2.4
billion, $581 million more than projected by the Bloomberg
Administration. We also project a budget surplus of $1.9 billion
in fiscal year 2015, which starts on July 1, 2014.
But there are a
number of challenges ahead that could quickly erode the city’s
fiscal condition. Largest among these challenges may be the cost
of an eventual settlement with the city’s municipal labor
unions, all of which are working with expired contracts. The
Bloomberg Administration’s financial plan assumes the unions
will settle for no back pay for the years without contracts or
raises. A costless settlement for these prior years remains a
long shot as part of an accord with the unions.
Ensuring the
fiscal integrity of the city’s public housing and public
hospitals in the wake of diminishing federal subsidies and
continued fiscal ills is also likely to strain city resources.
Although the recent budget deal in Washington will lessen some
cuts to federally subsidized programs, there will be pressure to
replace lost federal aid with local funds to avert service
cutbacks. And with a new Mayor and City Council taking office,
there may be considerable expectations from issue advocates and
the broader public for new initiatives from City Hall that could
add to local spending.
U.S. and
Local Economic Outlook
Economic
Overview.
Federal fiscal
policy in 2013—the tax increases that took effect in January and
the cuts to federal government spending under the sequester that
took effect in March—created a drag on U.S. economic growth.
(Unless otherwise noted, in this economic outlook section years
refer to calendar years rather than fiscal years.) In the
absence of further contractionary policies in the coming year,
the drag will abate in 2014. With the Federal Reserve’s (Fed)
maintenance of low interest rates, IBO’s forecast an
acceleration of economic growth—to 2.8 percent growth in real
gross domestic product (GDP) in 2014 and 3.4 percent in 2015.
Even with this growth, the U.S. unemployment rate is not
expected to fall below 6.0 percent until late in 2015.
With the addition
of a projected 75,100 jobs to the New York City economy in 2013,
employment in the city reached a new all-time high. IBO
forecasts somewhat less employment growth in the coming
years—the addition of 67,300 jobs in 2014 and an average of
68,400 new jobs in each of the next three years. However,
increases in wages and earnings in the city have not kept pace
with job growth. The composition of the city’s work force has
shifted, and is expected to shift further, towards lower paying
industries.
U.S.
Economy.
The U.S. economy
has continued to grow in 2013, but the pace has been sluggish in
spite of momentum in the housing market and other conditions
conducive to growth. Economic growth has been constrained by
contractionary fiscal policies that took effect earlier in the
year, and by uncertainty caused by the brinksmanship in
Washington over the federal budget and debt ceiling that
resulted in October’s federal government shutdown. IBO projects
a 1.7 percent increase in the nation’s real gross domestic
product for 2013—far less than the 2.8 percent growth in 2012.
The fiscal drag attributable to this year’s tax increases and
spending cuts will begin to abate in 2014 and IBO expects
consumer spending to increase. Barring external shocks to the
economy, further contractionary fiscal policies or more budget
and debt ceiling brinksmanship in Washington, IBO forecasts
faster real GDP growth in the next two years: 2.8 percent in
2014 and 3.4 percent in 2015.
|
Total Revenue
and Expenditure Projections
Dollars in millions |
|||||
|
|
2014 |
2015 |
2016 |
2017 |
Average Change |
|
Total Revenues |
$73,463 |
$74,574 |
$77,313 |
$80,455 |
3.1% |
|
Total Taxes |
45,688 |
48,267 |
50,862 |
53,371 |
5.3% |
|
Total
Expenditures |
73,463 |
72,683 |
77,019 |
79,017 |
2.5% |
|
IBO Surplus/(Gap) Projections |
$- |
$1,891
|
$294
|
$1,438
|
|
|
Adjusted for
Prepayments and Transfers: |
|
|
|
|
|
|
Total Expenditures |
$74,957 |
$75,133 |
$77,122 |
$79,017 |
1.8% |
|
City-Funded Expenditures |
$53,578 |
$54,903 |
$56,599 |
$57,976 |
2.7% |
|
NOTES: IBO projects a surplus of $2.351 billion for
2014, $581 million above the Bloomberg Administration’s
forecast. The surplus is used to prepay some 2015
expenditures, leaving 2014 with a balanced budget.
Estimates exclude intra-city revenues and expenditures.
City-funded expenditures exclude state, federal and
other categorical grants, and interfund agreement
amounts.
Independent Budget
Office |
|||||
The U.S. economy
has been slow to recover from the Great Recession of 2008 and
2009. By November 2013—after 44 months of near continuous
employment growth—the economy had regained only 85 percent of
the 8.7 million jobs lost over 25 months of contraction. So far
this year (through November), employment has grown by an average
of 189,000 each month, compared with average monthly employment
gains of 179,000 per month during the same period in 2012.
Modest job growth in the private sector coupled with declines in
government employment for much of the period have resulted in
only a gradual decline in the unemployment rate in the last four
years, from 9.9 percent at the recession’s trough (fourth
quarter of 2009) to 7.0 percent in November—still well above the
average 4.6 percent unemployment rate in 2007. Had the labor
force participation rate of the 16-and-over population not
fallen during this period—as discouraged job seekers left the
labor market entirely—there would have been even less of a
decline in the unemployment rate.
The recovery’s
lackluster employment gains and GDP growth have continued even
as conditions favorable to a more robust economic expansion have
been in place for some time. The recession was the start of a
prolonged period of deleveraging by businesses, banks, and
households that strengthened balance sheets. After-tax profit
margins of the corporate sector have reached new highs in the
last few years as businesses have reduced their operating costs.
Banks are also better capitalized than at any point in the last
25 years—the result of more stringent capital requirements in
the wake of the financial crisis and the high profit margins
that low interest rates have enabled.
Since the
beginning of 2012, the household sector’s debt as a percentage
of its disposable (after-tax) income has remained lower than at
any time since 1993. There is considerable pent-up demand for
everything from appliances to cars to homes, much of it coming
from the large number of young adults who during the recession
deferred forming their own households. The improved financial
position of households has stimulated consumer spending,
particularly for autos and other durable goods. Very low
interest rates have increased access to mortgage financing,
stimulated home sales, and finally reversed the long slide in
home prices. As a result, inventories of unsold homes have
declined and housing starts have increased. The improving
housing market and the strength in the stock market have created
a wealth effect that has also boosted spending, especially by
higher income households.
The Federal Reserve’s policy of low interest rates—keeping the federal funds rate on overnight loans between banks near zero and continuing to buy up financial assets to put downward pressure on long-term interest rates (quantitative easing)—has been an essential ingredient of economic growth. Low rates have been vital to the turnaround of the housing market, which had been a major impediment to growth in the aftermath of the Great Recession.
In contrast to
monetary policy, fiscal policy and Congressional brinksmanship
have fanned economic headwinds, substantially reducing GDP
growth in 2013. The elimination of the payroll tax cut and the
increase in marginal tax rates for high-income taxpayers, each
of which took effect on January 1, slowed growth early in the
year. These actions were followed by the previously adopted
across-the-broad spending cuts known as sequestration, which
automatically took effect this March when Congress failed to
agree on a new budget. Later in the year came the extended
negotiations between the Congress and the White House over the
federal budget and debt ceiling, which led to the partial
shutdown of the U.S. government in the first half of October. In
addition to interrupting government operations and pruning
federal contracts with businesses, the shutdown and the
brinksmanship that led up to it undermined consumer confidence.
The Conference Board’s Consumer Confidence Index (a widely used
measure of consumer sentiment) plummeted in October and further
declined in November to reach a seven-month low, negating most
of its rise last spring. The political uncertainty created by
the shutdown has also shaken business confidence and given firms
more reason to postpone hiring and/or to expand capacity.
Despite
unexpectedly strong growth in the third quarter, IBO projects
just 1.7 percent real GDP growth in 2013—the lowest annual rate
since the end of the recession. A spike in inventories—the
highest in three years—accounted for nearly half of the 3.6
percent growth in third quarter GDP. IBO expects much weaker
fourth quarter growth as inventories decline during the holiday
shopping season and as a result of October’s federal government
shutdown. The modest pace of economic growth in 2013 has brought
some improvement in the nation’s unemployment rate, from an
average of 8.1 percent in 2012 to a projected average of 7.4
percent in 2013. Personal income growth, however, has dipped to
a projected 2.9 percent, down from 4.2 percent in 2012. With
unemployment still high, relatively stable oil prices, and slow
growth, the rate of inflation will decline from last year—1.4
percent, compared with 2.1 percent in 2012.
IBO’s forecast
beyond 2013 is premised on no external shocks to the economy,
and no additional harm from fiscal or monetary policy. The
Federal Reserve has indicated that it will continue its
accommodative monetary policy until the unemployment rate falls
below 6.5 percent or inflation appears to be taking hold. Based
on our employment forecast, this suggests that the Fed will
maintain a near-zero federal funds rate through most of 2014.
When the Federal Reserve does decide to wind down its asset
purchases, IBO assumes that it will be able to do so in a slow,
transparent, and orderly fashion—successfully avoiding sudden
spikes in interest rates. Although IBO’s economic forecast was
made before the recent approval of a new federal government
budget, the new agreement is consistent with our assumptions
about fiscal policy. We had assumed that lawmakers in Washington
would avoid another showdown over the federal budget, coming to
an agreement in time to avert the next round of sequestration.
We had also assumed that any new budget agreement would not
substantially change the current stance of fiscal policy,
meaning that any loosening of cuts under sequestration would be
offset by other changes that would leave the total dollar amount
of deficit reduction essentially unchanged. Finally, the
forecast also assumes that there will be no political
brinksmanship when the nation’s debt ceiling needs to be
increased, sometime this spring.
With no new
contractionary fiscal policies being adopted, IBO expects
economic growth to pick up in 2014, as the impact of the 2013
tax increases and spending cuts gradually diminish early in the
year. IBO forecasts 2.8 percent real GDP growth in 2014 and 3.4
percent growth in 2015—the latter growth would be faster than in
any year since 2005. Personal income growth will accelerate from
this year’s modest gain of 2.9 percent to 6.0 percent next year
and 7.0 percent in 2015. Faster growth will bring significant
reduction in the unemployment rate, to an average of 6.7 percent
in 2014 and 6.3 percent in 2015. It also will put upward
pressure on prices. As the unemployment rate approaches the
Fed’s 6.5 percent target—likely towards the end of 2014—we
expect the Fed to gradually increase the federal funds rate in
order to contain inflation. IBO forecasts that the rate of
inflation will remain in the vicinity of 2.5 percent in 2016 and
2017.
IBO expects growth
of both personal income and output to moderate after 2015, with
real GDP growth dipping to 2.9 percent in 2016 and 2017. Despite
slower economic growth, we expect the unemployment rate to
continue its gradual decline, falling below 6.0 percent late in
2015 for the first time since 2008.
Compared with
IBO’s macroeconomic forecast, the Mayor’s Office of Management
and Budget (OMB) projects slightly slower real GDP growth in
both 2014 (2.6 percent versus 2.8 percent for IBO) and 2015 (3.2
percent versus 3.4 percent). In line with a forecast of slower
growth, OMB forecasts higher unemployment than does IBO in 2014
and 2015—7.1 percent and 6.5 percent, respectively, compared
with 6.7 percent and 6.3 percent. With slower growth, OMB also
forecasts lower inflation than IBO in these years–1.5 percent in
2014 and 1.6 percent in 2015. After 2015, the OMB forecast of
real GDP growth remains above 3.0 percent, while IBO’s falls to
2.9 percent in each year.
Risks to the Economic Forecast.
Monetary policy poses a major risk to IBO’s economic outlook.
Unwinding quantitative easing without generating sharp increases
in long-term interest rates will be tricky, as was demonstrated
last summer—interest rates rose when investors (mistakenly)
believed that the Fed was about to reduce its asset purchases.
While the rise in interest rates was temporary and the higher
rates were still quite low by historical standards, it had a
measurable negative impact on consumer spending and home
sales—strength in both these sectors is necessary for more
robust U.S. economic growth.
Another risk is the possibility of a new Congressional showdown over the federal debt ceiling—which looms again in the spring. This would again undermine consumer and business confidence, and potentially trigger another downgrade of U.S. debt. The ability of Congress to come to a timely agreement in recent budget negotiations is a hopeful sign that a showdown can be averted.
IBO’s economic forecast is premised on there being no external
shocks to the U.S. economy, whether from oil prices or economic
disruptions elsewhere in the global economy. Though the current
glut of oil on the market has made the disruption in the supply
of oil less an immediate threat than it has been in recent
years, any sudden increase in the price of oil could greatly
harm economic growth.
A worsening of
economic problems in the European Union countries—which together
make up a substantial share of the global economy and a major
U.S. trading partner—could have a major impact on global trade
and financial markets including those in the U.S. Slow growth or
recession still plagues most European Union countries, and the
current institutional underpinnings of the euro may not be able
to sustain the currency in the long run.
Finally, economic
problems in China, the world’s second largest economy, could
also have a major impact on international trade and finance. The
rapid growth of the Chinese economy in recent years risks
becoming unsustainable, and has resulted in fiscal imbalances
that have only recently been acknowledged. Economic reforms are
on the agenda of Chinese policymakers, but it is not clear if
they can be carried out without major disruptions. Given New
York City’s role as a global financial center, shocks from
financial crises in Europe or China would have a major impact
across all sectors of the city’s economy.
New York
City Economy
New York City’s economic expansion is now four years old, and in that time the city has added 312,000 (corrected number) payroll jobs and established new all-time highs in employment. The job gain is more than double the number of jobs lost during the 2008-2009 crisis and recession. The city’s forward momentum was only briefly interrupted by Hurricane Sandy, and has not been checked (at least in terms of overall jobs growth) by prolonged duress in the city’s financial sector.
IBO forecasts an only slightly diminished pace of growth over
the next four years, with the city economy projected to add
another 67,300 jobs (1.7 percent) in 2014 and an average of
68,400 jobs (1.7 percent) per year from 2015 through 2017.
This forecast incorporates projections for very modest growth in employment and wages in the banking and securities industries, but it is also possible that regulatory changes and other shocks would result in more profound restructuring of the industries.
The strength in
the city’s jobs numbers does not extend to all measures of the
economy. Real per capita personal income has grown by a meagre
2.6 percent per year over the past four years, a markedly poor
performance compared with the 4.5 percent average growth from
2003 through 2007 and the 3.6 percent average from 1996 through
2000 (another period of strong employment growth). The
underlying cause of the lackluster personal income growth is
weak wage and salary growth. Even as city job creation records
are being set, wages have been stagnant: the estimated overall
average wage in 2013 is virtually unchanged in real terms from
2010.
|
Average Wages and Salaries Since 2010 |
|||
|
|
2010 |
2013 |
Percent Change |
|
All Jobs |
$82,382
|
$82,752
|
0.4% |
|
Securities Sector |
376,605
|
342,529
|
-9.0% |
|
Other Finance and
Management |
134,474
|
135,821
|
1.0% |
|
All Other Private |
62,344
|
65,760
|
5.5% |
|
Government |
61,126
|
61,918
|
1.3% |
|
NOTE: In real 2013
dollars.
Independent Budget Office |
|||
Wall Street has
been the major factor behind recent weakness in average wage
growth in New York City, the mirror image of the role the sector
played in prior expansions. Real average wages (including
bonuses) in the securities sector have fallen 9.0 percent over
the last four years, and are languishing almost 22 percent below
their precrisis, 2007 peak. Other financial and management
sector wages have been nearly flat, as have government wages.
But even in the remaining, private nonfinancial portion of the
economy real wage growth has been relatively tepid: only 5.5
percent over three years.
If this seems
discordant with the city’s robust recovery and expansion, one
reason is that, while the city has far surpassed prerecession
levels of employment, it has not returned to prerecession levels
of utilization of those employed. Average weekly hours worked in
the city tumbled in the recession and since then have remained
persistently low. As a result, aggregate hours have grown much
more slowly than employment—and more in line with what we’ve
been seeing in the average wage numbers.
|
Private Sector
Employment and Hours Worked in New York City |
|||
|
Year |
January-October Averages |
||
|
Employment,
thousands |
Weekly Hours |
Aggregate Weekly Hours,
thousands |
|
|
2008 |
3,224.3
|
35.6
|
114,625
|
|
2013 |
3,394.9
|
34.5
|
117,060
|
|
Percent Change |
5.3% |
-3.0% |
2.1% |
|
SOURCE: Bureau of Labor Statistics
NOTE: Hours worked not available for government.
Independent Budget
Office |
|||
IBO projects a
modest uptick in average wage growth and with that, in per
capita personal income growth. The overall average real wage (in
2013 dollars) is expected to rise to about $93,300 in 2017,
enough to propel real per capita personal income growth of 3.5
percent per year over the 2014-2017 period.
|
Projected Average Wages and Changes in Employment by
Industry, 2013-2017 |
||||
|
|
Employment
Change, 2013-2017 |
Average Annual
Change |
Average Wage,
2013 |
Average Wage,
2017 |
|
Total |
272.5
|
1.7% |
$82,752
|
$93,263
|
|
Professional and Business Services |
73.4
|
2.8% |
104,637
|
119,469
|
|
Professional, Scientific, and Technical Services |
34.3
|
2.3% |
122,389
|
146,830
|
|
Administrative and Support Services |
34.2
|
3.9% |
52,302
|
54,226
|
|
Management of Companies and Enterprises |
3.2
|
1.2% |
184,641
|
207,940
|
|
Education and Health Care Services |
68.0
|
2.0% |
52,174
|
60,009
|
|
Health Care Services |
34.2
|
1.9% |
61,525
|
69,209
|
|
Social Assistance |
18.5
|
2.5% |
29,960
|
37,291
|
|
Education |
15.4
|
2.0% |
51,098
|
60,282
|
|
Leisure and Hospitality |
35.3
|
2.3% |
44,033
|
52,556
|
|
Retail Trade |
25.2
|
1.8% |
38,873
|
45,446
|
|
Construction |
18.1
|
3.6% |
78,696
|
87,529
|
|
Information |
15.1
|
2.1% |
119,581
|
126,831
|
|
Financial Activities |
12.0
|
0.7% |
207,030
|
226,497
|
|
Securities, Investments, and Related Activities |
8.6
|
1.3% |
342,529
|
363,490
|
|
Other Services |
10.0
|
1.4% |
49,866
|
57,193
|
|
Government |
8.4
|
0.4% |
61,918
|
70,386
|
|
Wholesale Trade |
7.5
|
1.3% |
90,710
|
108,094
|
|
Transportation and Utilities |
0.2
|
0.0% |
63,218
|
81,452
|
|
Manufacturing |
(0.6) |
-0.2% |
58,805
|
62,087
|
|
NOTE: Employment in thousands. Wages in real 2013
dollars.
Independent Budget Office |
||||
As has been the
pattern in recent years, IBO expects professional and business
services and education and health care services between them to
account for over half of the city’s total projected employment
growth. Next in terms of projected job growth are two industries
that are buoyed by the city’s vibrant tourism industry: leisure
and hospitality (which includes food services, accommodation,
and arts and entertainment) and retail trade. Construction,
which continued to slump for two years after the rest of the
city economy emerged from recession, is projected to be one of
the fastest growing sectors over the next four years, second
only to administrative and support services in terms of average
annual growth. In contrast, financial activities are projected,
along with government, transportation and utilities, and
manufacturing, to be among the slowest growing sectors.
In 2013 a little
over a quarter of the New York City’s payroll workers were in
industries with average industry real wages below $50,000, about
half were in industries with average wages between $50,000 and
$100,000, and a little less than a quarter were in industries
with average wages over $100,000. Job growth has generally been
strongest in the lower-wage industries, and continues to be so
in our forecast. Prior to the last recession, the industries
with the highest average wages also experienced by far the most
rapid growth in average wages during expansions (as well as the
steepest declines in wage growth during contractions). But
during the current expansion beginning in 2009, average wage
growth in the higher wage end of the distribution has markedly
weakened, and has been almost matched by wage growth at the
lower end. As the expansion continues, IBO projects that average
wage growth will rise more rapidly in the lower-wage industries
than in industries with higher wages.
|
Employment and
Wage Growth in Lower-, Medium-, and Higher- Wage
Industries |
||||||
|
|
Annual Employment Growth |
Annual Real Average Wage Growth |
||||
|
Lower Wage |
Medium Wage |
Higher Wage |
Lower Wage |
Medium Wage |
Higher Wage |
|
|
1993-2000 |
3.2% |
0.9% |
2.4% |
1.7% |
1.7% |
5.6% |
|
2000-2003 |
-0.1% |
-1.4% |
-3.8% |
1.0% |
0.9% |
-1.5% |
|
2003-2008 |
2.4% |
0.7% |
2.1% |
0.1% |
0.0% |
4.8% |
|
2008-2010 |
-0.9% |
-2.0% |
-5.9% |
-1.9% |
-0.3% |
-12.9% |
|
2010-2013 |
3.5% |
0.9% |
1.4% |
1.3% |
1.4% |
1.4% |
|
2013-2017f |
2.1% |
1.5% |
1.7% |
4.2% |
3.4% |
2.5% |
|
NOTE: Industries with average real wages under $50,000,
between $50,000 and $100,000, and over $100,000 as of
2013.
Independent Budget Office |
||||||
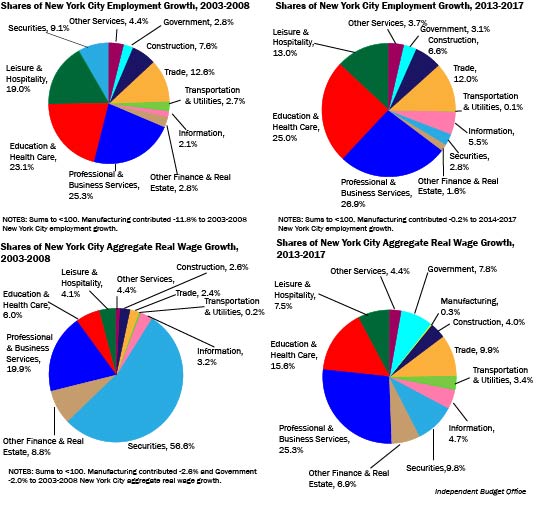
A major factor in
this change is a sharp decline in the contribution of the
securities industry to overall employment and—even more so—wage
growth. This change is not expected to be transient, but has
been ongoing since the recession began and will continue through
2017. Before the recession, from 2003 through 2008, securities
accounted for 9.1 percent of the employment growth in the
city—and a staggering 56.4 percent of the real aggregate wage
growth. From 2013 through 2017, by contrast, the securities
industry is expected to play a smaller but still significant
role in driving the local economy, providing just 2.8 percent of
the employment growth and 9.8 percent of the growth in aggregate
wages.
With slower wage
growth forecast for the securities industry, IBO expects the
shares of wage growth accounted for by other sectors of the
economy to get larger. For example, the professional and
business services industry’s share of wage growth is expected to
increase from 19.9 percent in the 2003 through 2008 period to
27.2 percent in 2013 through 2017; for education and health care
services the share is projected to grow from 6.0 percent to 15.6
percent.
Wall
Street Profits.
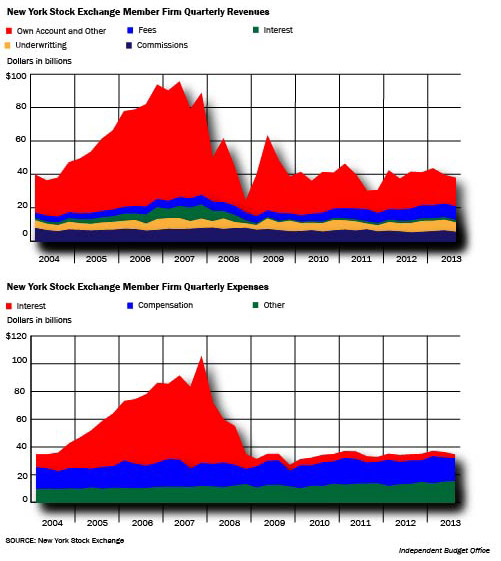
Wall Street
profits—as measured by the broker-dealer profits of member firms
of the New York Stock Exchange—have seen wild swings since the
onset of the financial crises. After losing $11.3 billion in
2007 and $42.6 billion in 2008, the firms had the largest
one-year profit in history in 2009, when the industry as a whole
made $61.4 billion. Profits stood at $23.9 billion in 2012, but
IBO expects profits to fall to $15.4 billion for 2013 as revenue
growth slows to 3.2 percent. Higher interest and compensation
costs in coming years will largely offset gains in revenues,
leaving profits on a relatively slow growth trajectory. IBO’s
forecast is for profits of $15.8 billion in 2014 and they are
expected to reach $17.2 billion by 2017.
This outlook for profits does not seem to reflect the forecast
of sluggish employment and wage growth in the city’s financial
sector. But in recent years broker-dealer profitability has not
been a function of strong revenues—on the contrary, revenues are
still running below half of their prerecession peak. Instead,
the broker-dealer bottom line has been rescued (for now) by much
reduced expenses, primarily resulting from extraordinarily low
interest costs. The latter mostly reflect the near-zero interest
rate policy pursued by the Federal Reserve.
New challenges
will confront Wall Street, and new pressures will be exerted on
industry employment and compensation, as interest rates head
back towards normal, while tightened regulatory constraints are
likely to preclude the kinds of extraordinary revenue gains seen
in the pre-2008 boom. The most recent regulatory change was the
adoption of the so-called Volcker rule, which is intended to
prevent institutions protected by federal deposit insurance from
engaging in proprietary trading. This has been an important
source of profits for banks—albeit with considerable risks. To
the extent banks are forced to shed their proprietary trading
operations this could constrain their revenues and profits. Of
course, if the trading units are spun off as new New York-based
firms, the potential negative effects on local employment,
output, and tax revenue may be reduced.
Real
Estate Markets.
Median sale prices of one- to-three family homes sold outside
Manhattan are up 5.4 percent this year, but prices still remain
about 15 percent below their 2007 peak. That peak may still not
be regained by the end of the forecast period. Conversely, the
coop-condo and residential rental markets have been very strong,
the former fueled by high-end demand from foreign buyers, the
latter by chronic shortages of available units.
There has been a
large year-over-year increase in commercial real estate sales
(and especially high value sales) in 2013, and aggregate
commercial market values have also climbed (up 6.3 percent),
although not as strongly as in recent years. However, average
Manhattan office rents have not budged much, edging up a modest
$1.60 per square foot. Projected growth in office rents is also
relatively subdued, only 2.9 percent per year over the next four
years—barely keeping pace with inflation.
The Unemployment Rate and Labor Force Participation. The city’s strong jobs growth has not produced as large a decline in the unemployment rate as one might expect. Indeed, New York City’s persistently high unemployment rate—still at 8.7 percent as of October 2013—remains a puzzle for those analyzing the city economy. In contrast to the new employment highs achieved in the city, payroll employment in the United States as a whole remains far below the prerecession peak. And yet the national unemployment rate has dropped more than a percentage point below the city’s rate. One potential explanation for the lower U.S. unemployment rate is the steeper decline in labor force participation at the national level.
IBO expects New York City’s unemployment rate to drop rapidly so that by 2016 it will have “caught up” to the declining national rate (6.3 percent). By 2017, the city rate is projected to be down to 5.2 percent—below the nation’s rate.
Risks to the Forecast.
As noted above, in the coming years New York City’s
financial institutions will come under increasing pressure from
rising interest costs and regulatory constraints on revenue
growth. The question is how far this could curtail—or even
reverse—the growth in our forecast. This depends first on how
tightly those pressures grip the financial sector, and second on
the resiliency of the city’s economy if employment and wages in
the financial sector contract. The key to resiliency is
retaining the strengths that have made New York City a magnet
for both millions of highly productive workers and tens of
millions of tourists. Those strengths could also be tested by
external risks related to the city’s position as a world
banking, trade, and tourism center.
|
IBO Versus Mayor’s Office of Management and Budget
Economic Forecasts |
||||||
|
|
2012 |
2013 |
2014 |
2015 |
2016 |
2017 |
|
National Economy |
|
|
|
|
|
|
|
Real GDP Growth |
|
|
|
|
|
|
|
IBO |
2.8 |
1.7 |
2.8 |
3.4 |
2.9 |
2.9 |
|
OMB |
2.8 |
1.6 |
2.6 |
3.2 |
3.1 |
3.1 |
|
Inflation Rate |
|
|
|
|
|
|
|
IBO |
2.1 |
1.4 |
1.8 |
2.2 |
2.5 |
2.5 |
|
OMB |
2.1 |
1.5 |
1.5 |
1.6 |
1.9 |
1.9 |
|
Personal Income Growth |
|
|
|
|
|
|
|
IBO |
4.2 |
2.9 |
6.0 |
7.0 |
6.2 |
5.0 |
|
OMB |
4.2 |
2.7 |
4.7 |
4.8 |
5.1 |
5.3 |
|
Unemployment Rate |
|
|
|
|
|
|
|
IBO |
8.1 |
7.4 |
6.7 |
6.3 |
5.8 |
5.5 |
|
OMB |
8.1 |
7.5 |
7.1 |
6.5 |
6.1 |
5.7 |
|
10-Year Treasury Bond Rate |
|
|
|
|
|
|
|
IBO |
1.8 |
2.4 |
3.3 |
4.2 |
5.0 |
4.9 |
|
OMB |
1.8 |
2.4 |
3.1 |
3.5 |
3.9 |
4.6 |
|
Federal Funds Rate |
|
|
|
|
|
|
|
IBO |
0.1 |
0.1 |
0.1 |
0.7 |
3.0 |
4.0 |
|
OMB |
0.1 |
0.1 |
0.2 |
0.4 |
2.2 |
3.8 |
|
New York City Economy |
|
|
|
|
|
|
|
Nonfarm New Jobs, thousands |
|
|
|
|
|
|
|
IBO |
79.5 |
75.1 |
67.3 |
71.0 |
70.9 |
63.3 |
|
OMB |
80.0 |
73.0 |
48.0 |
47.0 |
51.0 |
50.0 |
|
Nonfarm Employment Growth |
|
|
|
|
|
|
|
IBO |
2.1 |
1.9 |
1.7 |
1.8 |
1.7 |
1.5 |
|
OMB |
2.1 |
1.9 |
1.2 |
1.2 |
1.2 |
1.2 |
|
Inflation Rate (CPI-U-NY) |
|
|
|
|
|
|
|
IBO |
2.0 |
1.8 |
2.2 |
2.8 |
3.0 |
3.0 |
|
OMB |
2.0 |
1.7 |
1.8 |
1.8 |
2.1 |
2.0 |
|
Personal Income, $ billions |
|
|
|
|
|
|
|
IBO |
479.2 |
497.8 |
527.3 |
562.4 |
598.6 |
627.7 |
|
OMB |
466.2 |
474.3 |
494.4 |
513.4 |
535.5 |
561.0 |
|
Personal Income Growth |
|
|
|
|
|
|
|
IBO |
3.7 |
3.9 |
5.9 |
6.6 |
6.4 |
4.9 |
|
OMB |
2.3 |
1.7 |
4.2 |
3.9 |
4.3 |
4.8 |
|
Manhattan Office Rents, $/sq.ft |
|
|
|
|
|
|
|
IBO |
66.7 |
68.3 |
69.6 |
72.1 |
74.6 |
76.7 |
|
OMB |
67.9 |
68.1 |
67.1 |
69.4 |
71.4 |
74.3 |
|
SOURCE: Mayor’s Office of Management and Budget
NOTES: Rates reflect year-over-year percentage changes
except for unemployment, 10-Year Treasury Bond Rate,
Federal Funds Rate, and Manhattan Office Rents. The
local price index for urban consumers (CPI-U-NY) covers
the New York/Northern New Jersey region. Personal income
is nominal.
For 2012, New York City personal income and growth rates
are estimated, pending BEA release.
Independent Budget Office |
||||||
Taxes
and Other Revenues
IBO’s forecast of
revenue from taxes and other sources including state and federal
aid totals $73.5 billion in fiscal year 2014 and $74.6 billion
in 2015, a relatively small increase of only 1.5 percent. But
growth in total revenue next year will be pulled down by the
presence of $1.1 billion in federal assistance for recovery from
Hurricane Sandy in the 2014 budget that is not included in
subsequent years. Without the Sandy aid, total revenue growth
for 2015 would be 3.1 percent.
While total
revenue growth is expected to be tepid from this year to next,
the tax revenue portion of that total is forecast to increase by
$2.6 billion (5.6 percent) to $48.3 billion. In contrast, the
city’s own nontax revenues are projected to fall by $319 million
(-5.0 percent) to $6.1 billion and noncity revenues in 2015 are
expected to be 5.4 percent lower than in 2014, thanks to the
drop in federal grants.
Following 2015,
total revenues are expected to grow in a more typical pattern,
increasing to $77.3 billion in 2016 and $80.5 billion by 2017.
Annual revenue growth will average 3.9 percent in these years,
driven by city taxes, which are forecast to increase at an
average annual rate of 5.2 percent. Growth in noncity revenue
sources is projected to average 2.0 percent annually in 2016 and
2017.
The first part of
this section presents IBO’s tax revenue forecast, followed by a
detailed discussion of each of the city’s major tax sources. It
concludes with a brief overview of the outlook for nontax
revenues.
Tax
Revenue Overview.
IBO’s forecast for
tax revenue in the current fiscal year is $45.7 billion, an
increase of 1.8 percent from 2013. For 2015, IBO projects faster
revenue growth of 5.6 percent to $48.3 billion. Tax revenue
growth in 2014 was slowed by a shift in the timing of capital
gains realizations by taxpayers seeking to lock in the lower
capital gains rates that expired at the end of December 2012,
thereby boosting personal income tax (PIT) revenues for 2013.
Much of the activity that was shifted to 2013 would have
normally occurred in 2014, and as a result PIT revenues are
expected to decline by $654 million (-7.1 percent) this year.
More than offsetting this decline are year-over-year gains from
two of the city’s business income taxes, the property
transaction taxes, and the sales tax. Growth from 2013 to 2014
is expected to be particularly strong in the real property
transfer tax (17.6 percent) and the mortgage recording tax (9.7
percent); although the real property transfer tax grew at a
similar pace last year, the mortgage recording tax increased at
the even faster rate of 38.3 percent.
Much of the
additional tax revenue forecast by IBO for 2015 is expected to
come from the personal income tax—an increase of $898 million
(10.6 percent)—thanks to steady employment growth and strong
personal income growth during calendar years 2014 and 2015, and
from the real property tax, where strong assessment growth,
particularly for multifamily housing and commercial property,
account for much of the $806 million increase (4.1 percent) in
revenue. IBO also expects a robust, 7.7 percent increase in the
business income taxes next year.
For 2016 and 2017,
IBO expects steady tax revenue growth to resume, averaging 5.2
percent annually. Tax revenues are forecast to reach $53.4
billion by 2017. Growth from the personal and business income
taxes, as well as the property tax and the transfer taxes is
expected to remain strong over the two years.
|
IBO Revenue Projections
Dollars in millions |
|||||
|
|
2014 |
2015 |
2016 |
2017 |
Average Change |
|
Tax Revenue |
|
|
|
|
|
|
Property |
$19,757
|
$20,563
|
$21,566
|
$22,613
|
4.6% |
|
Personal Income
|
8,514
|
9,413
|
9,997
|
10,502
|
7.2% |
|
General Sales |
6,468
|
6,775
|
7,096
|
7,394
|
4.6% |
|
General Corporation |
2,846
|
2,931
|
3,094
|
3,258
|
4.6% |
|
Unincorporated Business |
1,946
|
2,117
|
2,310
|
2,478
|
8.4% |
|
Banking Corporation |
1,202
|
1,409
|
1,466
|
1,542
|
8.7% |
|
Real Property Transfer |
1,277
|
1,283
|
1,399
|
1,532
|
6.3% |
|
Mortgage Recording |
814
|
847
|
934
|
990
|
6.7% |
|
Utility |
416
|
443
|
467
|
483
|
5.1% |
|
Hotel Occupancy |
493
|
490
|
517
|
544
|
3.4% |
|
Commercial Rent |
695
|
729
|
750
|
770
|
3.5% |
|
Cigarette |
59
|
58
|
56
|
55
|
-2.5% |
|
Other Taxes, Audits, and PEGs |
1,202
|
1,211
|
1,211
|
1,211
|
0.2% |
|
Total Taxes |
$45,688
|
$48,267
|
$50,862
|
$53,371
|
5.3% |
|
Other Revenue |
|
|
|
|
|
|
STaR Reimbursement |
$844
|
$880
|
$885
|
$889
|
1.7% |
|
Miscellaneous Revenues |
5,566
|
5,211
|
5,058
|
5,168
|
-2.4% |
|
Unrestricted Intergovernmental Aid |
-
|
-
|
-
|
- |
n/a |
|
Disallowances |
(15) |
(15) |
(15) |
(15) |
n/a |
|
Total Other
Revenue |
$6,395
|
$6,076
|
$5,928
|
$6,042
|
-1.9% |
|
Total City-Funded Revenue |
$52,084
|
$54,344
|
$56,790
|
$59,413
|
4.5% |
|
State Categorical Grants |
$11,754
|
$12,013
|
$12,355
|
$12,888
|
3.1% |
|
Federal Categorical Grants |
8,176
|
6,822
|
6,786
|
6,775
|
-6.1% |
|
Other Categorical Aid |
915
|
881
|
869
|
865
|
-1.9% |
|
Interfund Revenues |
534
|
514
|
514
|
514
|
-1.3% |
|
TOTAL Revenues |
$73,463
|
$74,574
|
$77,313
|
$80,455
|
3.1% |
|
NOTES: Estimates exclude intracity revenues. Figures may
not add due to rounding.
Independent
Budget Office |
|||||
The shift of income tax revenue from 2014 to 2013 is a critical
explanation, but the expectation that tax revenue growth will be
slower this year and then accelerate in 2015 is also generally
consistent with IBO’s economic forecast. Strong employment gains
during calendar year 2013 are expected to be followed by a
smaller increase in 2014, but then somewhat larger increases is
2015 and 2016. This same pattern is broadly followed by the tax
revenue forecast.
One thing not found in IBO’s forecast is a projection for double-digit tax revenue growth, something that did occur each year from 2004 through 2007. In the near-term, continued difficulties in the securities industry, including lower aggregate earnings, declines in employment, and an expectation of lower profits will mean less tax revenue generated from Wall Street. IBO expects growth in the securities sector—along with growth in city tax revenues—to remain relatively modest compared with growth during the pre-2008 expansion or even the more recent years of slow recovery. Indeed, the projected annual average growth in total tax revenue over the three years after 2014 is 5.3 percent, significantly lower than the 7.3 percent average over the most recent three-year period after 2010.
Compared with the
city’s revenue forecast when the 2014 budget was adopted last
spring, IBO’s new forecast is $1.2 billion (2.7 percent) higher
for this year and our outlook for 2015 is $1.3 billion (2.8
percent) above the adopted budget estimate. While the strength
in 2014 collections is not entirely surprising—IBO’s estimates
last spring indicated that the city was underestimating 2014
revenues by over $600 million—the local labor market and the
market for real estate have proved to be even stronger than
expected last spring, prompting large upward revisions in our
forecast of the personal income tax, the general corporation
tax, and the real property transfer tax. But in this latest
round of forecasts, IBO has made only modest revisions to our
projections from last spring for 2015 through 2017—in our
forecast of total revenues declined slightly for each year.
IBO’s latest tax
revenue forecast for 2014 is $683 million, or 1.5 percent,
higher than the OMB forecast that accompanied the November 2013
financial plan update. Beginning with 2015, the gap between the
two forecasts grows each year from $1.3 million next year to
$2.5 billion in 2017, but the differences never exceed 1.3
percent of total tax revenues.
Real
Property Tax.
IBO projects that
property tax revenues will grow from $19.8 billion in 2014 to
$20.6 billion in 2015, a 4.1 percent increase. We expect
property tax revenue to grow at an average annual rate of 4.6
percent over the financial plan period.
IBO’s revenue
forecast for 2014 includes $50 million in nonrecurring revenue
from retroactive changes to the coop and condo abatement
program. In January 2013, the state legislature enacted changes
to the abatement program, retroactive to the July 1, 2012 start
of the 2013 fiscal year. The Department of Finance reflected
these changes on 2014 property tax bills beginning in June 2013.
Additionally, the
state is requiring recipients of the School Tax Relief program
(STAR) to register with the state; previously administration of
the program was
handled locally.
City homeowners who receive STAR benefits enjoy a partial
property tax exemption of about $300 a year and the state
reimburses the city for the foregone taxes. The registration
requirement will not affect city tax collections because the
taxes will either be paid by taxpayers or reimbursed by the
state; however, low registration rates (about 60 percent of
recipients registered by December 9, 2013) suggest that city
residents could lose out on roughly $68 million in state
property tax relief.
Background.
The amount of tax owed on real estate in New York City depends
on the type of property, its value for tax purposes (as
calculated by the city’s Department of Finance from estimated
market value), and the applicable tax rate.2 Under
property tax law, there are four tax classes: Class 1,
consisting of one-, two-, and three-family homes; Class 2,
composed of apartment buildings, including cooperatives and
condominiums; Class 3, made up of the real property of utility
companies; and Class 4, comprising all other commercial and
industrial property.
The method of
assessing properties and recognizing market value appreciation
differs by tax class, so each class can have its own assessment
ratio (the share of market value actually subject to tax) and
tax rate. Because of differences in class assessment ratios, the
share of assessed value borne by each class is not proportional
to its share of market value. Class 1 accounts for a much
smaller share of total assessed value than its share of market
value—9.5 percent of assessed value on the 2014 roll compared
with 46.1 percent of the department’s estimate of total market
value in the city. The other classes, especially Classes 3 and
4, bear a disproportionately large share of the property tax
burden because their shares of assessed value are much bigger
than their shares of market value.
Coop and Condo
Abatement.
The coop and condo
abatement provides a reduction in property taxes for owners of
cooperative and condominium units. After having expired on June
30, 2012, the abatement was renewed with significant changes in
January 2013, retroactive to July 1, 2012. The abatement
program’s eligibility criteria were revised to restrict the
abatement to apartments used as primary residences. The renewed
abatement also has a higher percentage of taxes abated for most
owners who remained eligible. IBO has documented shortcomings of
the original abatement: it was supposed to be a temporary first
step toward equalizing tax burdens on apartment owners and
homeowners; it does not address disparities among apartment
owners; and it is inefficient because the abatement provides
more relief than needed to some owners and less to others. Our
analysis
of the most recent changes found that these shortcomings remain.
Due to the retroactive nature of the changes, the Department of
Finance is recouping coop and condo benefits granted in 2013 to
owners whose apartments are not their primary residences and
therefore no longer eligible for the tax break. Although the
abatement expired at the start of 2013, the finance department,
assuming a retroactive extension would be enacted, decided to
leave the abatement unchanged on 2013 property tax bills.
Because the abatement was instead revised to reduce benefits for
nonresident owners for 2013, the department is seeking to recoup
those benefits by adding to property tax bills in 2014. Rather
than adding the charge as a lump sum at the beginning of the
year, the finance department has spread out the additional tax
for 2013 across all the bills for 2014.
According to finance department tax billing data, roughly $67
million in abatement benefits for 2013 will be billed in 2014.
The city has already collected $12 million in 2013 (from bills
mailed in June and paid before July 1, 2013) and another $27
million so far this year. IBO expects that $50 million will be
collected this year (this estimate allows for some nonpayment).
While the city has not yet reflected this additional 2014
revenue in the financial plan, IBO’s estimate of 2014 property
tax revenue has increased to reflect the revenue we expect the
city to recoup over the year.
Finance department
data show that the modified abatement will cost the city about
$400 million in foregone property tax revenue in 2014, which is
the amount reflected in the IBO forecast for this year. IBO
expects the cost to decrease to $370 million in 2015 as the
changes are fully phased in. Our estimates are significantly
lower than what the Mayor’s financial plan assumes the program
will cost the city by about $50 million in 2014 and $80 million
in 2015. Although the abatement was only extended through 2015,
our forecast assumes it is continued in 2016 and 2017 without
further changes.
Assessment Roll
for 2015.
IBO projects that
when the tentative assessment roll for 2015 is released in
January 2014, it will report 5.2 percent growth in market values
in the city. Assessed value for tax purposes is forecast to grow
by 4.6 percent in 2015.
Class 1: The
aggregate market value of Class 1 properties is expected to grow
4.2 percent in 2015. This growth is stronger than in the past
six years (four of which saw declining market value), although
Class 1 market value in 2015 is projected to remain below the
peak recorded in 2008. The growth reflects an increase in the
median sale price for Class 1 homes in calendar year 2013. The
median sale price of one-, two- and three-family homes outside
Manhattan in the first three quarters of 2013 was $465,000
compared with a median of $440,000 in the first three quarters
of 2012.
IBO projects
assessed value for tax purposes in 2015 will increase by 3.0
percent over 2014. In Class 1, the assessed value of a property
moves toward a target of 6.0 percent of market value, with
assessment increases capped at 6.0 percent a year or 20 percent
over five years. If a parcel is assessed at less than 6 percent
of market value, its assessed value will grow each year until it
hits the target ratio of 6.0 percent of market value or it
reaches the cap on annual assessment increases—even if the
market value stays flat or declines compared with the prior
year. When the housing market was strong, the median ratio for
one-family homes outside Manhattan declined, from 5.4 percent in
2004 to a low of 3.7 percent in 2008, well below the 6 percent
target. More recently, the median assessment ratio has
increased, rising from 4.0 percent in 2009 to 5.4 percent in
2014.
Class 2 and Class
4: IBO projects that on the final roll for 2015, aggregate
market value for all properties in Class 2 will total $215.1
billion, a 6.2 percent increase over 2014. The Class 2 increase
is higher than in recent years, stemming from strong projected
growth in market values across all property types in the class.
Class 4 aggregate market value is expected to reach $248.8
billion, a 6.3 percent increase over 2014. This growth is
slightly slower than in recent years; annual market value
increases in Class 4 averaged 7.3 percent from 2011 through
2014.
Aggregate assessed value for tax purposes for Class 2 is
expected to be $60.9 billion, 3.4 percent higher than 2014, and
$89.2 billion for Class 4, a year-over-year increase of 5.7
percent. This projected growth in 2015 is lower than annual
growth for Classes 2 and 4 from 2006 through 2014, which
averaged 5.4 percent and 6.6 percent, respectively.
This stable growth
in assessed value for tax purposes is due in part to the method
for translating market value changes into assessed value for tax
purposes. Increases and—in many cases—decreases in parcels’
market values are phased in over five years. The assessed value
changes from the preceding four years that have yet to be
recognized on the tax roll are called the pipeline. Strong
growth in assessed value in recent years, especially in Class 4,
has replenished the pipeline, which had begun to shrink due to
slow growth in the preceding years. IBO projects that the
pipeline will reach $16.5 billion in 2015, up sharply from $6.6
billion in 2011.
Outlook for Market and Assessed Values in 2016 and 2017.
For 2016, IBO forecasts an increase in aggregate market value of
4.7 percent. Growth in market value is projected at 3.2 percent
in Class 1, 5.8 percent in Class 2, and 6.2 percent Class 4.
Class 1 growth slows a bit in 2017, forecast at 2.5 percent,
while Class 2 and Class 4 are projected to grow by 5.9 percent
and 6.2 percent, respectively.
IBO projects that aggregate assessed value for tax purposes will
grow 5.1 percent in 2016 and 5.0 percent in 2017, slightly
faster than in 2015. Class 1 assessed value for tax purposes is
expected to grow by 2.8 percent in both years. With the pipeline
replenished, growth of assessed value for tax purposes in both
Classes 2 and 4 is strong through 2017, especially in Class 4.
Assessed value for tax purposes in Class 2 will grow 3.2 percent
in 2016 and 3.7 percent in 2017. The Class 2 pipeline, estimated
at $5.3 billion following the 2014 final roll, is expected to
grow to $6.3 billion by 2017. With an even larger pipeline,
Class 4 growth in assessed value for tax purposes will be even
stronger, averaging 6.5 percent a year through 2017. IBO
estimates that the Class 4 pipeline was $9.4 billion after the
2014 roll was finalized, and will grow to $11.7 billion by 2017.
Revenue Outlook.
The
Department of Finance is responsible for finalizing the
assessment roll, while the actual property tax levy is
determined by the City Council when it sets the tax rates for
each class. IBO’s baseline property tax revenue forecast and the
Bloomberg Administration’s forecast both assume that the average
tax rate during the forecast period will remain at 12.28
percent, the rate set by the City Council in December 2008 when
the Council enacted the Mayor’s proposal to rescind a
short-lived 7.0 percent rate reduction.
The amount of
property tax revenue in a fiscal year is determined not only by
the levy, but also by the delinquency rate, abatements granted,
refunds for disputed assessments, and collections from prior
years. Taking these other factors into account, IBO projects
that property tax revenue for 2014 will total $19.8 billion, 5.4
percent higher than in 2013. For 2015, IBO forecasts property
tax revenue of $20.6 billion. From 2015 through 2017, revenue
growth is projected to average 4.9 percent a year, reaching
$22.6 billion by the last year of the forecast period. This
projected revenue growth is slower than the 6.3 percent average
annual growth seen from 2007 (before the most recent property
tax rate decrease and increase) through 2013.
IBO’s property tax
revenue forecast is $147 million above OMB’s for 2014, stemming
primarily from differences in estimating the savings from
changes to the coop and condo abatement program and estimates of
prior year collections. In 2015 through 2017, IBO forecasts
somewhat stronger market value growth than OMB, and our revenue
forecast is respectively $236 million, $308 million, and $587
million above OMB’s.
Real
Estate Transfer Taxes.
Revenues from the real property transfer tax (RPTT) and the
mortgage recording tax (MRT)—collectively referred to as the
transfer taxes—have rebounded strongly since 2010, when in the
wake of the financial crisis they bottomed out
at $981 million (a 70.2
percent drop from their 2007 peak). For 2014, IBO
forecasts a total of $2.1 billion in revenues from the two
taxes, growing to $2.5 billion in 2017—still about 25 percent
below the 2007 peak of $3.3 billion.
Because the RPTT
and MRT are based on a certain percentage of real property sales
and mortgages, respectively, the recovery of real estate markets
since the recession have boosted transfer tax revenue. Taxable
sales of residential properties soared to $12.5 billion during
the first quarter of this fiscal year, the highest level since
the July-September 2007 quarter. The increase in sales activity
occurred in all five boroughs, although Manhattan continued to
account for the majority of sales value with 59.7 percent in the
quarter.
After a spike in
commercial real estate sales at the end of calendar year 2012,
when buyers and sellers rushed to complete transactions in
anticipation of higher capital gains tax rates taking effect in
January 2013, taxable commercial sales fell by over 60 percent
to $5.9 billion in the April to June quarter of 2013. Sales then
rebounded in the July to September quarter (the first quarter of
the 2014 fiscal year), to $10.4 billion. There have been 41
taxable commercial sales valued at more than $100 million in the
first five months of this fiscal year compared with 24 during
the same period of 2013. Five of these sales were valued at over
$500 million compared with just two during the same period last
year. The largest transaction so far this year has been the $1.3
billion sale of 650 Madison Avenue, recorded in October—the
highest-value taxable transaction in the city since December
2010.
In response to the
strength of collections so far this fiscal year, IBO has raised
its 2014 forecast of RPTT revenue by $169 million over our May
2013 projection, to slightly under $1.3 billion—on a
year-over-year basis, revenue is now expected to grow by 17.6
percent in 2014. Our forecast for 2015 through 2017 is
essentially unchanged since May, with growth moderating to an
annual average of 6.3 percent. By 2017, RPTT revenues are
forecast to be $1.5 billion, roughly 90 percent of their 2007
peak.
The MRT does not
track the value of real estate sales as closely as does the RPTT
because not all sales involve a mortgage and new taxable
mortgages need not involve a sale. All-cash sales are common in
the city’s luxury housing market, both among U.S. residents and
the foreign buyers who account for a significant share of
high-end residential purchases. The latter are in many cases not
able to obtain financing locally and, if they borrow overseas,
there is no mortgage recorded in the city and therefore no MRT
liability. In addition to mortgage activity related to property
purchases, the MRT can be triggered in some mortgage
refinancings–it is levied on the portion that involves new money
(“cash out”) and also in cases where there is a new lender and
the original lender does not assign the note. MRT collections in
recent years have been boosted by the large volume of
refinancing activity that historically low mortgage interest
rates have induced.
As we did with our
forecast for RPPT collections, IBO has increased its forecast
for 2014 MRT revenue since last spring. MRT revenue this year is
now expected to be $814 million, $72 million (9.7 percent) over
2013 revenue. Even though mortgage rates remain at very low
rates by historic standards, credit standards are more stringent
than during the real estate boom of the previous decade, and it
is likely that most mortgage holders who would benefit from
refinancing and are able to access credit have already
refinanced. The Mortgage Bankers Association has also reported a
decline in refinancing activity in recent months. For these
reasons, IBO forecasts slower MRT growth in 2015 of 4.1 percent,
with revenues of $847 million. After 2015, annual average growth
of 8.1 percent is projected, with MRT collections reaching $990
million in 2017—still 37 percent below the peak a decade
earlier.
Differences between IBO’s and OMB’s forecasts of the transfer
taxes are relatively small. IBO’s projections for the RPTT are
slightly above those of OMB in each year—by 1.3 percent for the
entire forecast period. IBO’s mortgage recording tax projections
are slightly below OMB’s in 2014 and 2017, and higher in 2015
and 2016. For the entire 2014-2017 period, our MRT forecast is
0.9 percent above OMB’s.
Personal
Income Tax.
In contrast to most of New York City’s other major sources of
tax revenue, net collections (gross collections minus refunds)
from the personal income tax (PIT) are expected to decline this
year. IBO forecasts $8.5 billion of PIT revenue this year, $654
million less than what was generated in 2013. The drop in
revenue is the consequence of federal fiscal policy rather than
declines in the income and/or employment of city residents. In
anticipation of expected increases in federal income tax rates,
particularly rates on capital gains income, many taxpayers
shifted capital gains and salary bonuses from calendar year 2013
to 2012, boosting fiscal year 2013 PIT receipts at the expense
of receipts in 2014. As a result, PIT revenue growth is expected
to be uneven, with a 15.3 percent increase in 2013 followed by a
projected 7.1 percent decline this year and then a projected
10.6 percent increase in 2015.
The shift of capital gains realizations into
2013 swelled estimated payments, which are made by taxpayers who
are self-employed or anticipate realizing capital gains from the
sale of financial and property assets, along with those filing
for extensions to delay the deadline for final returns past
April 15th. IBO’s projection of a 26.9 percent
decline in estimated payments in 2014 is the major reason for
our forecast of a decrease in total PIT revenue. Another
contributing factor is an expected 8.9 percent increase in
refunds this year.
In contrast, withholding payments—the single largest component
of PIT receipts—are expected to show modest growth in 2014.
Fueled by job growth over the past year, year-to-date (through
November) withholdings are up 4.5 percent over the same period
in 2013. With a decline in Wall Street profitability expected
for calendar year 2013, however, we expect bonus compensation
from securities firms to be less than bonuses paid out of
profits in calendar year 2012. As a result, withholdings during
the all-important December through March bonus season will be
substantially less than withholdings in the same period in
2013.Consequently, withholding growth for the year as a whole
will be constrained to a relatively modest 3.2 percent.
IBO’s 2015 PIT
forecast is $9.4 billion—10.6 percent higher than we project for
2014. Withholding growth is expected to remain moderate,
reflecting slightly slower employment gains in calendar year
2014 relative to the two previous years. However, PIT growth
will be fueled by a projected 32.1 increase in estimated
payments as capital gains realizations rebound.
With IBO expecting
personal income growth to peak in calendar years 2015 and 2016,
we project that PIT revenues will increase at an annual average
rate of 5.6 percent in 2016 and 2017—faster than the annual
average rate of 1.3 percent in 2014 and 2015. PIT revenue is
forecast to reach $10.5 billion by 2017, 20.0 percent higher
than the previous revenue peak in 2008, before the Great
Recession.
IBO projects
faster city income and employment growth in its economic outlook
than does OMB throughout the forecast period, and as a result
IBO’s personal income tax forecast exceeds OMB’s each year
through 2017, with the difference between the two forecasts
growing over time. For the current year, our forecast is $190
million (2.3 percent) above OMB’s and for 2015 the difference
rises to $368 million (4.1 percent). Combined 2016 and 2017
revenue is 7.2 percent higher in the IBO forecast than in OMB’s.
Business Income
Taxes.
After stronger than anticipated revenue growth in 2013 (9.2
percent) from the city’s three business income taxes, combined
collections to date in 2014 (through October) are essentially
flat (-0.4 percent) compared with the same period a year before.
For the remainder of 2014, IBO forecasts only slightly faster
growth, resulting in a very modest increase of 2.3 percent in
business income tax revenue for the year as a whole. The
expected change in revenue varies among the three taxes. In
2014, collections of the general corporation tax (GCT) and the
unincorporated business tax (UBT) are projected to exceed 2013
revenues by 5.7 percent and 7.6 percent, respectively. Banking
corporation tax (BCT) revenues, however, are forecast to decline
11.5 percent this year. For 2015, IBO expects more robust growth
of 7.7 percent in the combined business income taxes, with all
three taxes contributing to the increase.
IBO’s general
corporation tax forecast is $2.8 billion for 2014—5.7 percent
($154 million) greater than revenue in 2013. Through October,
GCT collections for 2014 are up $72 million (15.3 percent) over
the same period last year. Data on current-year payments from
large taxpayers (those with payments of $1 million or more)
indicate that much of the growth so far has come from firms in
finance and insurance (up 64.9 percent) and manufacturers (up
135.8 percent). In contrast, collections from large information
firms were down 60.8 percent. GCT collections this year are
being boosted by the $23.9 billion in profits Wall Street firms
enjoyed in calendar year 2012—the third highest level on record.
Relatively strong Wall Street profits in calendar year
2013—$13.5 billion through the third quarter of the year—will
also bolster GCT revenue in 2014 and 2015. But securities firms’
interest and compensation expenses are projected to increase
starting late in calendar year 2014, reducing Wall Street
profits and slowing the increase in GCT revenue to 3.0 percent
in fiscal year 2015. For 2016 and 2017, IBO projects that GCT
collections will grow at an average annual rate of 5.4 percent.
UBT revenue
growth is expected to exceed that of the other two business
taxes over the entire forecast period, due in large part to
robust growth in the professional and business services
industry, which added 44,000 jobs from 2010 through 2012 and is
expected to add another 18,500 jobs in calendar year 2013. For
2014, IBO forecasts $1.9 billion in UBT revenue—$138 million
(7.6 percent) greater than 2013 collections—which would bring
UBT collections to $94 million above their 2008 prerecession
peak. September and October collections are up $41 million (11.9
percent), compared with the same period last year, but growth is
expected to slow in the remainder of the fiscal year. With both
the local and national economies gaining momentum in calendar
year 2014, IBO anticipates even faster UBT revenue growth next
year and beyond: 8.8 percent in 2015 and an average annual rate
of 8.2 percent in 2016 and 2017, when UBT revenue reaches $2.5
billion.
The bank tax is
the city’s most volatile major source of revenue, with strong
revenue growth in one year often followed by a steep decline the
following year. The bank tax’s volatility is primarily due to
very large fluctuations in refunds resulting from overpayments
of estimated liabilities made throughout the fiscal
year—overpayments often affected by the timing of deductions for
net operating losses. Through October, BCT collections for the
current fiscal year are $118 million (28.4 percent) less than
during the same period last year, a revenue decline completely
offsetting the combined growth of GCT and UBT revenue so far
this year. For 2014 as a whole, IBO forecasts that BCT revenue
will fall by 11.5 percent to $1.2 billion, and then rebound,
increasing 17.2 percent to reach $1.4 billion in 2015. Following
the sharp rise in 2015 collections, IBO expects BCT growth in
2016 and 2017 to average a more moderate 4.6 percent a year.
There are
several reasons to expect BCT revenue growth to slow in the
coming years. Rising interest rates will increase to cost of
obtaining funds and thereby take a toll on bank profits. Many of
the recent settlements between large banks and the U.S.
government over practices leading up to the 2008 financial
crisis include payments by the banks. To the extent these
payments are tax deductible, they lower banks’ taxable income,
thereby shrinking BCT collections. Instituting Dodd-Frank
regulations, including the just-adopted Volcker Rule, is also
expected to take a toll on BCT collections by limiting some
activities by banks, including highly lucrative (and potentially
risky) proprietary trading. The still high standards for issuing
small business loans will also limit potential bank profits.
IBO’s forecast
for the combined business income tax revenue is $218 million
(3.8 percent) higher than OMB’s in the current year—$231 million
higher for GCT, $101 million lower for BCT and $88 million
higher for UBT. For 2015, IBO’s forecast is a total of $467
million above OMB’s—$174 million higher for GCT, $214 million
higher for UBT, and $79 million higher BCT. The difference
between the two forecasts grows each year and reaches $824
million in 2017, reflecting IBO’s forecast of faster employment
and productivity growth.
General Sales Tax.
IBO
forecasts relatively steady growth in general sales tax revenue
for 2014 and subsequent years. For the current year, revenue is
expected to total $6.5 billion, a 5.5 percent increase over the
prior year—matching the growth rate in 2013. For 2015, IBO
projects $6.8 billion in revenue, a gain of 4.7 percent over
2014. In the following two years the sales tax is expected to
grow at an annual average rate of 4.5 percent, to $7.4 billion
in 2017.
Through October,
collections of the city’s general sales tax this year are 7.0
percent greater than during the same period in 2013. Nominal
personal income growth of city residents has been a moderate 3.7
percent this calendar year, so it is likely that much of the
recent sales tax growth is attributable to nonresidents,
especially tourists and business travelers. The latest estimates
indicate that New York City had a record number of visitors in
calendar year 2013, and there are many other indications—such as
increases in the number of hotel stays, rising hotel room rates,
and large increases in restaurant employment—that visitor
spending has had an especially large role in increasing sales
tax revenue. (Hotel bills are subject to sales tax, in addition
to a separate tax on hotel occupancy.)
Beyond the
current year, IBO expects that somewhat slower increases in
visitor spending will be largely offset by faster growth in
residents’ personal income. Personal income is projected to grow
3.7 percent in calendar year 2013 with growth accelerating to
6.1 percent in 2014 and remaining above 6 percent in 2015 and
2016. Steady employment growth in the city will also stimulate
consumer demand and retail sales, thereby fueling sales tax
growth.
IBO projects
substantially higher employment and personal income than does
OMB over the forecast period. As a result, IBO’s sales tax
forecast exceeds OMB’s by $98 million (1.6 percent) in 2014 and
in subsequent years by increasing amounts, reaching $302 million
(4.3 percent) in 2017.
Hotel
Occupancy Tax.
In spite of another year in which a record number of visitors
came to New York, IBO forecasts a 2.4 percent decline in hotel
tax revenue this fiscal year, to $493 million, followed by
another, smaller decline to $490 million in 2015. The reason IBO
expects hotel tax revenue to decline is that the hotel tax rate
reverted to 5.0 percent on December 1, 2013, after having been
5.875 percent since March 1, 2009. As of this writing it is not
clear whether the City Council will act to renew the higher rate
and whether renewal could be made retroactive to December 1st
as city officials hope. For now IBO assumes the rate will remain
at 5.0 percent through at least 2017. The rate change reduces
annual revenue by about $40 million in the remaining months of
2014 and by roughly $80 million annually starting in 2015.
Hotel tax
revenue is a function of the tax rate, the number of hotel
stays, and room rates. The outlook for growth in the hotel tax
base is strong in both the short run and long run. Data from NYC
& Company show that for January through September 2013, average
daily hotel rates were up 4.2 percent over the same period in
2012, while occupancy rates through September reached 88.1
percent, compared with 86.6 percent during the same period in
2012. The recent increase in occupancy rates is particularly
noteworthy given that, according to NYC & Company, the number of
New York City hotel rooms has grown steadily—by 2.6 percent in
calendar year 2012 and by a projected 6.5 percent in 2013.
In the longer
run, IBO expects increases in hotel tax revenue to average 5.4
percent a year from 2015 through 2017, with revenue reaching
$544 million by 2017. These increases are driven by a
combination of further increases in room rates and stable rates
of occupancy despite increasing inventory, which is projected by
NYC & Company to reach 110,000 rooms in 2016—up from 93,000
thousand in 2012. One potential upside to IBO’s forecast is
revenue that could come from the city’s efforts to collect the
tax from online short-term rentals, such as those arranged
through Airbnb. At present our forecast does not assume any new
revenue from this initiative.
Though IBO
forecasts faster growth in the tax base, for all years of the
forecast OMB’s projections of the hotel tax are between 5
percent and 9 percent higher than IBO’s due to their expectation
that the higher tax rate of 5.875 percent would be in effect
throughout the entire forecast period.
Other
Revenues.
The city’s
nontax revenues combine a variety of fees, fines, charges,
interest income, and other miscellaneous revenue, which total
$6.4 billion this year. The Mayor’s November financial plan
anticipates that nontax revenues will fall to $6.1 billion next
year, a decline of $319 million, with much of the difference due
to anticipation of the sale of city assets in 2014 to bring in
$275 million. The estimate for both 2014 and 2015 were revised
upwards in November by $64 million and $81 million,
respectively, as revenue from the sale of new taxi medallions—an
initiative that had been delayed by court challenges but is now
proceeding—has exceeded expectations. Plans to continue selling
medallions in subsequent years help to sustain total city nontax
revenues at $5.9 billion in 2016 and $6.0 billion in 2017.
|
Pricing Differences Between IBO and the Bloomberg
Administration
Items that Affect the Gap
Dollars in millions |
||||
|
|
2014 |
2015 |
2016 |
2017 |
|
Gaps as Estimated by the Mayor |
- |
- |
$(1,472) |
$(951) |
|
Revenues |
|
|
|
|
|
Taxes |
|
|
|
|
|
Property |
$147
|
$236
|
$308
|
$587
|
|
Personal Income |
190
|
368
|
600
|
779
|
|
General Sales |
98
|
185
|
267
|
302
|
|
General Corporation |
231
|
174
|
228
|
235
|
|
Unincorporated Business |
88
|
214
|
363
|
422
|
|
Banking Corporation |
(101) |
79
|
126
|
167
|
|
Real Property Transfer |
24
|
17
|
12
|
17
|
|
Mortgage Recording |
(6) |
19
|
28
|
(10) |
|
Utility |
26
|
38
|
48
|
60
|
|
Hotel Occupancy |
(28) |
(46) |
(43) |
(32) |
|
Commercial Rent |
16
|
14
|
5
|
(8) |
|
Cigarette |
(1) |
(4) |
(4) |
(4) |
|
|
$683
|
$1,292
|
$1,937
|
$2,514
|
|
STaR Reimbursement |
8
|
8
|
8
|
8
|
|
Total Revenues |
$692
|
$1,300
|
$1,944
|
$2,522
|
|
Expenditures |
|
|
|
|
|
Fringe Benefits: |
|
|
|
|
|
Health Insurance - Education |
$(6) |
$55
|
$(12) |
$21
|
|
Health Insurance - City University |
(29) |
(6) |
(19) |
(29) |
|
Health Insurance - All Other Agencies |
(22) |
5
|
(82) |
(49) |
|
Education |
(65) |
(21) |
(41) |
(51) |
|
Public Assistance |
45
|
46
|
46
|
46
|
|
Police |
(25) |
(25) |
(25) |
(25) |
|
Homeless Services |
(19) |
(25) |
(25) |
(25) |
|
Corrections |
-
|
(15) |
(15) |
(15) |
|
Small Business Services |
10
|
(4) |
(6) |
(6) |
|
Total Expenditures |
$(111) |
$10
|
$(179) |
$(133) |
|
Total IBO Pricing Differences |
$581
|
$1,310
|
$1,765
|
$2,389
|
|
IBO Prepayment Adjustment 2014/2015 |
(581) |
581
|
-
|
-
|
|
IBO Surplus/(Gap) Projections |
$- |
$1,891
|
$294
|
$1,438
|
|
NOTES: Negative pricing differences (in parentheses)
widen the gaps, while positive pricing differences
narrow the gaps. Figures may not add due to rounding.
Independent Budget
Office |
||||
State, federal,
and other categorical aid and interfund revenue are the
remaining sources among nontax revenues. They are expected to
total $21.4 billion this year, although that figure includes
$1.1 billion in anticipated Hurricane Sandy assistance from the
federal government. The bulk of that money has been allocated
through the federal government’s Community Development Block
Grant process to help in the recovery and is scheduled to be
spent this year, which accounts for the drop-off in this revenue
category to $20.2 billion in 2015. The city is counting on an
additional $1.4 billion in federal rebuilding assistance but has
not yet included the money in the financial plan pending release
of the funds from Washington. After 2015, state, federal, and
other categorical and interfund revenues resume growing at a
slower pace; annual growth is expected to average 2.0 percent in
2016 and 2017. By the last year of the financial plan, these
grants are expected to total $21.0 billion.
Spending
While IBO
expects city tax revenues will exceed the Bloomberg
Administration’s projections by nearly $700 million this year
and $1.3 billion next year, our estimates for spending under the
Mayor’s budget plan reveal only modest differences. For the
first time since 2008, the Mayor’s budget plan includes no
spending cuts under a program to eliminate the gap, or PEG.
Although the budget plan restores much of the funds that had
been part of the annual “budget dance” between the Council and
the Mayor and provides for new needs such as $47 million for
fire department staffing, IBO anticipates overall city spending
will remain relatively flat for most agencies. However, this is
largely an artifact of the collective bargaining situation. Once
a labor settlement is reached, funds will be allocated to
agencies to cover the new labor costs and agency spending growth
will look more robust.
Under the terms
of Mayor Bloomberg’s financial plan for fiscal years 2014
through 2017, IBO estimates that total city spending—including
state and federal aid and adjusting for the use of last year’s
surplus to prepay some of this year’s expenses—will grow from
just over $75 billion this year to about $79 billion in 2017, an
average annual increase of 1.8 percent. Looking just at
city-funded expenses, we estimate spending will rise from $53.6
billion in 2014 to just under $58.0 billion in 2017—an average
annual growth rate of 2.7 percent, or about half the average
annual rate of growth we project for tax revenue.
Engines of
Spending Growth.
As in much of
the past decade, just a few portions of the budget account for
much of the growth in city spending. The key factors are
spending on education, health insurance and other fringe
benefits for city employees and retirees, and debt service on
the funds the city borrows for construction projects and major
purchases such as vehicles and equipment. Spending in each of
these areas is projected to increase by more than $1 billion
over the 2014-2017 period.
Under the
Bloomberg Administration’s financial plan, IBO projects that the
biggest increase in spending—both in dollar terms and in terms
of average growth rates—will be for debt service. After
adjusting for the use of this year’s projected surplus to prepay
some of next year’s debt service, spending on interest and
principal for these borrowed funds will rise from $6.0 billion
this year to $6.9 billion in 2015, a year-to-year increase of
nearly 15 percent. Under the plan, debt service would continue
to rise, reaching $7.6 billion in 2017, an average annual
increase of 8.3 percent from 2014 through 2017.
Over the past few years, the Bloomberg Administration has
consistently projected that interest rates would be
substantially higher than they actually were. In the November
plan the Mayor’s budget office recognized $84 million in savings
this year on its variable rate debt due to lower-than-projected
interest rates. In addition, changes in the amounts planned for
borrowing and refunding of existing debt enabled the Mayor’s
budget office to claim savings of $38.7 million this year and
$91.9 million next year. The Mayor’s budget office also
recognized savings on debt issued through the city’s
Transitional Finance Authority: $19 million this year and $43
million in 2015. Still, even if additional savings are
recognized later in the fiscal year because interest rates
remain lower than the city’s revised estimates, debt service
will continue to be a driver of city spending. And with
expectations that Federal Reserve policy will allow interest
rates to begin to rise towards the end of calendar year 2014, it
will become more difficult for the city to continue to reap such
large savings on debt service.
The Department
of Education also continues to be a major source of city
spending in terms of total dollars—about 28 percent of next
year’s entire projected budget—as well as increased spending
over the 2014 through 2017 period. IBO projects education
department spending will rise by $400 million in 2015 and reach
$20.2 billion. By 2017, IBO anticipates education department
spending will total $21.3 billion, an increase of $1.5 billion
over 2014-2017 at an average annual rate of 2.5 percent.
Although the
plan expects that state aid for schools will increase by about
$960 million over 2014 through2017 and reach $9.6 billion,
city-generated funds will continue to be a major share of the
increased spending. About half of next year’s budgeted increase
comes from city funds, which will grow from $9.3 billion this
year to $9.5 billion in 2015. The budget plan expects that
federal aid for the city’s schools will increase minimally in
the coming years and grow by less than $12 million to total $1.8
billion in 2017.
Health insurance and other fringe benefits for city employees
and retirees are the other major factor driving increased city
spending. Expenditures on health insurance and other fringe
benefits are
expected to grow by $139 million in 2015 (after adjusting for
the use of $1 billion from the Retiree Health Benefits Trust
Fund in 2014) and
total $5.2 billion. By 2017, health and related costs are
expected to rise by an additional $924 million and reach $6.1
billion, an average rate of growth of 6.7 percent over 2014
through 2017.
|
IBO
Expenditure Projections
Dollars in millions |
|||||
|
|
2014 |
2015 |
2016 |
2017 |
Average Change |
|
Health & Social Services |
|
|
|
|
|
|
Social Services |
|
|
|
|
|
|
Medicaid |
$6,549
|
$6,629
|
$6,598
|
$6,598
|
0.3% |
|
All Other Social Services |
2,927
|
2,893
|
2,862
|
2,863
|
-0.7% |
|
HHC |
261
|
81
|
81
|
81
|
-32.3% |
|
Health |
1,395
|
1,362
|
1,359
|
1,359
|
-0.9% |
|
Children Services |
2,809
|
2,816
|
2,816
|
2,816
|
0.1% |
|
Homeless |
1,030
|
993
|
993
|
993
|
-1.2% |
|
Other Related Services |
645
|
556
|
524
|
524
|
-6.7% |
|
Subtotal |
$15,616
|
$15,331
|
$15,232
|
$15,233
|
-0.8% |
|
Education |
|
|
|
|
|
|
DOE (excluding labor reserve) |
$19,791
|
$20,191
|
$20,779
|
$21,324
|
2.5% |
|
CUNY |
870
|
833
|
835
|
826
|
-1.7% |
|
Subtotal |
$20,661
|
$21,024
|
$21,614
|
$22,150
|
2.3% |
|
Uniformed Services |
|
|
|
|
|
|
Police |
$4,716
|
$4,656
|
$4,644
|
$4,637
|
-0.6% |
|
Fire |
1,953
|
1,809
|
1,789
|
1,770
|
-3.2% |
|
Correction |
1,069
|
1,077
|
1,078
|
1,077
|
0.3% |
|
Sanitation |
1,416
|
1,464
|
1,463
|
1,464
|
1.1% |
|
Subtotal |
$9,153
|
$9,007
|
$8,973
|
$8,948
|
-0.8% |
|
All Other Agencies |
$9,111
|
$8,042
|
$8,099
|
$8,252
|
-3.5%* |
|
Other Expenditures |
|
|
|
|
|
|
Fringe Benefits
|
$4,062
|
$5,200
|
$5,716
|
$6,148
|
6.7%** |
|
Debt Service |
5,592
|
4,468
|
7,311
|
7,643
|
8.3%* |
|
Pensions |
8,190
|
8,116
|
8,227
|
8,395
|
0.8% |
|
Judgments and Claims |
663
|
674
|
710
|
746
|
4.0% |
|
General Reserve |
150
|
300
|
300
|
300
|
n/a |
|
Labor Reserve: |
|
|
|
|
|
|
Education |
-
|
-
|
-
|
-
|
n/a |
|
All Other Agencies |
265
|
465
|
714
|
983
|
n/a |
|
Expenditure Adjustments |
-
|
56
|
123
|
219
|
n/a |
|
Total Expenditures |
$73,463
|
$72,683
|
$77,019
|
$79,017
|
2.5% |
|
NOTES: *Represents the annual average change after
adjusting for prepayments.
Independent Budget
Office |
|||||
While
expenditures on Medicaid and pensions for city employees remain
significant components of city spending, they each are growing
at rates of less than 1 percent a year. The city’s contribution
for pensions is projected to rise from $8.2 billion this year to
$8.4 billion in 2017, a relatively modest increase of $200
million. The expected increase in Medicaid spending is even
smaller, just $49 million, as it inches up from $6.5 billion
this year to just under $6.6 billion in 2017.
Cost
Differences.
There are a
number of program areas where IBO has modestly different
estimates of costs than those presented by the Bloomberg
Administration. One area of difference is the projected cost of
shelter for the homeless. Although the daily census and length
of stay in family shelters is higher this fiscal year than last,
the Bloomberg Administration has budgeted slightly less funds.
We estimate that the cost of providing shelter to families will
be $49 million ($17 million in city funds, the remainder state
and federal) higher this year than the $490 million currently
allocated. We also expect that the already delayed plan to have
families with young children share living space will not proceed
in 2015 and when combined with the higher shelter census will
add $75 million ($23 in million city-generated dollars) to next
year’s cost for sheltering homeless families. In addition, the
state’s highest court recently overturned a Bloomberg
Administration plan for diverting single adults from the shelter
system, which we expect to add another $2 million annually to
the cost of providing shelter for the homeless.
In addition, IBO
estimates that the city will need to add $65 million of its own
funds to meet projected budget needs for the education
department this fiscal year. Two factors drive this estimated
need. One factor is the expectation that the education
department will not be able to achieve the level of Medicaid
reimbursements for special education related services forecast
in the budget plan. Despite investment in a new claiming system,
the education department continues to fall well below its
projections. The shortfall in Medicaid claims is projected to
cost the city $59 million in 2014. The other factor is the
underestimate of enrollment in charter schools, which repeats a
pattern of recent years and will add $6.6 million in additional
city expenditures this year and $21 million in 2015.
IBO also
forecasts that overtime for police and correction officers will
cost more that has been budgeted: $25 million annually for
police officers in 2014-2017 and $15 million a year for
correction officers in 2015-2017. Conversely, IBO projects that
the Bloomberg Administration over-budgeted for the city’s share
of public assistance costs in 2014-2017 by about $45 million a
year.
New Needs.
The
November budget plan adds $129 million in 2014 and $167 million
in 2015 for what are termed new needs. The largest of these
needs is additional funding to cover personnel costs for newly
hired firefighters. The budget plan adds $47 million this year
and $75 million next year for firefighter staffing.
The plan also
adds $24 million just for 2015 to pay for senior and youth
services in the city’s public housing developments that were
previously funded by the housing authority. Funds also have been
added by the Bloomberg Administration to continue and expand the
pilot program for the collection of residential organic waste.
Now operating in Westerleigh in Staten Island, the program will
expand to selected neighborhoods in the other boroughs at a
total cost of $8.3 million this year and an additional $7.9
million in 2015.
Federal
Cutbacks, Local Costs.
Budget measures
in Washington are adding to the pressure on the city’s already
fiscally strained public housing and public hospitals. Federal
subsidies for public housing have been shrinking for a number of
years. Sequestration that went into effect in March cut $205
million in aid to the city’s housing authority, including $114
million from the originally expected $907 million in federal
operating subsidies. Under the Affordable Care Act, the federal
government will cut in half its subsidy to hospitals that treat
large numbers of uninsured patients. The cut starts relatively
small this year and then begins ramping up in 2017, when the
city’s Health and Hospitals Corporation could lose $56 million,
and more than $100 million annually in the ensuing years. While
the affordable Care Act should increase the number of New
Yorkers with health insurance, the public hospitals will likely
continue to treat large numbers of undocumented immigrants who
will still not be insured.
Music Over
for Budget Dance?
With little fanfare, the Mayor’s financial plan restores funding
in fiscal years 2015 through 2017 for dozens of programs that
have typically been the focus of annual budget negotiations
between the Council and the Mayor. In past years, the Mayor
would leave funding for these programs out of the budget and
then agree during negotiations to restore all or some of the
funds for just the upcoming fiscal year. This process, which
predates the Bloomberg Administration, became known as the
“budget dance.”
In recent years, restorations for these
programs have totaled about $400 million annually. Mayor
Bloomberg’s financial plan matches the amounts restored for each
program in 2014 and adds them to the budgets for each fiscal
year from 2015 through 2017. For example, the $51 million
restored for the Out-of-School Time program in 2014 has now been
added, or baselined, in 2015 through 2017 as well. About $30
million has been restored to the parks department through 2017
for a variety of purposes previously subject to the annual dance
of cuts and restorations such as funds for pools and seasonal
maintenance workers. Likewise, the same $6.0 million
unrestricted subsidy to the public hospitals, $5.1 million for
supportive housing services for people with AIDS, and $1.5
million to support food pantries across the city that was
restored in 2014 during last spring’s budget process has now
been baselined in
the financial plan through 2017.
There is at
least one notable exception to this extension of 2014
restorations to the rest of the financial-plan period: fire
companies. In 2014, $44 million was added to the budget to
prevent the Mayor’s plan to eliminate staffing of 20 fire
companies. The November financial plan does not include these
funds for 2015 through 2017.
Sandy.
The budget for
2014 includes about $1.1 billion in federal funds to help the
city in the aftermath of Hurricane Sandy. Most of these funds,
$957 million, came through an initial allocation of Community
Development Block Grant-Disaster Relief dollars. (A second
allocation of more than $1.4 billion has not yet been received
and so is not accounted for in the city’s budget plan.) More
than a third of the funds the city has through the initial
allocation, just over $360 million, have been budgeted with the
Department of Environmental Protection to assist multifamily
housing. An additional $327 million is budgeted in the
Department of Small Business Services mainly to aid businesses
affected by the storm. The funds will be distributed by the
Economic Development Corporation, though there is no timetable
yet.
This year’s
budget also includes $145 million in aid from the Federal
Emergency Management Agency. About $83 million of these funds
are being used for emergency protective measures, $29 million
for buildings and equipment related to post-storm recovery, and
$14 million for debris removal.
From
Surplus to Shortfall?
Rather than the fiscal burden predicted by some budget watchdogs
in recent months, Mayor-elect de Blasio and the new City Council
will inherit a budget for 2015 with a surplus of nearly $2
billion based on IBO’s tax revenue and spending estimates under
the terms of the Bloomberg Administration’s latest financial
plan. But this inheritance must be looked at with a good bit of
caution.
Foremost among
the reasons for caution are the expectations built into the
budget plan with regard to a settlement of expired contracts
with the city’s municipal unions. A costless settlement covering
the years of expired contracts prior to 2014 may be more doable
on paper than in practice. Depending on the terms of the
settlements, the projected surplus could quickly evaporate. In
May, IBO estimated that under one plausible scenario the cost of
settlements with the unions could be $6.3 billion through 2014.
In this scenario, the teacher and principal unions would get the
same 4 percent raises other unions received in 2008-2010 and all
the municipal unions would get 2 percent wage increases from the
point their contracts expired in the years 2010-2013.
Moreover,
diminished federal aid, especially for the city’s public housing
and hospitals, may present increasing fiscal challenges. And the
projected surplus for 2015 may fuel expectations for expanding
services or cutting taxes. Given the city’s balanced budget
requirements, new initiatives that entail recurring costs will
need to be funded by recurring revenue or savings elsewhere in
the budget.
A number of economic risks could also upend IBO’s tax revenue forecast, shrinking or even reversing the projected surplus. Long-expected regulations for Wall Street are beginning to fall into place, including recent approval of the Volcker rule. These regulations will likely decrease the profitability of the city’s big banks. The extent to which New York City’s economy can continue to grow without the kind of boost from Wall Street the city has benefited from in the past remains to be seen. Overseas events also could affect local growth. Chief among these are the economic and fiscal difficulties facing Europe and China, which have already begun to have an impact on international trade and finance.
Balancing the desire to come to terms with the unions, make up for diminished federal aid, and meet public expectations for local services may be difficult and could quickly erode the projected surplus. The city’s fiscal outlook is a long way from that of Detroit, as some doomsayers portrayed it earlier this year. But the Bloomberg Administration’s last financial plan does not reflect all the fiscal pressures ahead.Endnotes
1See
IBO Fiscal Brief, “Unraveling the
Discrepancy Between City Job Growth & A High Unemployment Rate,”
February 2013.
2For additional information about the complications of the city’s
real property tax, see “Twenty-Five
Years After S7000A:
How Property Tax Burdens Have Shifted in New York City,”
Independent Budget Office for New York City, December 2006. When
IBO refers to market values and assessments, the reference
includes only taxable property. The assessed value for tax
purposes (also referred to as billable taxable value) reflects
the required phase-in of assessment changes for apartment,
commercial, and industrial buildings. In this report the
billable taxable values are shown before applying the STAR
exemptions.