Category Archives: Buildings
Which New York City Neighborhoods Saw the Most—and Fewest—Tenants Move from Rent-Stabilized Apartments in 2010-2015?
The city’s diminishing stock of rent-stabilized apartments is highly sought after by prospective tenants because these regulated units often rent at below-market rates and offer a variety of tenant protections including the right to lease renewal. Yet information about the rate at which these apartments turn over tenancies—when the tenant changes from one year to the next—has been lacking. Vacancy rate estimates only capture the number of units empty at a specific point in time and not what became available over the course of a year.
To address this question, IBO examined tenant information for over 925,000 apartments that were rent stabilized for at least two years from 2010 through 2015 to calculate how many apartments turn over from one year to the next and how turnover rates vary by neighborhood. High turnover rates may indicate tenant mobility, changing neighborhood characteristics, or landlord efforts to vacate apartments to increase the legal rent of a rent-stabilized unit—or to reach a rent level that would enable deregulation. In contrast, low turnover rates may indicate tenant stability, or that tenants feel locked in to their rent-stabilized apartments because of their below-market rents when they otherwise may have considered moving.
Average Annual Turnover Rate of Rent-Stabilized
Apartments by Neighborhood, 2010-2015
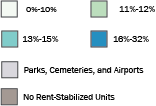
- Citywide, IBO found the annual turnover rate for rent-stabilized apartments averaged 12 percent over the years 2010-2015.
There was a substantial difference citywide in turnover rates between buildings built prior to 1974 and those built later. The apartments in buildings that were built after 1974 are generally stabilized in exchange for special tax benefits and have rents that tend to be closer to their neighborhood’s market rate. These newer buildings had an average turnover rate of 20 percent citywide while older buildings, in contrast, had an average turnover rate of 11 percent. - Neighborhoods with some of the highest average rates of tenant turnover in rent-stabilized units were Battery Park City-Lower Manhattan (32 percent), New Dorp-Midland Beach on Staten Island (28 percent), and Douglas Manor-Douglaston-Little Neck in Queens (25 percent), although there were few rent-stabilized units in these Staten Island and Queens neighborhoods. Battery Park City-Lower Manhattan has a high share of units built in 1974 or later.
- In neighborhoods with large numbers of pre-1974 rent-stabilized units, those with high average turnover rates include Morningside Heights (17 percent), Astoria (15 percent), and Bay Ridge (also 15 percent), located in Manhattan, Queens, and Brooklyn, respectively.
- Neighborhoods with substantial numbers of pre-1974 rent-stabilized units and low turnover rates include West Concourse in the Bronx, Washington Heights South in Manhattan, and Flatbush in Brooklyn, all with a turnover rate of 9 percent.
SOURCES: IBO analysis of data from New York State Homes and Community Renewal and New York City Department of Finance Real Property Assessment Data
NOTES: A total of 986,807 rent-stabilized units were analyzed from 2010 through 2015, of which 925,116 had at least two years of tenant data to generate a turnover rate. These units reflect apartments that were registered with New York State Homes and Community Renewal (HCR) by their landlords, although analysis indicates that not all stabilized units that should be registered with the state actually are. Years refer to the year in which building owners registered their units with HCR. For each pair of years for which tenancies were compared, IBO determined if an apartment turned over by comparing the names of the primary tenant against the primary tenant for the following year. Names were compared using first and last name combinations to correct for spelling errors and different entry formats across year to year apartment registrations. Neighborhoods are defined by the Department of City Planning Neighborhood Tabulation Areas.
Print version available here.
Prepared by Sarah Stefanski
New York City Independent Budget Office
Which Sections of the City Generate the Most & Least Complaints to Graffiti-Free NYC?
Graffiti-Free NYC is a city program that removes graffiti at no cost to the owners of residential, commercial, or industrial buildings. Anyone can report graffiti on any property by calling 311. The program is run jointly by the city’s Economic Development Corporation, Department of Sanitation, and the Community Affairs Unit of the Mayor’s office.
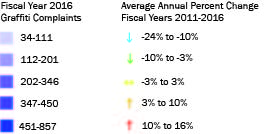
- Since fiscal year 2011, Graffiti-Free NYC has received an average of 14,916 complaints a year. But the numbers of complaints citywide are declining, from 15,393 in 2011 to 13,415 in 2016.
- In 2016, the heaviest concentrations of complaints were in Central and Southwest Brooklyn and in Lower Manhattan. Complaints have been largely down in the rest of the city since 2011, particularly in the South Bronx and Queens.
- In 2011 through 2013 it took an average of 67 days from receipt of a graffiti complaint for Graffiti-Free NYC to send a team to clean the site. In 2014 and 2015 it took an average of 114 days for a response (data is not complete for 2016).
- The increased response time may mean owners or neighbors are taking matters into their own hands. The percentage of complaints that resulted in graffiti removal has declined from 84 percent in 2011 to 62 percent in 2015 as cleaning crews responding to complaints increasingly find no graffiti at the reported location.
- The budget for Graffiti-Free NYC from fiscal year 2011 through fiscal year 2016 has averaged $1.9 million annually, with the majority of the funding in recent years coming from a federal grant program. While the federal funding is no longer available, the Mayor has increased the city funding for the program to $2.5 million in 2017.
Prepared by Daniel Huber
New York City Independent Budget Office
Print version available here.
SOURCE: IBO analysis of Department of Sanitation data
NOTE: Map divisions are based on City Council districts.
| New York City By The Numbers |
How Many Rent-Regulated Units Are Rented at Preferential Rates and Where Are They Located?
It is commonly assumed that rent regulation limits the amount owners can charge tenants, keeping rents below what the market would otherwise command. Yet for thousands of apartments across the city, landlords charge their tenants rents that are lower than the maximum allowed under rent-regulation rules. This is known as a preferential rent. While landlords will sometimes forgo additional permissible rent to retain a reliable tenant, in neighborhoods where there are large shares of tenants paying preferential rents, it is an indication that local market rents are not constrained by rent regulations.
Using apartment registration data from the New York State Division of Housing and Community Renewal, IBO found that of the 765,354 state-registered units subject to the traditional rent-regulation rules in 2013 (the most recent data available), 23 percent—more than 175,000 apartments—were rented at a preferential rate.
Share of Regulated Units Rented at Preferential Rates
Click on a neighborhood to see number of rent-regulated apartments and share with preferential rents.

- Neighborhoods with some of the highest shares of tenants in regulated units paying preferential rates were Oakwood in Staten Island (62 percent), and Fresh Meadows and Bay Terrace in Queens (61 percent and 60 percent, respectively). The overall number of regulated units in these areas, however, was small.
- In neighborhoods with large numbers of regulated units, those with high shares of units receiving preferential rents include Flushing (38 percent), Astoria (35 percent), and Hunters Point-Sunnyside (34 percent).
- Some of the neighborhoods with substantial numbers of regulated units and the lowest shares of apartments with preferential rents include the West Village (10 percent) and the Upper West Side (10 percent). Outside of Manhattan, Borough Park (15 percent) and Prospect-Lefferts Gardens (17 percent) in Brooklyn had low shares of preferential rents.
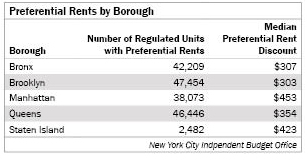
- The prevalence and extent of the rent preference varies among the boroughs. Brooklyn had the largest number of regulated units receiving preferential rents, followed by Queens.
- In terms of the median preferential rent discount—the difference between what the tenant pays and the maximum legal rent the landlord could charge under rent regulation—apartments in Manhattan had the largest median discount, while units in Brooklyn had the smallest.
The fact that in some parts of the city more than a quarter of units receive preferential rents indicates that rent regulation is not always the most important factor in determining a tenant’s rent. Barring substantial increases in market rents in the neighborhoods with large shares of regulated units with preferential rates, continued regulation might not make much difference in determining the cost of housing for tenants in those areas.
Prepared by Sarah Stefanski
New York City Independent Budget Office
SOURCE: IBO analysis of data from the New York State Division of Housing and Community Renewal
NOTES: A total of 862,254 regulated units were registered with the New York State Division of Housing and Community Renewal in 2013, approximately 84 percent of the total estimated number of rent-regulated units in the city. A total of 96,900 units added into rent regulation after 1974 in exchange for certain financing benefits, such as the 421-a and 421-g tax incentive programs, were excluded from this analysis.
Print version available here.
| New York City By The Numbers |
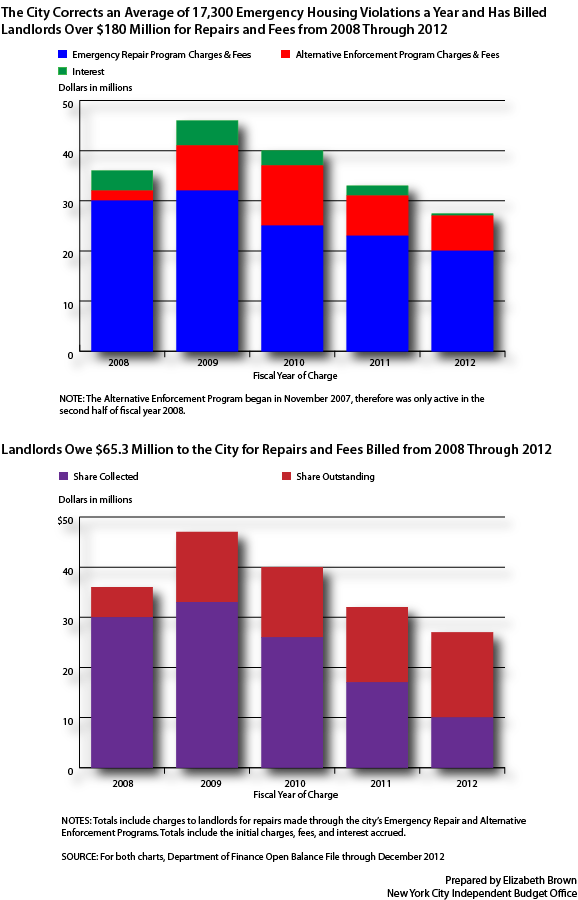
How Much is NYC Paying to Make Housing Repairs That Should be Done by Landlords?
The city has two repair programs that step in when residential landlords fail to maintain their buildings:
Emergency Repair Program. If a landlord fails to correct the most serious housing code violations, the city may make the repairs (or contract out the work) and bill the owner for the cost of the repair and administrative fees.
Alternative Enforcement Program. Each year the city selects the 200 most distressed residential buildings for participation. If the owner fails to make repairs, the city may do so and bill the owner accordingly. For more information see IBO’s fiscal brief on alternative enforcement.
PDF version here.